Housing density: 323 houses/condos per square mile
Median price asked for vacant for-sale houses and condos in 2022 in this county: $820,471.
Median contract rent in 2022: over $2,000 (lower quartile is $1,427, upper quartile is over $2,000)
Median rent asked for vacant for-rent units in 2022: $1,459
Median gross rent in New Canaan, CT in 2022: over $2,000
Housing units in New Canaan with a mortgage: 3,576 (291 second mortgage, 688 home equity loan, 7 both second mortgage and home equity loan) Houses without a mortgage: 1,426
In family households: 768,709 (156,025 male householders, 76,871 female householders)
178,028 spouses, 283,184 children (270,358 natural, 5,825 adopted, 7,001 stepchildren), 13,517 grandchildren, 10,152 brothers or sisters, 9,951 parents, foster children, 13,466 other relatives, 21,162 non-relatives
In nonfamily households: 128,952 (44,659 male householders (33,783 living alone)), 57,990 female householders (49,710 living alone)), 26,303 nonrelatives
In group quarters: 19,168 (9,152 institutionalized population)
167,032 married couples with children.
41,379 single-parent households (6,664 men, 34,715 women).
89.1% of residents of New Canaan speak English at home.
2.6% of residents speak Spanish at home (80% speak English very well, 17% speak English well, 4% speak English not well).
6.8% of residents speak other Indo-European language at home (78% speak English very well, 19% speak English well, 3% speak English not well).
1.2% of residents speak Asian or Pacific Island language at home (65% speak English very well, 15% speak English well, 16% speak English not well, 4% don't speak English at all).
0.3% of residents speak other language at home (100% speak English very well).
Foreign born population: 2,730 (13.5%)
(57.5% of them are naturalized citizens)
Year of entry for the foreign-born population in New Canaan, Connecticut
3971995 to March 2000
2001990 to 1994
2071985 to 1989
1531980 to 1984
1391975 to 1979
1071970 to 1974
1171965 to 1969
465Before 1965
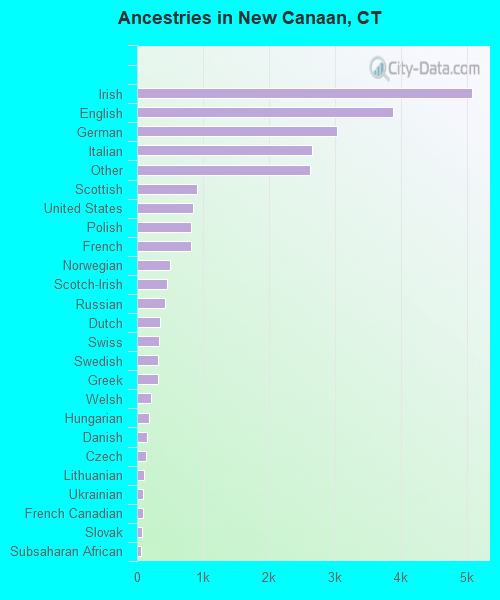
First ancestries reported:
Irish: 5,081 (20.7%)
English: 3,874 (15.8%)
German: 3,029 (12.3%)
Italian: 2,651 (10.8%)
Other: 2,617 (10.7%)
Scottish: 905 (3.7%)
United States: 843 (3.4%)
Polish: 818 (3.3%)
French: 816 (3.3%)
Norwegian: 500 (2.0%)
Scotch-Irish: 456 (1.9%)
Russian: 420 (1.7%)
Dutch: 346 (1.4%)
Swiss: 326 (1.3%)
Swedish: 324 (1.3%)
Greek: 316 (1.3%)
Welsh: 211 (0.9%)
Hungarian: 183 (0.7%)
Danish: 145 (0.6%)
Czech: 131 (0.5%)
Lithuanian: 105 (0.4%)
Ukrainian: 90 (0.4%)
French Canadian: 84 (0.3%)
Slovak: 77 (0.3%)
Subsaharan African: 59 (0.2%)
Arab: 55 (0.2%)
West Indian: 45 (0.2%)
Portuguese: 26 (0.1%)
Most common places of birth for foreign-born residents (%):
United Kingdom
New Canaan:
16.8% (300)
Connecticut:
4.4% (16,395)
Canada
New Canaan:
7.5% (133)
Connecticut:
5.2% (19,083)
Italy
New Canaan:
6.1% (109)
Connecticut:
7.0% (26,023)
Germany
New Canaan:
5.9% (106)
Connecticut:
3.1% (11,432)
Japan
New Canaan:
4.7% (84)
Connecticut:
0.9% (3,472)
Poland
New Canaan:
4.5% (81)
Connecticut:
6.9% (25,507)
Iran
New Canaan:
3.9% (70)
Connecticut:
0.4% (1,513)
Other Western Europe
New Canaan:
3.7% (66)
Connecticut:
0.5% (1,983)
France
New Canaan:
3.0% (53)
Connecticut:
0.7% (2,742)
India
New Canaan:
2.7% (48)
Connecticut:
4.1% (15,108)
Netherlands
New Canaan:
2.4% (42)
Connecticut:
0.4% (1,303)
Other Northern Europe
New Canaan:
2.3% (41)
Connecticut:
0.6% (2,220)
Korea
New Canaan:
2.3% (41)
Connecticut:
1.5% (5,508)
Vietnam
New Canaan:
2.2% (39)
Connecticut:
1.8% (6,680)
Ireland
New Canaan:
2.0% (36)
Connecticut:
1.2% (4,344)
Greece
New Canaan:
2.0% (36)
Connecticut:
1.2% (4,622)
Mexico
New Canaan:
1.9% (34)
Connecticut:
3.6% (13,282)
Dominican Republic
New Canaan:
1.9% (34)
Connecticut:
2.3% (8,500)
Other Eastern Europe
New Canaan:
1.9% (34)
Connecticut:
2.1% (7,596)
Other Western Asia
New Canaan:
1.8% (32)
Connecticut:
0.3% (976)
Australia
New Canaan:
1.7% (30)
Connecticut:
0.3% (1,032)
Other Eastern Africa
New Canaan:
1.6% (29)
Connecticut:
0.3% (1,053)
South Africa
New Canaan:
1.6% (29)
Connecticut:
0.3% (1,269)
Haiti
New Canaan:
1.6% (28)
Connecticut:
2.1% (7,902)
Place of birth for U.S.-born residents:
This state: 6,040
Other state: 11,243
Northeast: 7,443
Midwest: 1,741
South: 1,257
West: 802
63% of New Canaan residents lived in the same house 5 years ago. Out of people who lived in different houses, 57% lived in this county. Out of people who lived in different counties, 6% lived in Connecticut.
Education attainment for males 25 years and older:
No schooling: 17
Nursery to 4th grade: 14
5th and 6th grade: 15
7th and 8th grade: 53
9th grade: 31
10th grade: 30
11th grade: 20
12th grade, no diploma: 4
High school graduate (or equivalency): 481
Less than 1 year of college: 177
Some college more than 1 year, no degree: 406
Associate degree: 139
Bachelor's degree: 1,992
Master's degree: 1,851
Professional school degree: 605
Doctorate degree: 125
Education attainment for females 25 years and older:
No schooling: 16
Nursery to 4th grade: 0
5th and 6th grade: 45
7th and 8th grade: 18
9th grade: 32
10th grade: 54
11th grade: 36
12th grade, no diploma: 43
High school graduate (or equivalency): 716
Less than 1 year of college: 241
Some college more than 1 year, no degree: 698
Associate degree: 346
Bachelor's degree: 2,881
Master's degree: 1,387
Professional school degree: 229
Doctorate degree: 87
Housing units in structures:
One, detached: 5,339
One, attached: 584
Two: 494
3 or 4: 285
5 to 9: 124
10 to 19: 98
20 to 49: 112
50 or more: 89
Mobile homes: 16
Median worth of mobile homes: $844,446
Housing units lacking complete plumbing facilities: 0.1%
Housing units lacking complete kitchen facilities: 0.9%