Nanuet, NY (New York) Houses and Residents
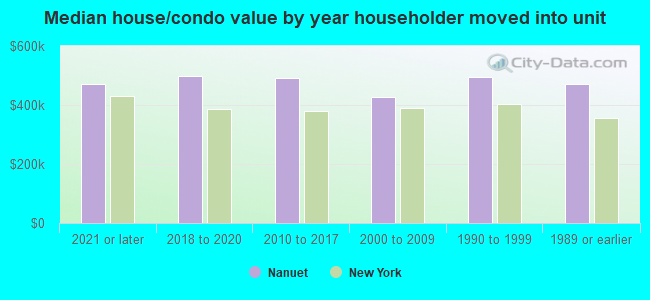
| Nanuet: | $476,138 |
| New York: | $400,400 |
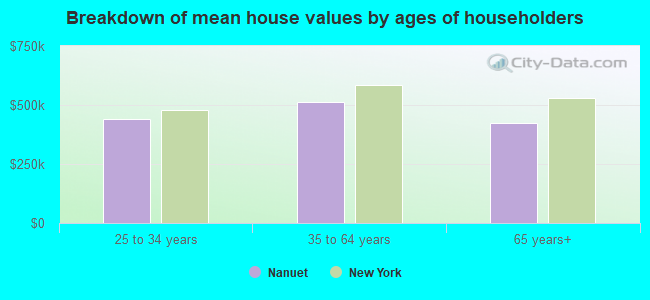
Mean price in 2022:
Detached houses: $562,612
Here: $562,612 State: $476,719 Townhouses or other attached units: $389,805
Here: $389,805 State: $699,270 In 2-unit structures: $463,632
Here: $463,632 State: $713,077 In 3-to-4-unit structures: $218,971
Here: $218,971 State: $764,568 In 5-or-more-unit structures: $239,517
Here: $239,517 State: $912,009 Mobile homes: $98,370
Here: $98,370 State: $88,925
Total population: 17,882 (Urban population: 16,709, Rural population: 0)
Houses: 7,441 (7,070 occupied: 4,733 owner occupied, 2,384 renter occupied)
| % of renters here: | 33% |
| State: | 46% |
Housing density: 1,372 houses/condos per square mile
Median price asked for vacant for-sale houses and condos in 2022 in this county: $364,915.
Median contract rent in 2022: $1,829 (lower quartile is $1,405, upper quartile is over $2,000)
Median rent asked for vacant for-rent units in 2022: $4,643
Median gross rent in Nanuet, NY in 2022: over $2,000
Housing units in Nanuet with a mortgage: 3,030 (212 second mortgage, 16 home equity loan, 165 both second mortgage and home equity loan)
Houses without a mortgage: 214
Median household income for houses/condos with a mortgage: $141,217
Median household income for apartments without a mortgage: $104,648
Median monthly housing costs: $2,163
Compare current foreclosures in Nanuet, NY:
| Photo | Address | Area | Beds / Baths | Price | Details |
|---|---|---|---|---|---|

|
#1
Rammler Ln
Nanuet, NY 10954
|
806 sq. feet
|
2 baths 2 beds |
show details | |

|
#2
Evan Ct
Nanuet, NY 10954
|
1,542 sq. feet
|
3 baths 2 beds |
show details | |

|
#3
New Holland Vlg
Nanuet, NY 10954
|
819 sq. feet
|
1 baths 1 beds |
show details | |

|
#4
Drayton Pl
Nanuet, NY 10954
|
1,840 sq. feet
|
3 baths - beds |
show details | |

|
#5
Grandview Ave
Nanuet, NY 10954
|
3,662 sq. feet
|
5 baths - beds |
show details | |

|
#6
Woodland Ter
Nanuet, NY 10954
|
- sq. feet
|
- baths - beds |
show details | |

|
#7
N Middletown Rd
Nanuet, NY 10954
|
- sq. feet
|
- baths - beds |
show details | |

|
#8
W Nyack Rd Apt 114
Nanuet, NY 10954
|
- sq. feet
|
- baths - beds |
show details | |

|
#9
Jeanne Marie Gdns # 7l
Nanuet, NY 10954
|
- sq. feet
|
- baths - beds |
show details | |

|
#10
Avalon Gardens Dr
Nanuet, NY 10954
|
- sq. feet
|
- baths - beds |
show details |
| Photo | Address | Area | Beds / Baths | Price | Details |
|---|---|---|---|---|---|

|
#11
Old Turnpike Rd Ste 405
Nanuet, NY 10954
|
- sq. feet
|
- baths - beds |
show details | |

|
#12
Old Turnpike Rd Ste 403
Nanuet, NY 10954
|
- sq. feet
|
- baths - beds |
show details | |

|
#13
Argow Pl
Nanuet, NY 10954
|
- sq. feet
|
- baths - beds |
show details | |

|
#14
Sherwood Dr
Nanuet, NY 10954
|
- sq. feet
|
- baths - beds |
show details | |

|
#15
Dykes Park Rd
Nanuet, NY 10954
|
- sq. feet
|
- baths - beds |
show details | |

|
#16
N Pascack Rd
Nanuet, NY 10954
|
- sq. feet
|
- baths - beds |
show details | |

|
#17
Jay St
Nanuet, NY 10954
|
- sq. feet
|
- baths - beds |
show details | |

|
#18
Forest Ridge Rd
Nanuet, NY 10954
|
- sq. feet
|
- baths - beds |
show details | |

|
#19
Spring Brook Rd
Nanuet, NY 10954
|
- sq. feet
|
- baths - beds |
show details | |

|
#20
Tudor Hl
Nanuet, NY 10954
|
- sq. feet
|
- baths - beds |
show details |
| Photo | Address | Area | Beds / Baths | Price | Details |
|---|---|---|---|---|---|

|
#21
Drayton Pl
Nanuet, NY 10954
|
- sq. feet
|
- baths - beds |
show details | |

|
#22
Robert Pl
Nanuet, NY 10954
|
- sq. feet
|
- baths - beds |
show details | |

|
#23
Tudor Hl
Nanuet, NY 10954
|
- sq. feet
|
- baths - beds |
show details | |

|
#24
Lauren Dr
Nanuet, NY 10954
|
- sq. feet
|
- baths - beds |
show details | |

|
#25
Crabapple Ln
Nanuet, NY 10954
|
- sq. feet
|
- baths - beds |
show details | |

|
#26
Meadow Ln
Nanuet, NY 10954
|
- sq. feet
|
- baths - beds |
show details | |

|
#27
Birchwood Ter
Nanuet, NY 10954
|
- sq. feet
|
- baths - beds |
show details | |

|
#28
New Holland Vlg
Nanuet, NY 10954
|
- sq. feet
|
- baths - beds |
show details | |

|
#29
Rammler Ln
Nanuet, NY 10954
|
- sq. feet
|
- baths - beds |
show details | |

|
#30
Sherwood Dr
Nanuet, NY 10954
|
- sq. feet
|
- baths - beds |
show details |
| Photo | Address | Area | Beds / Baths | Price | Details |
|---|---|---|---|---|---|

|
#31
Wyndham Ct # 18
Nanuet, NY 10954
|
- sq. feet
|
- baths - beds |
show details | |

|
#32
Carriage Ln
Nanuet, NY 10954
|
- sq. feet
|
- baths - beds |
show details | |

|
#33
N Pascack Rd
Nanuet, NY 10954
|
- sq. feet
|
- baths - beds |
show details | |

|
#34
2nd Ave
Nanuet, NY 10954
|
- sq. feet
|
- baths - beds |
show details | |

|
#35
Wyndham Ct
Nanuet, NY 10954
|
- sq. feet
|
- baths - beds |
show details | |

|
#36
Lancaster Ct
Nanuet, NY 10954
|
- sq. feet
|
- baths - beds |
show details | |

|
#37
Poplar St
Nanuet, NY 10954
|
- sq. feet
|
- baths - beds |
show details | |

|
#38
Newport Dr
Nanuet, NY 10954
|
- sq. feet
|
- baths - beds |
show details | |

|
#39
Lancaster Ct # 12
Nanuet, NY 10954
|
- sq. feet
|
- baths - beds |
show details | |

|
#40
Westlyn Dr
Nanuet, NY 10954
|
- sq. feet
|
- baths - beds |
show details |
| Photo | Address | Area | Beds / Baths | Price | Details |
|---|---|---|---|---|---|

|
#41
Meadow Ln # 22g
Nanuet, NY 10954
|
- sq. feet
|
- baths - beds |
show details | |

|
#42
Townline Rd
Nanuet, NY 10954
|
- sq. feet
|
- baths - beds |
show details | |

|
#43
Meadow 22g
Nanuet, NY 10954
|
- sq. feet
|
- baths - beds |
show details | |

|
#44
Westlyn Dr
Nanuet, NY 10954
|
- sq. feet
|
- baths - beds |
show details | |

|
#45
Lake Nanuet Dr
Nanuet, NY 10954
|
- sq. feet
|
- baths - beds |
show details | |

|
#46
Rockland Ave
Nanuet, NY 10954
|
- sq. feet
|
- baths - beds |
show details | |

|
#47
Jay St
Nanuet, NY 10954
|
- sq. feet
|
- baths - beds |
show details | |

|
#48
Old Turnpike Rd
Nanuet, NY 10954
|
- sq. feet
|
- baths - beds |
show details | |

|
Check over 1 million property listings on Foreclosure.com!
|
browse all offers | |||

Latest news about housing in Nanuet, NY collected exclusively by city-data.com from local newspapers, TV, and radio stations

 | Condos/townhouses in Pearl River NY area (2 replies) |
| Buying condo in Nanuet (8 replies) |
| Bought a house years ago, kinda regretting it (40 replies) |
| Rockland County (South) schools and deomographic (19 replies) |
| Any New Gyms in Westchester? (13 replies) |
| What is it like living in Suffern 10901? (3 replies) |

Median year apartment built: 1985
Household type by relationship:
Households: 20,689- Male householders: 3,567 (597 living alone), Female householders: 3,488 (1,270 living alone)
3,313 spouses (3,302 opposite-sex spouses), 695 unmarried partners, (695 opposite-sex unmarried partners), 6,118 children (5,887 natural, 91 adopted, 139 stepchildren), 310 grandchildren, 348 brothers or sisters, 663 parents, 66 foster children, 757 other relatives, 907 non-relatives
- In group quarters: 451
Size of family households: 1,759 2-persons, 941 3-persons, 1,023 4-persons, 470 5-persons, 407 6-persons, 133 7-or-more-persons.
Size of nonfamily households: 2,167 1-person, 219 2-persons, 38 3-persons, 11 4-persons.
2,840 married couples with children.
743 single-parent households (269 men, 474 women).
59.9% of residents of Nanuet speak English at home.
20.5% of residents speak Spanish at home (43% speak English very well, 19% speak English well, 36% speak English not well, 1% don't speak English at all).
8.3% of residents speak other Indo-European language at home (59% speak English very well, 26% speak English well, 10% speak English not well, 4% don't speak English at all).
8.1% of residents speak Asian or Pacific Island language at home (79% speak English very well, 16% speak English well, 3% speak English not well, 2% don't speak English at all).
3.5% of residents speak other language at home (79% speak English very well, 14% speak English well, 7% speak English not well).
Foreign born population: 5,640 (27.3%)
(69.0% of them are naturalized citizens)
| Here: | 6.6 |
| State: | 6.3 |
| Here: | 3.8 |
| State: | 3.8 |
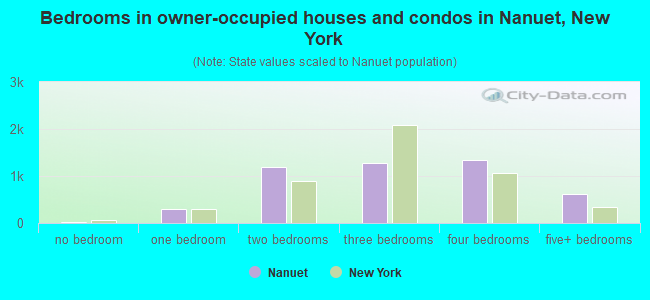
- Bedrooms in owner-occupied houses and condos in Nanuet, New York
- 15no bedroom
- 2951 bedroom
- 1,1912 bedrooms
- 1,2803 bedrooms
- 1,3434 bedrooms
- 6095+ bedrooms
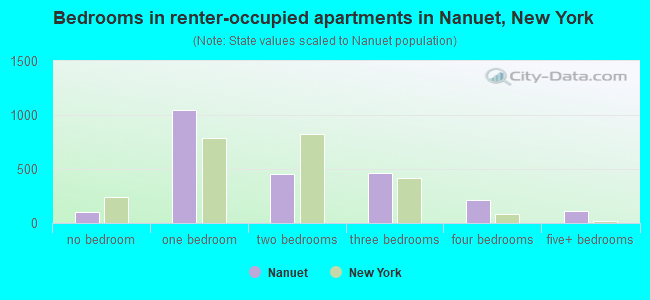
- Bedrooms in renter-occupied apartments in Nanuet, New York
- 100no bedroom
- 1,0451 bedroom
- 4552 bedrooms
- 4593 bedrooms
- 2134 bedrooms
- 1125+ bedrooms
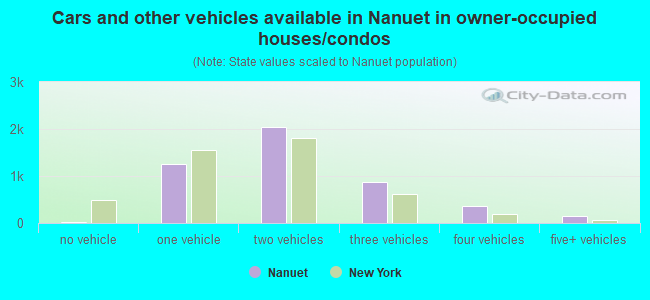
- Cars and other vehicles available in Nanuet in owner-occupied houses/condos
- 27no vehicle
- 1,2611 vehicle
- 2,0482 vehicles
- 8743 vehicles
- 3704 vehicles
- 1535+ vehicles
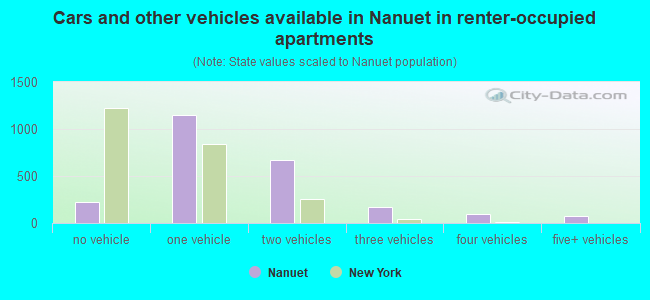
- Cars and other vehicles available in Nanuet in renter-occupied apartments
- 225no vehicle
- 1,1471 vehicle
- 6712 vehicles
- 1743 vehicles
- 974 vehicles
- 705+ vehicles
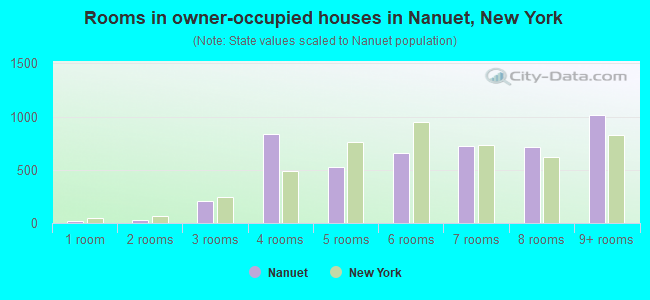
- Rooms in owner-occupied houses in Nanuet, New York
- 151 room
- 312 rooms
- 2043 rooms
- 8364 rooms
- 5285 rooms
- 6606 rooms
- 7277 rooms
- 7168 rooms
- 1,0169+ rooms
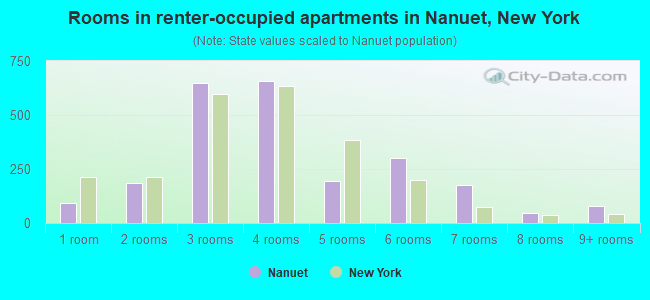
- Rooms in renter-occupied apartments in Nanuet, New York
- 931 room
- 1862 rooms
- 6493 rooms
- 6594 rooms
- 1965 rooms
- 3006 rooms
- 1777 rooms
- 448 rooms
- 819+ rooms
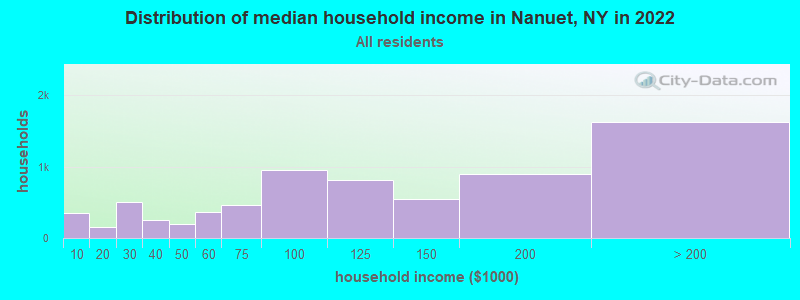
Nanuet, NY household income distribution

- 349Less than $10,000
- 149$10,000 to $19,999
- 499$20,000 to $29,999
- 252$30,000 to $39,999
- 197$40,000 to $49,999
- 361$50,000 to $59,999
- 462$60,000 to $74,999
- 947$75,000 to $99,999
- 818$100,000 to $124,999
- 541$125,000 to $149,999
- 897$150,000 to $199,999
- 1,624$200,000 or more
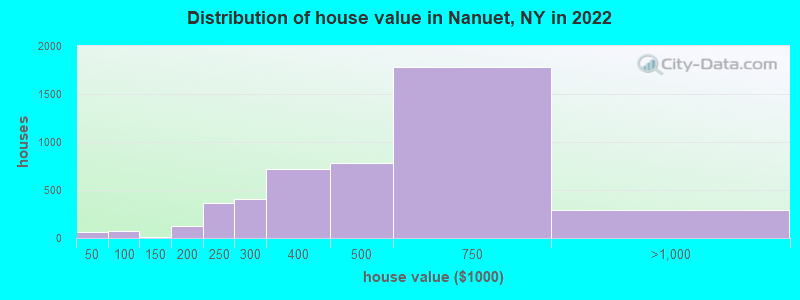
Home value of owner - occupied houses in 2022 in Nanuet, NY
-
- 15Less than $10,000
- 36$10,000 to $14,999
- 3$20,000 to $24,999
- 11$35,000 to $39,999
- 10$50,000 to $59,999
- 62$80,000 to $89,999
- 10$100,000 to $124,999
- 110$150,000 to $174,999
- 18$175,000 to $199,999
- 366$200,000 to $249,999
- 401$250,000 to $299,999
- 714$300,000 to $399,999
- 776$400,000 to $499,999
- 1,780$500,000 to $749,999
- 289$750,000 to $999,999
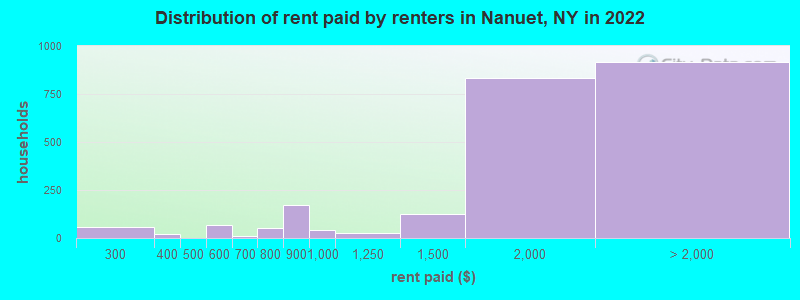
Rent paid by renters in 2022 in Nanuet, NY
-
- 58$250 to $299
- 10$300 to $349
- 11$350 to $399
- 69$500 to $549
- 10$650 to $699
- 51$700 to $749
- 171$800 to $899
- 39$900 to $999
- 25$1,000 to $1,249
- 126$1,250 to $1,499
- 834$1,500 to $1,999
- 247$2,000 to $2,499
- 304$2,500 to $2,999
- 151$3,000 to $3,499
- 39$3,500 or more
- 172No cash rent
Percentage of workers working in this county: 66.9%
Number of people working at home: 1,542 (15.4% of all workers)
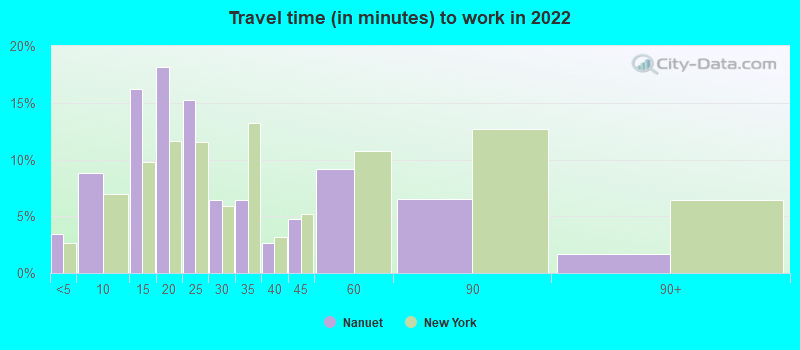
Travel time to work (commute)
- Less than 5 minutes: 266
- 5 to 9 minutes: 751
- 10 to 14 minutes: 1,523
- 15 to 19 minutes: 935
- 20 to 24 minutes: 864
- 25 to 29 minutes: 339
- 30 to 34 minutes: 866
- 35 to 39 minutes: 472
- 40 to 44 minutes: 434
- 45 to 59 minutes: 860
- 60 to 89 minutes: 706
- 90 or more minutes: 496
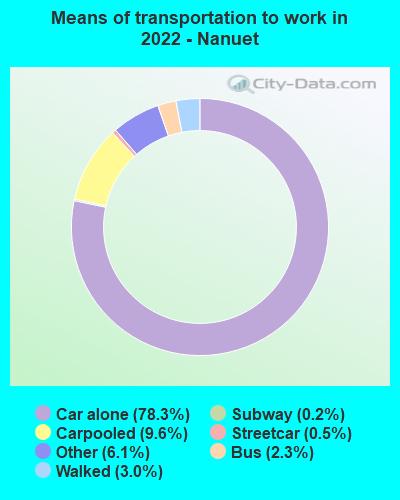
Means of transportation to work:
- Drove a car alone: 6,672 (62.6%)
- Carpooled: 1,038 (9.7%)
- Bus: 203 (1.9%)
- Subway or elevated rail: 27 (0.3%)
- Long-distance train or commuter rail: 25 (0.2%)
- Taxi: 716 (6.7%)
- Walked: 327 (3.1%)
- Worked at home: 1,542 (14.5%)
- Unemployment by race in 2022
- Unemployment rate for White non-Hispanic residents
- 3.9%Males
- 2.8%Females
- Unemployment rate for Black residents
- 5.4%Males
- 3.8%Females
- Unemployment rate for other race residents
- 3.6%Males
- Unemployment rate for two or more race residents
- 2.1%Males
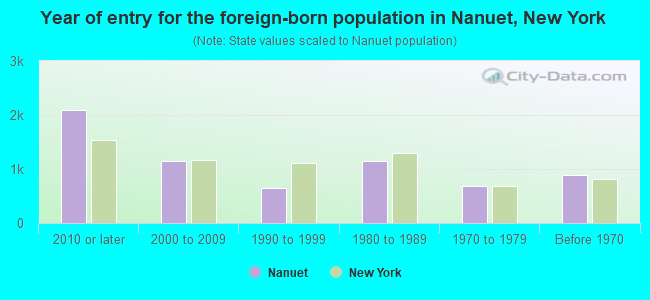
- Year of entry for the foreign-born population in Nanuet, New York
- 2,0952010 or later
- 1,1432000 to 2009
- 6481990 to 1999
- 1,1511980 to 1989
- 6761970 to 1979
- 892Before 1970
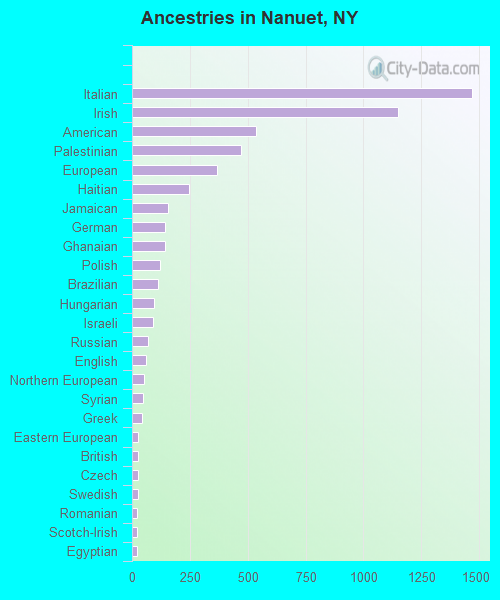
First ancestries reported:
- Italian: 1,469 (13.6%)
- Irish: 1,148 (10.7%)
- American: 536 (5.0%)
- Palestinian: 469 (4.4%)
- European: 366 (3.4%)
- Haitian: 248 (2.3%)
- Jamaican: 156 (1.4%)
- German: 142 (1.3%)
- Ghanaian: 141 (1.3%)
- Polish: 122 (1.1%)
- Brazilian: 113 (1.0%)
- Hungarian: 94 (0.9%)
- Israeli: 90 (0.8%)
- Russian: 71 (0.7%)
- English: 59 (0.5%)
- Northern European: 54 (0.5%)
- Syrian: 47 (0.4%)
- Greek: 42 (0.4%)
- Eastern European: 28 (0.3%)
- British: 27 (0.3%)
- Czech: 25 (0.2%)
- Swedish: 24 (0.2%)
- Romanian: 23 (0.2%)
- Scotch-Irish: 22 (0.2%)
- Egyptian: 21 (0.2%)
- Albanian: 20 (0.2%)
- Turkish: 20 (0.2%)
- Ukrainian: 19 (0.2%)
- West Indian: 14 (0.1%)
- Yugoslavian: 13 (0.1%)
- Canadian: 12 (0.1%)
- Jordanian: 11 (0.1%)
- Portuguese: 10 (0.09%)
- Scottish: 8 (0.07%)
- Slovak: 8 (0.07%)
- Norwegian: 7 (0.06%)
- African: 5 (0.05%)
- French: 5 (0.05%)
Most common places of birth for foreign-born residents (%):
| Nanuet: | 31.0% (1,775) |
| New York: | 3.9% (177,448) |
| Nanuet: | 8.1% (465) |
| New York: | 5.0% (227,557) |
| Nanuet: | 7.6% (435) |
| New York: | 3.5% (158,432) |
| Nanuet: | 5.8% (333) |
| New York: | 2.0% (91,070) |
| Nanuet: | 4.7% (270) |
| New York: | 0.7% (30,658) |
| Nanuet: | 4.7% (268) |
| New York: | 2.8% (126,936) |
| Nanuet: | 3.8% (215) |
| New York: | 0.9% (39,058) |
| Nanuet: | 2.8% (160) |
| New York: | 9.1% (410,910) |
| Nanuet: | 2.8% (158) |
| New York: | 0.7% (33,746) |
| Nanuet: | 2.6% (151) |
| New York: | 1.8% (82,786) |
| Nanuet: | 2.6% (150) |
| New York: | 0.6% (26,772) |
| Nanuet: | 1.9% (108) |
| New York: | 1.4% (61,245) |
| Nanuet: | 1.8% (104) |
| New York: | 0.7% (29,743) |
| Nanuet: | 1.7% (95) |
| New York: | 0.1% (5,923) |
| Nanuet: | 1.6% (92) |
| New York: | 2.4% (108,067) |
Place of birth for U.S.-born residents:
- This state: 12,332
- Other state: 2,329
- Northeast: 1,250
- Midwest: 116
- South: 737
- West: 233
93.1% of Nanuet residents lived in the same house 1 years ago.
Out of people who lived in different houses, 30.9% lived in this county.
Out of people who lived in different counties, 39.4% lived in New York.
| Nanuet: | 93.1% |
| State average: | 89.6% |
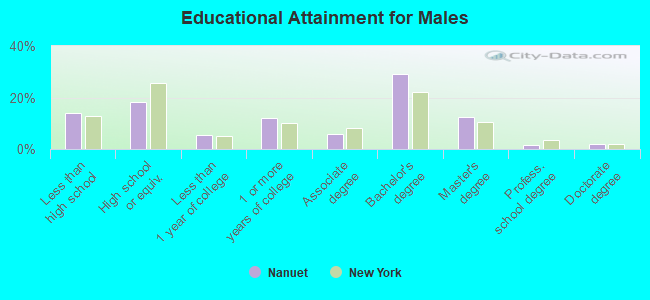
Education attainment for males 25 years and older:
- No schooling: 250
- Nursery to 4th grade: 4
- 5th and 6th grade: 223
- 7th and 8th grade: 22
- 9th grade: 29
- 10th grade: 36
- 11th grade: 268
- 12th grade, no diploma: 162
- High school graduate (or equivalency): 1,291
- Less than 1 year of college: 382
- Some college more than 1 year, no degree: 866
- Associate degree: 423
- Bachelor's degree: 2,071
- Master's degree: 874
- Professional school degree: 104
- Doctorate degree: 127
Education attainment for females 25 years and older:
- No schooling: 94
- Nursery to 4th grade: 14
- 5th and 6th grade: 86
- 7th and 8th grade: 23
- 9th grade: 64
- 10th grade: 35
- 11th grade: 32
- 12th grade, no diploma: 499
- High school graduate (or equivalency): 1,806
- Less than 1 year of college: 332
- Some college more than 1 year, no degree: 686
- Associate degree: 574
- Bachelor's degree: 2,061
- Master's degree: 1,137
- Professional school degree: 206
- Doctorate degree: 77


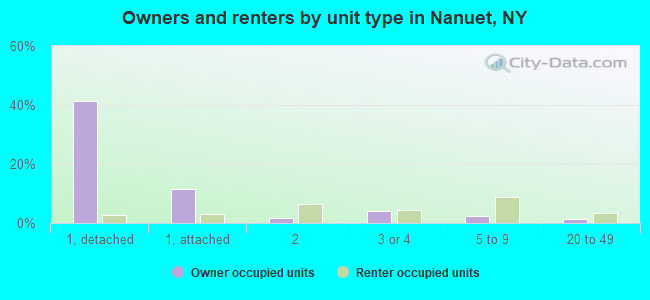
Housing units in structures:
- One, detached: 3,294
- One, attached: 1,072
- Two: 571
- 3 or 4: 600
- 5 to 9: 939
- 10 to 19: 155
- 20 to 49: 363
- 50 or more: 307
- Mobile homes: 137
Median worth of mobile homes: $222,345
Housing units lacking complete kitchen facilities in 2022: 2.1%
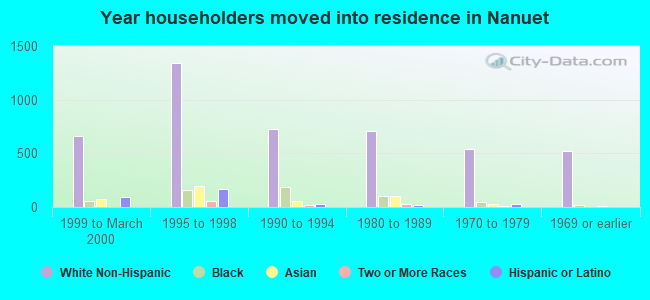
House/condo owner moved in on average 16 years ago
Renter moved in on average 2 years ago
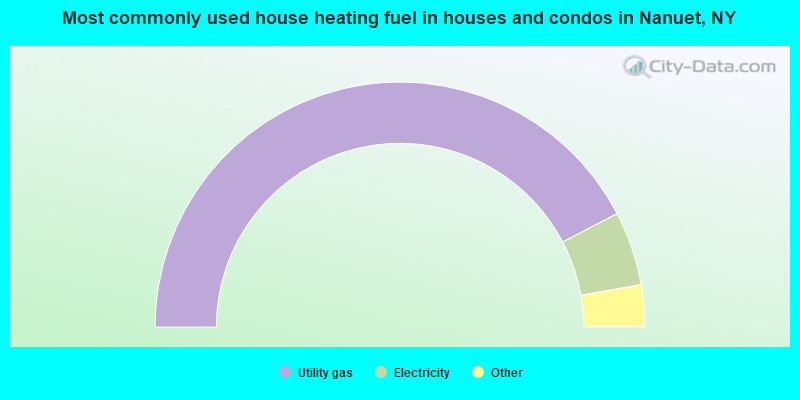
- 84.7%Utility gas
- 9.8%Electricity
- 3.1%Bottled, tank, or LP gas
- 1.1%Fuel oil, kerosene, etc.
- 0.7%Solar energy
- 0.2%Wood
- 0.2%No fuel used
- 0.1%Other fuel
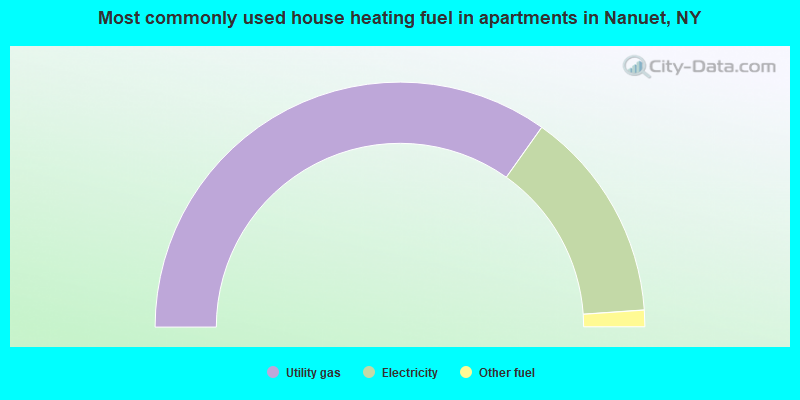
- 69.6%Utility gas
- 28.1%Electricity
- 2.2%Other fuel
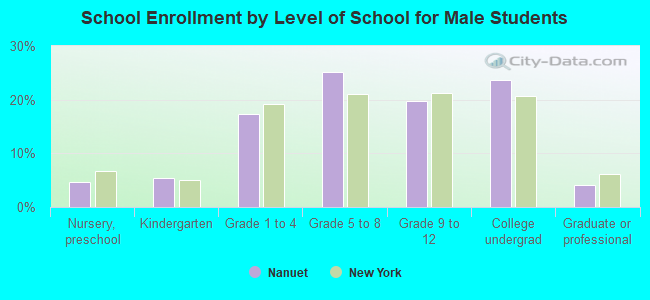
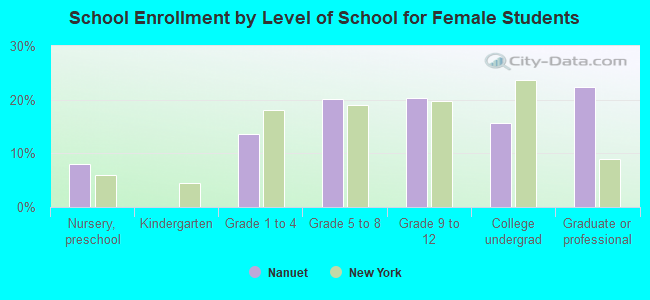
Private vs. public school enrollment:
| Here: | 7.2% |
| New York: | 15.6% |
| Here: | 4.8% |
| New York: | 15.0% |
| Here: | 38.8% |
| New York: | 39.2% |