Montclair, NJ (New Jersey) Houses and Residents
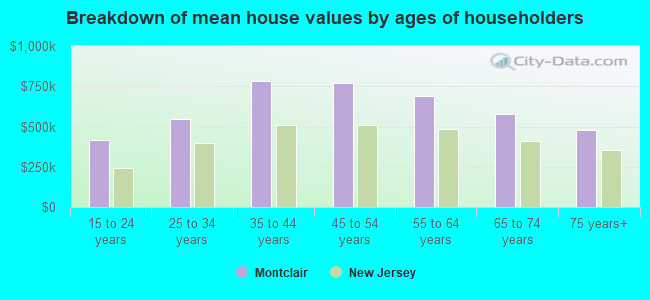
| Montclair: | $745,608 |
| New Jersey: | $428,900 |
Total population: 37,837 (All urban)
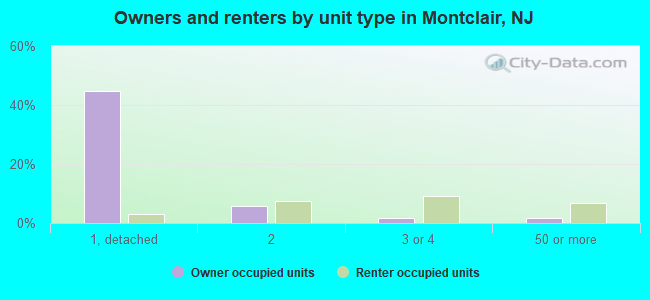
Houses: 15,607 (15,107 occupied: 8,574 owner occupied, 6,533 renter occupied)
| % of renters here: | 43% |
| State: | 35% |
Housing density: 2,476 houses/condos per square mile
Median price asked for vacant for-sale houses and condos in 2022 in this county: $231,294.
Median contract rent in 2022: $1,602 (lower quartile is $1,278, upper quartile is over $2,000)
Median rent asked for vacant for-rent units in 2022: $1,780
Median gross rent in Montclair, NJ in 2022: $1,765
Housing units in Montclair with a mortgage: 5,183 (506 second mortgage, 854 home equity loan, 19 both second mortgage and home equity loan)
Houses without a mortgage: 1,478
Compare current foreclosures in Montclair, NJ:
| Photo | Address | Area | Beds / Baths | Price | Details |
|---|---|---|---|---|---|

|
#1
Valley Way
Montclair, NJ 07042
|
1,158 sq. feet
|
- baths - beds |
show details | |

|
#2
Highland Ave
Montclair, NJ 07042
|
3,536 sq. feet
|
- baths - beds |
show details | |

|
#3
Russell Ter
Montclair, NJ 07042
|
3,106 sq. feet
|
- baths - beds |
show details | |

|
#4
Orange Rd # B8
Montclair, NJ 07042
|
- sq. feet
|
- baths - beds |
show details | |

|
#5
High St
Montclair, NJ 07042
|
1,958 sq. feet
|
- baths - beds |
show details | |

|
#6
Lexington Ave
Montclair, NJ 07042
|
2,314 sq. feet
|
- baths - beds |
show details | |

|
#7
Clarewill Ave
Montclair, NJ 07043
|
3,462 sq. feet
|
- baths - beds |
show details | |

|
#8
Grove St
Montclair, NJ 07042
|
2,978 sq. feet
|
- baths - beds |
show details | |

|
#9
Virginia Ave
Montclair, NJ 07042
|
1,422 sq. feet
|
- baths - beds |
show details | |

|
#10
Grant St # A
Montclair, NJ 07042
|
898 sq. feet
|
- baths - beds |
show details |
| Photo | Address | Area | Beds / Baths | Price | Details |
|---|---|---|---|---|---|

|
#11
Charles St
Montclair, NJ 07042
|
1,680 sq. feet
|
- baths - beds |
show details | |

|
#12
Grant St
Montclair, NJ 07042
|
- sq. feet
|
- baths - beds |
show details | |

|
#13
Willowdale Ave
Montclair, NJ 07042
|
2,984 sq. feet
|
- baths - beds |
show details | |

|
#14
Central Ave
Montclair, NJ 07042
|
3,225 sq. feet
|
- baths - beds |
show details | |

|
#15
Upper Mountain Ave
Montclair, NJ 07043
|
- sq. feet
|
- baths - beds |
show details | |

|
#16
Cooper Ave
Montclair, NJ 07043
|
1,400 sq. feet
|
- baths - beds |
show details | |

|
#17
Orchard Ct
Montclair, NJ 07042
|
2,980 sq. feet
|
- baths - beds |
show details | |

|
#18
Lexington Ave Apt 2f
Montclair, NJ 07042
|
- sq. feet
|
- baths - beds |
show details | |

|
#19
Claremont Ave
Montclair, NJ 07042
|
2,868 sq. feet
|
- baths - beds |
show details | |

|
#20
Central Ave # R
Montclair, NJ 07042
|
- sq. feet
|
- baths - beds |
show details |
| Photo | Address | Area | Beds / Baths | Price | Details |
|---|---|---|---|---|---|

|
#21
Montague Pl
Montclair, NJ 07042
|
1,710 sq. feet
|
- baths - beds |
show details | |

|
#22
Pleasant Ave
Montclair, NJ 07042
|
2,078 sq. feet
|
- baths - beds |
show details | |

|
#23
N Fullerton Ave
Montclair, NJ 07042
|
2,294 sq. feet
|
- baths - beds |
show details | |

|
#24
Pleasant Way
Montclair, NJ 07042
|
1,242 sq. feet
|
- baths - beds |
show details | |

|
#25
Southern Ter
Montclair, NJ 07042
|
1,432 sq. feet
|
- baths - beds |
show details | |

|
#26
Valley Rd
Montclair, NJ 07042
|
2,336 sq. feet
|
- baths - beds |
show details | |

|
#27
Harrison Ave Apt 20
Montclair, NJ 07042
|
- sq. feet
|
- baths - beds |
show details | |

|
#28
Stephen St
Montclair, NJ 07042
|
- sq. feet
|
- baths - beds |
show details | |

|
#29
Pleasant Ave
Montclair, NJ 07042
|
2,078 sq. feet
|
- baths - beds |
show details | |

|
#30
Valley Rd
Montclair, NJ 07042
|
2,437 sq. feet
|
- baths - beds |
show details |
| Photo | Address | Area | Beds / Baths | Price | Details |
|---|---|---|---|---|---|

|
#31
N Fullerton Ave
Montclair, NJ 07042
|
1,838 sq. feet
|
- baths - beds |
show details | |

|
#32
Forest St
Montclair, NJ 07042
|
2,583 sq. feet
|
- baths - beds |
show details | |

|
#33
Highland Ave
Montclair, NJ 07042
|
4,048 sq. feet
|
- baths - beds |
show details | |

|
#34
N Fullerton Ave Apt B13
Montclair, NJ 07042
|
- sq. feet
|
- baths - beds |
show details | |

|
#35
Grant S A
Montclair, NJ 07042
|
- sq. feet
|
- baths - beds |
show details | |

|
#36
Stephen St
Montclair, NJ 07042
|
2,010 sq. feet
|
- baths - beds |
show details | |

|
#37
Upper Mountain Ave
Montclair, NJ 07042
|
6,300 sq. feet
|
- baths - beds |
show details | |

|
#38
Lexington Ave
Montclair, NJ 07042
|
2,932 sq. feet
|
- baths - beds |
show details | |

|
#39
Pine St Apt 317
Montclair, NJ 07042
|
- sq. feet
|
- baths - beds |
show details | |

|
#40
The Cres Apt 2l
Montclair, NJ 07042
|
- sq. feet
|
- baths - beds |
show details |
| Photo | Address | Area | Beds / Baths | Price | Details |
|---|---|---|---|---|---|

|
#41
Hawthorne Pl
Montclair, NJ 07042
|
- sq. feet
|
- baths - beds |
show details | |

|
#42
Stonehenge Rd
Montclair, NJ 07043
|
1,504 sq. feet
|
- baths - beds |
show details | |

|
#43
Elm St
Montclair, NJ 07042
|
1,862 sq. feet
|
- baths - beds |
show details | |

|
#44
Pleasant Ave
Montclair, NJ 07042
|
1,567 sq. feet
|
- baths - beds |
show details | |

|
#45
Walnut St
Montclair, NJ 07042
|
2,239 sq. feet
|
- baths - beds |
show details | |

|
#46
Orange Rd
Montclair, NJ 07042
|
1,392 sq. feet
|
- baths - beds |
show details | |

|
#47
Walnut Cres
Montclair, NJ 07042
|
1,514 sq. feet
|
- baths - beds |
show details | |

|
#48
Charles St
Montclair, NJ 07042
|
- sq. feet
|
- baths - beds |
show details | |

|
#49
Mission St
Montclair, NJ 07042
|
- sq. feet
|
- baths - beds |
show details | |

|
Check over 1 million property listings on Foreclosure.com!
|
browse all offers | |||
Latest news about housing in Montclair, NJ collected exclusively by city-data.com from local newspapers, TV, and radio stations


Household type by relationship:
Households: 760,197- In family households: 645,040 (104,343 male householders, 84,996 female householders)
113,673 spouses, 245,726 children (232,723 natural, 5,793 adopted, 7,210 stepchildren), 20,627 grandchildren, 15,422 brothers or sisters, 11,923 parents, foster children, 19,910 other relatives, 22,762 non-relatives
- In nonfamily households: 115,157 (42,135 male householders (33,262 living alone)), 52,238 female householders (45,266 living alone)), 20,784 nonrelatives
- In group quarters: 23,772 (12,126 institutionalized population)
108,634 married couples with children.
65,899 single-parent households (10,059 men, 55,840 women).
84.6% of residents of Montclair speak English at home.
5.2% of residents speak Spanish at home (72% speak English very well, 16% speak English well, 10% speak English not well, 2% don't speak English at all).
7.1% of residents speak other Indo-European language at home (81% speak English very well, 14% speak English well, 4% speak English not well, 1% don't speak English at all).
1.4% of residents speak Asian or Pacific Island language at home (74% speak English very well, 21% speak English well, 3% speak English not well, 1% don't speak English at all).
1.7% of residents speak other language at home (85% speak English very well, 11% speak English well, 4% don't speak English at all).
Foreign born population: 8,410 (20.1%)
(62.7% of them are naturalized citizens)
| Here: | 7.8 |
| State: | 6.8 |
| Here: | 4.1 |
| State: | 3.9 |
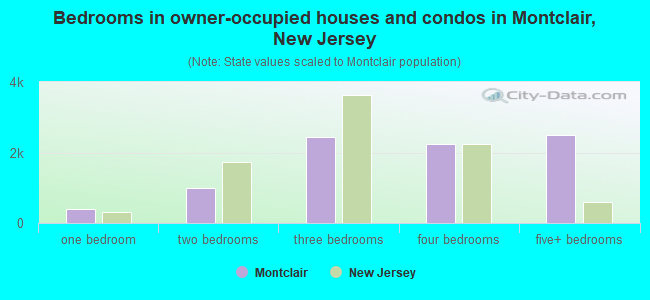
- Bedrooms in owner-occupied houses and condos in Montclair, New Jersey
- 23no bedroom
- 3921 bedroom
- 9852 bedrooms
- 2,4353 bedrooms
- 2,2384 bedrooms
- 2,5015+ bedrooms
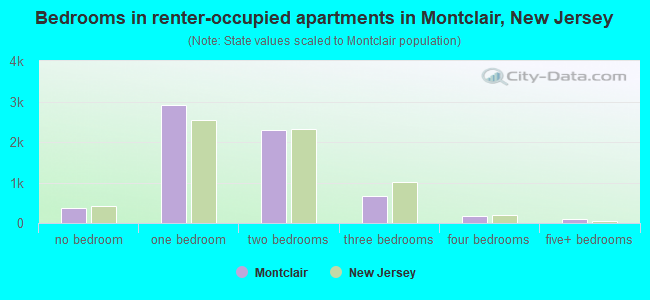
- Bedrooms in renter-occupied apartments in Montclair, New Jersey
- 380no bedroom
- 2,9091 bedroom
- 2,2922 bedrooms
- 6683 bedrooms
- 1794 bedrooms
- 1055+ bedrooms
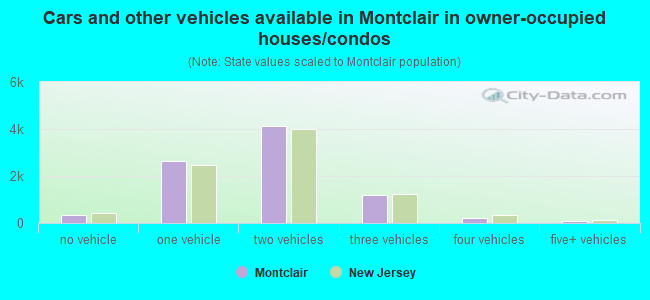
- Cars and other vehicles available in Montclair in owner-occupied houses/condos
- 340no vehicle
- 2,6201 vehicle
- 4,1352 vehicles
- 1,1853 vehicles
- 2204 vehicles
- 745+ vehicles
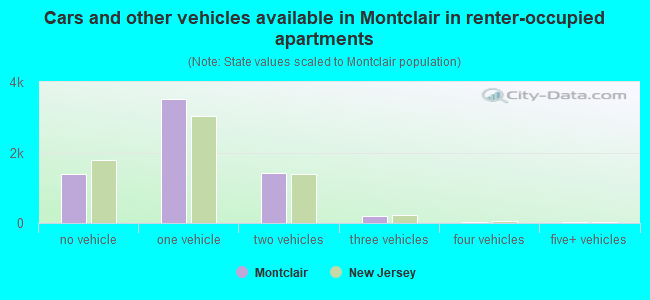
- Cars and other vehicles available in Montclair in renter-occupied apartments
- 1,381no vehicle
- 3,5131 vehicle
- 1,4152 vehicles
- 1863 vehicles
- 174 vehicles
- 215+ vehicles
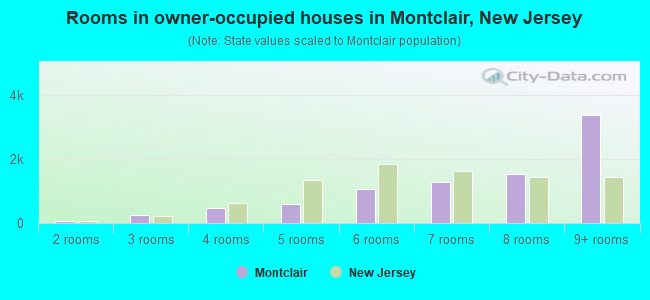
- Rooms in owner-occupied houses in Montclair, New Jersey
- 161 room
- 752 rooms
- 2383 rooms
- 4544 rooms
- 5805 rooms
- 1,0486 rooms
- 1,2787 rooms
- 1,5188 rooms
- 3,3679+ rooms
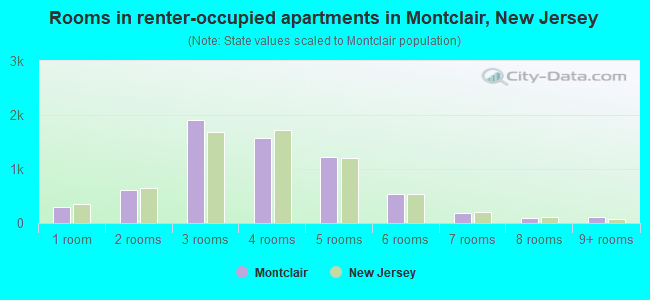
- Rooms in renter-occupied apartments in Montclair, New Jersey
- 2921 room
- 6132 rooms
- 1,9063 rooms
- 1,5754 rooms
- 1,2245 rooms
- 5316 rooms
- 1797 rooms
- 1018 rooms
- 1129+ rooms
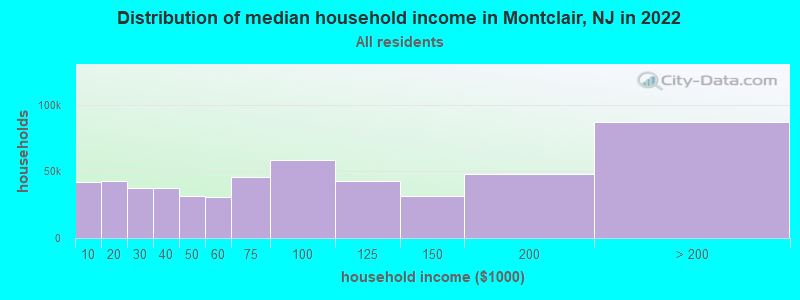
Montclair, NJ household income distribution

- 42,186Less than $10,000
- 42,848$10,000 to $19,999
- 37,795$20,000 to $29,999
- 37,438$30,000 to $39,999
- 31,438$40,000 to $49,999
- 30,656$50,000 to $59,999
- 45,421$60,000 to $74,999
- 58,840$75,000 to $99,999
- 42,501$100,000 to $124,999
- 31,583$125,000 to $149,999
- 47,744$150,000 to $199,999
- 87,077$200,000 or more
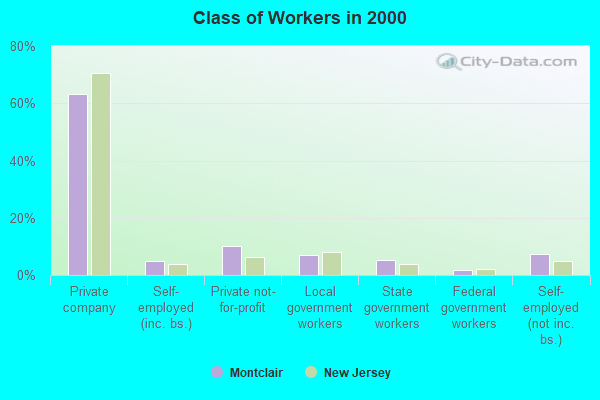
Percentage of workers working in this county: 49.3%
Number of people working at home: 3,801 (15.4% of all workers)
Travel time to work (commute)
- Less than 5 minutes: 525
- 5 to 9 minutes: 1,345
- 10 to 14 minutes: 1,774
- 15 to 19 minutes: 1,964
- 20 to 24 minutes: 2,258
- 25 to 29 minutes: 1,101
- 30 to 34 minutes: 2,538
- 35 to 39 minutes: 553
- 40 to 44 minutes: 744
- 45 to 59 minutes: 1,960
- 60 to 89 minutes: 3,003
- 90 or more minutes: 951
Means of transportation to work:
- Drove a car alone: 11,743 (58.8%)
- Carpooled: 1,514 (7.6%)
- Bus or trolley bus: 2,551 (12.8%)
- Subway or elevated: 67 (0.3%)
- Railroad: 1,724 (8.6%)
- Taxi: 59 (0.3%)
- Motorcycle: 15 (0.1%)
- Bicycle: 24 (0.1%)
- Walked: 816 (4.1%)
- Other means: 203 (1.0%)
- Worked at home: 1,261 (6.3%)
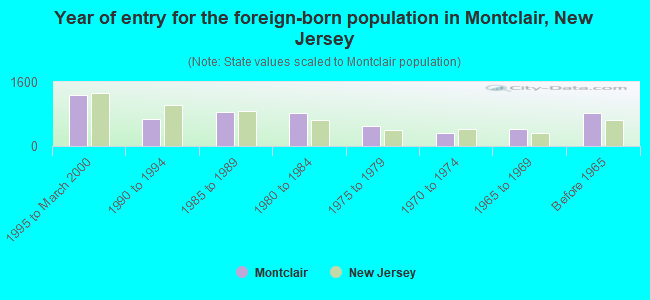
- Year of entry for the foreign-born population in Montclair, New Jersey
- 1,2831995 to March 2000
- 6671990 to 1994
- 8481985 to 1989
- 8161980 to 1984
- 5051975 to 1979
- 3241970 to 1974
- 4191965 to 1969
- 817Before 1965
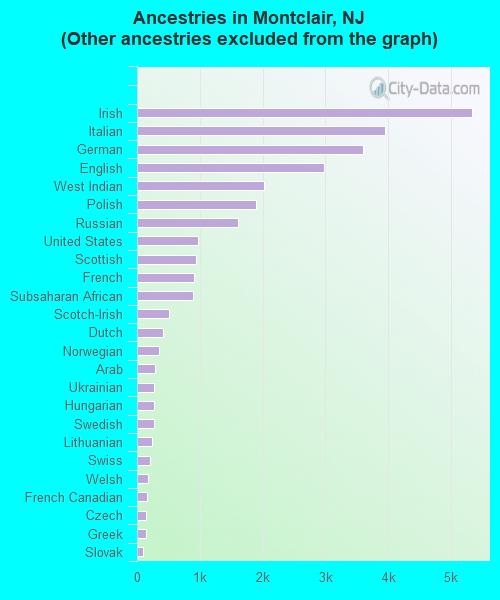
First ancestries reported:
- Other: 15,203 (34.6%)
- Irish: 5,339 (12.1%)
- Italian: 3,948 (9.0%)
- German: 3,604 (8.2%)
- English: 2,975 (6.8%)
- West Indian: 2,015 (4.6%)
- Polish: 1,900 (4.3%)
- Russian: 1,604 (3.6%)
- United States: 967 (2.2%)
- Scottish: 937 (2.1%)
- French: 908 (2.1%)
- Subsaharan African: 899 (2.0%)
- Scotch-Irish: 504 (1.1%)
- Dutch: 413 (0.9%)
- Norwegian: 343 (0.8%)
- Arab: 283 (0.6%)
- Ukrainian: 278 (0.6%)
- Hungarian: 275 (0.6%)
- Swedish: 271 (0.6%)
- Lithuanian: 237 (0.5%)
- Swiss: 206 (0.5%)
- Welsh: 180 (0.4%)
- French Canadian: 165 (0.4%)
- Czech: 139 (0.3%)
- Greek: 137 (0.3%)
- Slovak: 93 (0.2%)
- Danish: 88 (0.2%)
- Portuguese: 52 (0.1%)
Most common places of birth for foreign-born residents (%):
| Montclair: | 12.6% (713) |
| New Jersey: | 2.5% (36,443) |
| Montclair: | 5.4% (304) |
| New Jersey: | 2.2% (31,963) |
| Montclair: | 5.2% (296) |
| New Jersey: | 2.1% (30,355) |
| Montclair: | 4.8% (270) |
| New Jersey: | 2.3% (33,531) |
| Montclair: | 3.9% (224) |
| New Jersey: | 0.9% (13,289) |
| Montclair: | 3.9% (222) |
| New Jersey: | 1.2% (17,746) |
| Montclair: | 3.9% (219) |
| New Jersey: | 1.1% (16,333) |
| Montclair: | 3.5% (201) |
| New Jersey: | 8.1% (119,497) |
| Montclair: | 2.9% (167) |
| New Jersey: | 0.6% (8,389) |
| Montclair: | 2.7% (153) |
| New Jersey: | 6.2% (91,316) |
| Montclair: | 2.7% (152) |
| New Jersey: | 4.7% (69,754) |
| Montclair: | 2.3% (129) |
| New Jersey: | 4.0% (58,395) |
| Montclair: | 2.3% (128) |
| New Jersey: | 0.8% (12,082) |
| Montclair: | 2.1% (122) |
| New Jersey: | 1.4% (20,243) |
| Montclair: | 2.1% (122) |
| New Jersey: | 4.7% (69,773) |
| Montclair: | 1.8% (102) |
| New Jersey: | 2.7% (40,092) |
| Montclair: | 1.8% (100) |
| New Jersey: | 0.5% (6,765) |
| Montclair: | 1.7% (94) |
| New Jersey: | 3.7% (55,241) |
Place of birth for U.S.-born residents:
- This state: 17,746
- Other state: 15,080
- Northeast: 9,379
- Midwest: 1,670
- South: 3,265
- West: 766
59% of Montclair residents lived in the same house 5 years ago.
Out of people who lived in different houses, 53% lived in this county.
Out of people who lived in different counties, 40% lived in New Jersey.
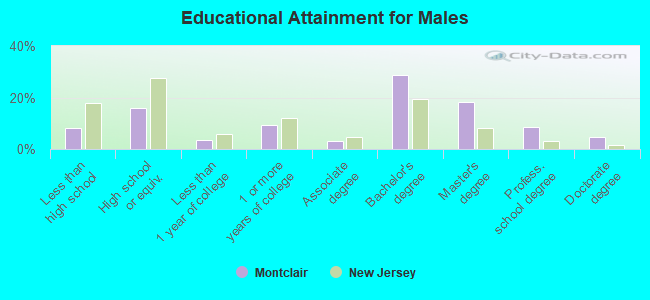
Education attainment for males 25 years and older:
- No schooling: 30
- Nursery to 4th grade: 62
- 5th and 6th grade: 74
- 7th and 8th grade: 144
- 9th grade: 94
- 10th grade: 157
- 11th grade: 168
- 12th grade, no diploma: 254
- High school graduate (or equivalency): 1,880
- Less than 1 year of college: 395
- Some college more than 1 year, no degree: 1,090
- Associate degree: 389
- Bachelor's degree: 3,429
- Master's degree: 2,161
- Professional school degree: 1,020
- Doctorate degree: 543
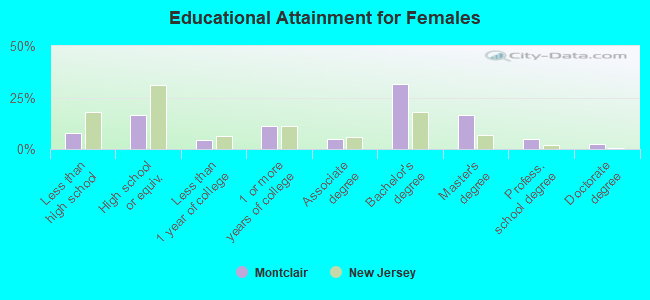
Education attainment for females 25 years and older:
- No schooling: 49
- Nursery to 4th grade: 18
- 5th and 6th grade: 184
- 7th and 8th grade: 238
- 9th grade: 135
- 10th grade: 108
- 11th grade: 69
- 12th grade, no diploma: 343
- High school graduate (or equivalency): 2,413
- Less than 1 year of college: 680
- Some college more than 1 year, no degree: 1,680
- Associate degree: 707
- Bachelor's degree: 4,629
- Master's degree: 2,450
- Professional school degree: 691
- Doctorate degree: 368


Housing units in structures:
- One, detached: 7,358
- One, attached: 298
- Two: 2,082
- 3 or 4: 1,748
- 5 to 9: 1,178
- 10 to 19: 710
- 20 to 49: 959
- 50 or more: 1,269
- Mobile homes: 5
Housing units lacking complete kitchen facilities: 1.2%
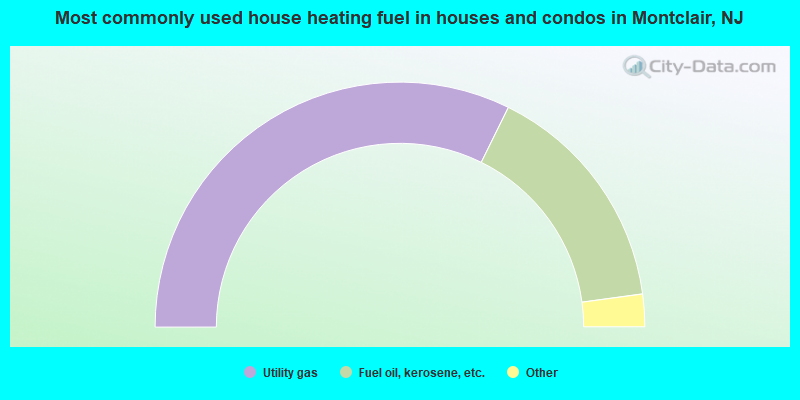
- 64.6%Utility gas
- 31.1%Fuel oil, kerosene, etc.
- 2.7%Electricity
- 1.0%Bottled, tank, or LP gas
- 0.3%Other fuel
- 0.2%No fuel used
- 0.1%Coal or coke
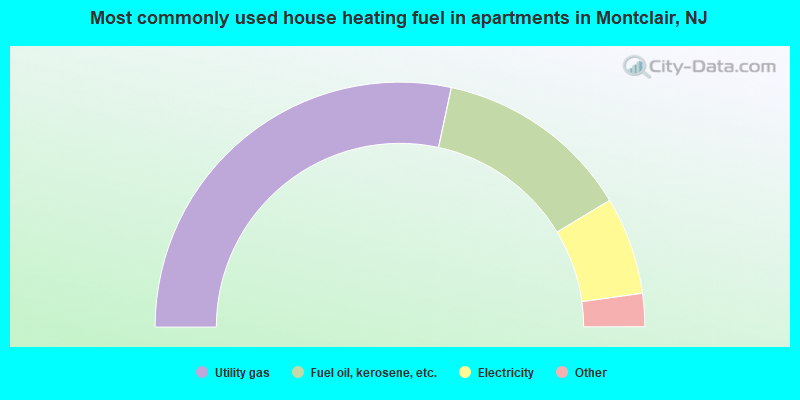
- 56.8%Utility gas
- 26.0%Fuel oil, kerosene, etc.
- 12.9%Electricity
- 2.6%Bottled, tank, or LP gas
- 1.0%Other fuel
- 0.8%No fuel used
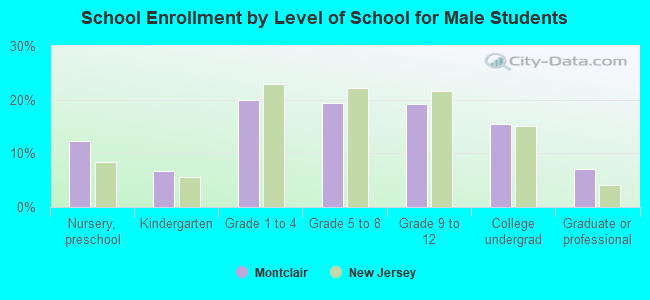
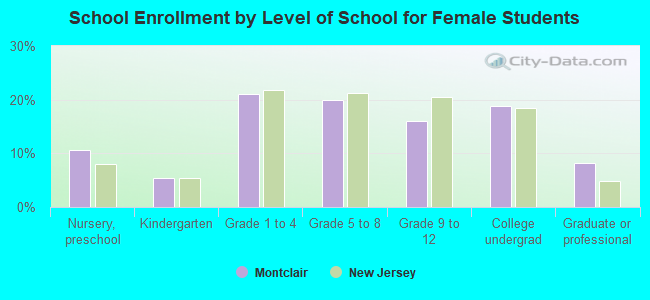
Private vs. public school enrollment:
| Here: | 15.5% |
| New Jersey: | 13.2% |
| Here: | 22.2% |
| New Jersey: | 13.0% |
| Here: | 37.6% |
| New Jersey: | 30.1% |