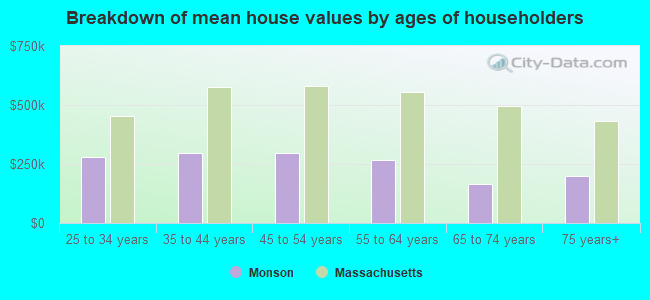
Median price asked for vacant for-sale houses and condos in 2022 in this county: $294,896.
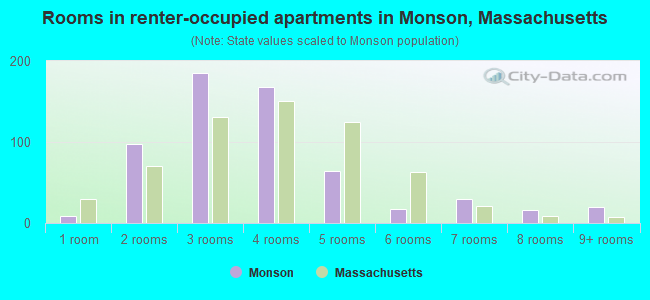
Median contract rent in 2022: $821 (lower quartile is $612, upper quartile is $1,151)
Median rent asked for vacant for-rent units in 2022: $594
Median gross rent in Monson, MA in 2022: $1,006
Housing units in Monson with a mortgage: 1,577 (109 second mortgage, 261 home equity loan, 0 both second mortgage and home equity loan) Houses without a mortgage: 393
In family households: 370,558 (69,901 male householders, 46,060 female householders)
75,335 spouses, 139,777 children (131,178 natural, 3,169 adopted, 5,430 stepchildren), 9,761 grandchildren, 4,611 brothers or sisters, 4,384 parents, foster children, 5,451 other relatives, 12,672 non-relatives
In nonfamily households: 78,141 (28,658 male householders (22,507 living alone)), 35,308 female householders (30,105 living alone)), 14,175 nonrelatives
In group quarters: 14,791 (5,845 institutionalized population)
67,791 married couples with children.
39,215 single-parent households (5,649 men, 33,566 women).
90.9% of residents of Monson speak English at home.
0.8% of residents speak Spanish at home (75% speak English very well, 25% speak English well).
7.6% of residents speak other Indo-European language at home (74% speak English very well, 17% speak English well, 9% speak English not well).
0.5% of residents speak Asian or Pacific Island language at home (25% speak English very well, 75% speak English well).
0.3% of residents speak other language at home (71% speak English very well, 29% speak English well).
Foreign born population: 602 (7.1%)
(63.5% of them are naturalized citizens)
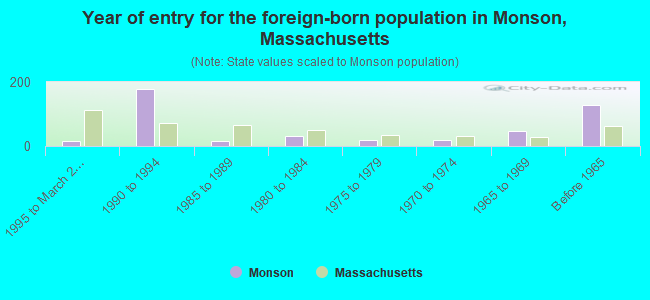
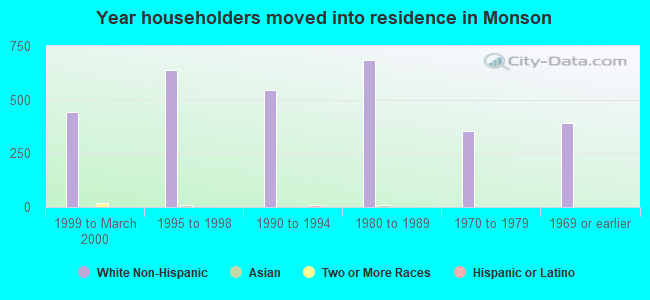
Year of entry for the foreign-born population in Monson, Massachusetts
151995 to March 2000
1781990 to 1994
151985 to 1989
321980 to 1984
201975 to 1979
181970 to 1974
471965 to 1969
129Before 1965
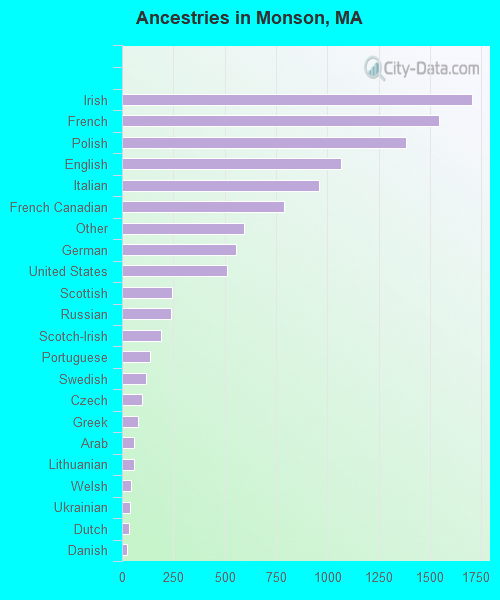
First ancestries reported:
Irish: 1,703 (16.2%)
French: 1,546 (14.7%)
Polish: 1,383 (13.2%)
English: 1,066 (10.2%)
Italian: 962 (9.2%)
French Canadian: 791 (7.5%)
Other: 594 (5.7%)
German: 555 (5.3%)
United States: 513 (4.9%)
Scottish: 242 (2.3%)
Russian: 240 (2.3%)
Scotch-Irish: 190 (1.8%)
Portuguese: 135 (1.3%)
Swedish: 119 (1.1%)
Czech: 99 (0.9%)
Greek: 80 (0.8%)
Arab: 60 (0.6%)
Lithuanian: 59 (0.6%)
Welsh: 44 (0.4%)
Ukrainian: 40 (0.4%)
Dutch: 36 (0.3%)
Danish: 25 (0.2%)
Swiss: 8 (0.08%)
Norwegian: 7 (0.07%)
Subsaharan African: 3 (0.03%)
Most common places of birth for foreign-born residents (%):
Other South Central Asia
Monson:
21.6% (98)
Massachusetts:
0.4% (2,765)
Russia
Monson:
15.0% (68)
Massachusetts:
2.3% (17,449)
United Kingdom
Monson:
9.9% (45)
Massachusetts:
3.3% (25,403)
Poland
Monson:
8.8% (40)
Massachusetts:
1.8% (13,543)
Italy
Monson:
7.7% (35)
Massachusetts:
3.7% (28,319)
Canada
Monson:
6.4% (29)
Massachusetts:
5.2% (40,247)
Germany
Monson:
5.7% (26)
Massachusetts:
1.9% (14,883)
Ireland
Monson:
5.5% (25)
Massachusetts:
2.3% (17,987)
Vietnam
Monson:
3.7% (17)
Massachusetts:
3.9% (30,457)
Netherlands
Monson:
2.4% (11)
Massachusetts:
0.3% (2,470)
Philippines
Monson:
2.2% (10)
Massachusetts:
1.0% (7,414)
Israel
Monson:
2.2% (10)
Massachusetts:
0.4% (3,319)
Japan
Monson:
2.0% (9)
Massachusetts:
1.1% (8,682)
Other Northern Europe
Monson:
1.8% (8)
Massachusetts:
0.4% (3,051)
Other Western Europe
Monson:
1.8% (8)
Massachusetts:
0.3% (2,642)
Ukraine
Monson:
1.8% (8)
Massachusetts:
1.1% (8,754)
Korea
Monson:
1.5% (7)
Massachusetts:
1.7% (13,456)
Place of birth for U.S.-born residents:
This state: 6,470
Other state: 1,372
Northeast: 1,067
Midwest: 105
South: 100
West: 100
68% of Monson residents lived in the same house 5 years ago. Out of people who lived in different houses, 76% lived in this county. Out of people who lived in different counties, 70% lived in Massachusetts.
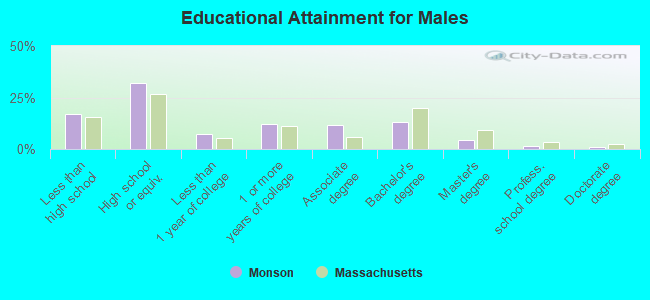
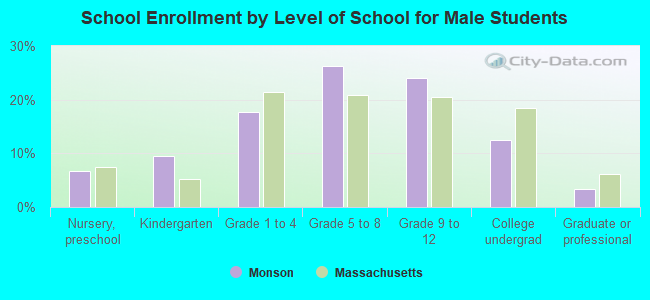
Education attainment for males 25 years and older:
No schooling: 94
Nursery to 4th grade: 0
5th and 6th grade: 15
7th and 8th grade: 52
9th grade: 94
10th grade: 94
11th grade: 24
12th grade, no diploma: 90
High school graduate (or equivalency): 881
Less than 1 year of college: 207
Some college more than 1 year, no degree: 339
Associate degree: 319
Bachelor's degree: 365
Master's degree: 125
Professional school degree: 37
Doctorate degree: 26
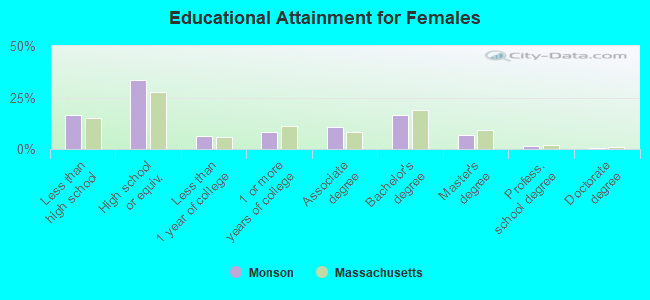
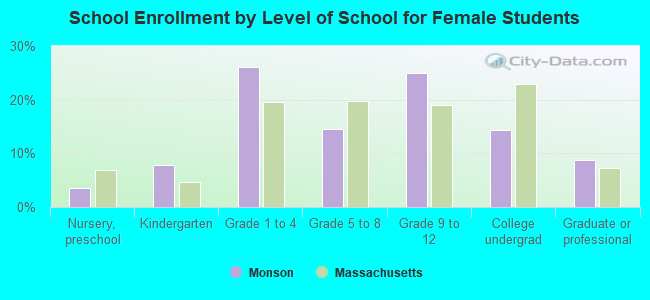
Education attainment for females 25 years and older:
No schooling: 103
Nursery to 4th grade: 14
5th and 6th grade: 0
7th and 8th grade: 59
9th grade: 73
10th grade: 66
11th grade: 28
12th grade, no diploma: 144
High school graduate (or equivalency): 980
Less than 1 year of college: 185
Some college more than 1 year, no degree: 236
Associate degree: 313
Bachelor's degree: 483
Master's degree: 196
Professional school degree: 36
Doctorate degree: 11
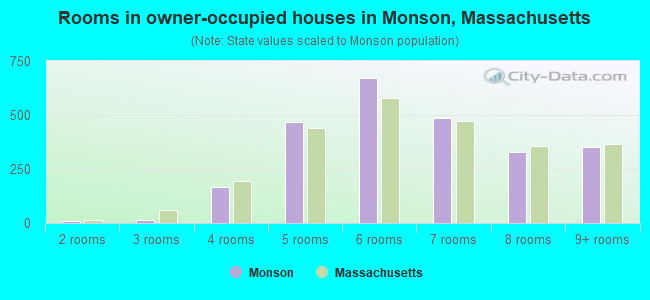
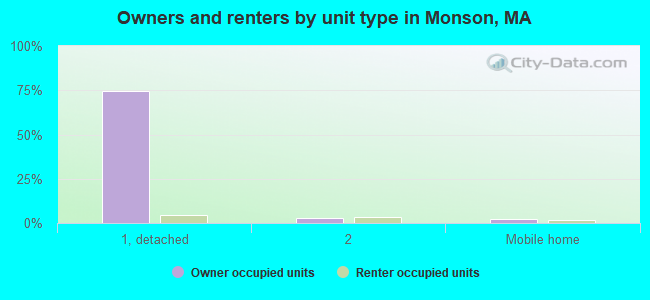
Housing units in structures:
One, detached: 2,530
One, attached: 16
Two: 188
3 or 4: 193
5 to 9: 93
10 to 19: 26
20 to 49: 20
50 or more: 10
Mobile homes: 137
Median worth of mobile homes: $68,023
Housing units lacking complete plumbing facilities: 0.3%