Mishawaka, IN (Indiana) Houses and Residents
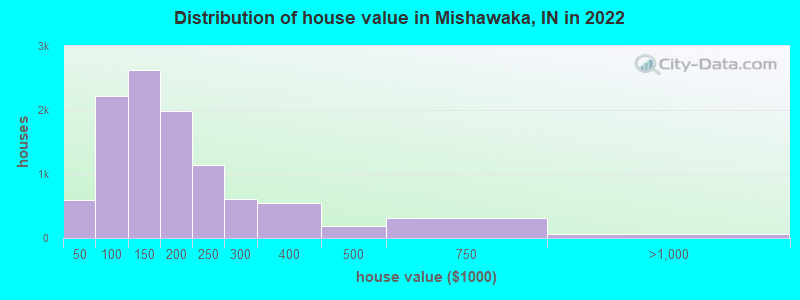
Estimated median house or condo value in 2022: $144,989 (it was $74,100 in 2000 )
Mishawaka:
$144,989Indiana:
$208,700
Lower value quartile - upper value quartile: $107,235 - $216,960Mean price in 2022: Detached houses: $173,393 Here:
$173,393State:
$257,916
Townhouses or other attached units: $142,666 Here:
$142,666State:
$224,114
In 3-to-4-unit structures: $50,511 Here:
$50,511State:
$151,116
In 5-or-more-unit structures: $93,865 Here:
$93,865State:
$200,844
Mobile homes: $27,513 Here:
$27,513State:
$67,116
Total population: 48,174 (Urban population: 46,778, Rural population: 18 (all nonfarm) )
Houses: 25,506 (23,274 occupied: 11,022 owner occupied, 11,768 renter occupied )
% of renters here:
52%State:
29%
Housing density: 1,623 houses/condos per square mile
Median price asked for vacant for-sale houses and condos in 2022: $57,499.
Median contract rent in 2022: $883 (lower quartile is $716, upper quartile is $1,065)
Median rent asked for vacant for-rent units in 2022: $1,002
Median gross rent in Mishawaka, IN in 2022: $989
Housing units in Mishawaka with a mortgage: 6,950 (873 second mortgage, 38 home equity loan, 835 both second mortgage and home equity loan )Houses without a mortgage: 255
Median household income for houses/condos with a mortgage: $85,204
Median household income for apartments without a mortgage: $44,250
Median monthly housing costs: $960
Data:
Median house or condo value ($)
Median house or condo value ($ change since 2000)
Median house or condo value ($) - White
Median house or condo value ($) - Black or African American
Median house or condo value ($) - Asian
Median house or condo value ($) - Hispanic or Latino
Median house or condo value ($) - American Indian and Alaska Native
Median house or condo value ($) - Multirace
Median house or condo value ($) - Other Race
Median price asked for mobile homes ($)
Household density (households per square mile)
Mean house or condo value by units in structure - 1, detached ($)
Mean house or condo value by units in structure - 1, attached ($)
Mean house or condo value by units in structure - 2 ($)
Mean house or condo value by units in structure by units in structure - 3 or 4 ($)
Mean house or condo value by units in structure - 5 or more ($)
Mean house or condo value by units in structure - Boat, RV, van, etc. ($)
Mean house or condo value by units in structure - Mobile home ($)
Median contract rent ($)
Median contract rent - Lower quartile ($)
Median contract rent - Upper quartile ($)
Median gross rent ($)
Urban houses (%)
Rural houses (%)
Houses occupied (%)
Houses occupied (% change since 2000)
Houses owner occupied (%)
Houses owner occupied (% change since 2000)
Houses renter occupied (%)
Houses renter occupied (% change since 2000)
Vacant housing units - For rent (%)
Vacant housing units - For rent (% change since 2000)
Vacant housing units - For sale only (%)
Vacant housing units - For sale only (% change since 2000)
Vacant housing units - Rented or sold, not occupied (%)
Vacant housing units - Rented or sold, not occupied (% change since 2000)
Vacant housing units - For seasonal, recreational, or occasional use (%)
Vacant housing units - For seasonal, recreational, or occasional use (% change since 2000)
Vacant housing units - For migrant workers (%)
Vacant housing units - For migrant workers (% change since 2000)
Vacant housing units - Other vacant (%)
Vacant housing units - Other vacant (% change since 2000)
Median monthly housing costs ($)
Median household income for houses/condos with a mortgage ($)
Median household income for houses/condos without a mortgage ($)
Median household income ($)
Median household income ($) - White
Median household income ($) - Black or African American
Median household income ($) - Asian
Median household income ($) - Hispanic or Latino
Median household income ($) - American Indian and Alaska Native
Median household income ($) - Multirace
Median household income ($) - Other Race
Mortgage status - with mortgage (%)
Mortgage status - with second mortgage (%)
Mortgage status - with home equity loan (%)
Mortgage status - with both second mortgage and home equity loan (%)
Mortgage status - without a mortgage (%)
Median year house/condo built
Median year apartment built
Household type by relationship - Male householder living alone (%)
Household type by relationship - Male householder not living alone (%)
Household type by relationship - Female householder living alone (%)
Household type by relationship - Female householder not living alone (%)
Household type by relationship - Opposite-Sex spouse (%)
Household type by relationship - Same-Sex spouse (%)
Household type by relationship - Opposite-Sex unmarried partner (%)
Household type by relationship - Same-Sex unmarried partner (%)
Household type by relationship - In group quarters (%)
Size of family households - 2-person household (%)
Size of family households - 3-person household (%)
Size of family households - 4-person household (%)
Size of family households - 5-person household (%)
Size of family households - 6-person household (%)
Size of family households - 7-or-more-person household (%)
Size of nonfamily households - 1-person household (%)
Size of nonfamily households - 2-person household (%)
Size of nonfamily households - 3-person household (%)
Size of nonfamily households - 4-person household (%)
Size of nonfamily households - 5-person household (%)
Size of nonfamily households - 6-person household (%)
Size of nonfamily households - 7-or-moreperson household (%)
Year house built - Built 2010 or later (%)
Year house built - Built 2000 to 2009 (%)
Year house built - Built 1990 to 1999 (%)
Year house built - Built 1980 to 1989 (%)
Year house built - Built 1970 to 1979 (%)
Year house built - Built 1960 to 1969 (%)
Year house built - Built 1950 to 1959 (%)
Year house built - Built 1940 to 1949 (%)
Year house built - Built 1939 or earlier (%)
Median number of rooms in houses and condos
Median number of rooms in apartments
Median number of bedrooms in owner occupied houses
Mean number of bedrooms in owner occupied houses
Median number of bedrooms in renter occupied houses
Mean number of bedrooms in renter occupied houses
Median number of vehichles in owner occupied houses
Mean number of vehichles in owner occupied houses
Median number of vehichles in renter occupied houses
Mean number of vehichles in renter occupied houses
Rooms in owner-occupied houses - 1 room (%)
Rooms in owner-occupied houses - 2 rooms (%)
Rooms in owner-occupied houses - 3 rooms (%)
Rooms in owner-occupied houses - 4 rooms (%)
Rooms in owner-occupied houses - 5 rooms (%)
Rooms in owner-occupied houses - 6 rooms (%)
Rooms in owner-occupied houses - 7 rooms (%)
Rooms in owner-occupied houses - 8 rooms (%)
Rooms in owner-occupied houses - 9+ rooms (%)
Rooms in renter-occupied houses - 1 room (%)
Rooms in renter-occupied houses - 2 rooms (%)
Rooms in renter-occupied houses - 3 rooms (%)
Rooms in renter-occupied houses - 4 rooms (%)
Rooms in renter-occupied houses - 5 rooms (%)
Rooms in renter-occupied houses - 6 rooms (%)
Rooms in renter-occupied houses - 7 rooms (%)
Rooms in renter-occupied houses - 8 rooms (%)
Rooms in renter-occupied houses - 9+ rooms (%)
Bedrooms in owner-occupied houses - no bedrooms (%)
Bedrooms in owner-occupied houses - 1 bedroom (%)
Bedrooms in owner-occupied houses - 2 bedrooms (%)
Bedrooms in owner-occupied houses - 3 bedrooms (%)
Bedrooms in owner-occupied houses - 4 bedrooms (%)
Bedrooms in owner-occupied houses - 5+ bedrooms (%)
Bedrooms in renter-occupied houses - no bedrooms (%)
Bedrooms in renter-occupied houses - 1 bedroom (%)
Bedrooms in renter-occupied houses - 2 bedrooms (%)
Bedrooms in renter-occupied houses - 3 bedrooms (%)
Bedrooms in renter-occupied houses - 4 bedrooms (%)
Bedrooms in renter-occupied houses - 5+ bedrooms (%)
Vehicles available in owner-occupied houses - no vehicle available (%)
Vehicles available in owner-occupied houses - 1 vehicle available(%)
Vehicles available in owner-occupied houses - 2 Vehicles available (%)
Vehicles available in owner-occupied houses - 3 Vehicles available (%)
Vehicles available in owner-occupied houses - 4 Vehicles available (%)
Vehicles available in owner-occupied houses - 5+ Vehicles available (%)
Vehicles available in renter-occupied houses - no vehicle available (%)
Vehicles available in renter-occupied houses - 1 vehicle available (%)
Vehicles available in renter-occupied houses - 2 Vehicles available (%)
Vehicles available in renter-occupied houses - 3 Vehicles available (%)
Vehicles available in renter-occupied houses - 4 Vehicles available (%)
Vehicles available in renter-occupied houses - 5+ Vehicles available (%)
Housing units in structures - 1, detached (%)
Housing units in structures - 1, attached (%)
Housing units in structures - 2 (%)
Housing units in structures - 3 or 4 (%)
Housing units in structures - 5 to 9 (%)
Housing units in structures - 10 to 19 (%)
Housing units in structures - 20 to 49 (%)
Housing units in structures - 50 or more (%)
Housing units in structures - Mobile home (%)
Housing units in structures - Boat, RV, van, etc. (%)
Housing units in structures - Owners - 1, detached (%)
Housing units in structures - Owners - 1, attached (%)
Housing units in structures - Owners - 2 (%)
Housing units in structures - Owners - 3 or 4 (%)
Housing units in structures - Owners - 5 to 9 (%)
Housing units in structures - Owners - 10 to 19 (%)
Housing units in structures - Owners - 20 to 49 (%)
Housing units in structures - Owners - 50 or more (%)
Housing units in structures - Owners - Mobile home (%)
Housing units in structures - Owners - Boat, RV, van, etc. (%)
Housing units in structures - Renters - 1, detached (%)
Housing units in structures - Renters - 1, attached (%)
Housing units in structures - Renters - 2 (%)
Housing units in structures - Renters - 3 or 4 (%)
Housing units in structures - Renters - 5 to 9 (%)
Housing units in structures - Renters - 10 to 19 (%)
Housing units in structures - Renters - 20 to 49 (%)
Housing units in structures - Renters - 50 or more (%)
Housing units in structures - Renters - Mobile home (%)
Housing units in structures - Renters - Boat, RV, van, etc. (%)
House/condo owner moved in on average (years ago)
Renter moved in on average (years ago)
Year householder moved into unit - Moved in 1999 to March 2000 (%)
Year householder moved into unit - Moved in 1999 to March 2000 (%) - White
Year householder moved into unit - Moved in 1999 to March 2000 (%) - Black or African American
Year householder moved into unit - Moved in 1999 to March 2000 (%) - Asian
Year householder moved into unit - Moved in 1999 to March 2000 (%) - Hispanic or Latino
Year householder moved into unit - Moved in 1999 to March 2000 (%) - American Indian and Alaska Native
Year householder moved into unit - Moved in 1999 to March 2000 (%) - Multirace
Year householder moved into unit - Moved in 1999 to March 2000 (%) - Other Race
Year householder moved into unit - Moved in 1995 to 1998 (%)
Year householder moved into unit - Moved in 1995 to 1998 (%) - White
Year householder moved into unit - Moved in 1995 to 1998 (%) - Black or African American
Year householder moved into unit - Moved in 1995 to 1998 (%) - Asian
Year householder moved into unit - Moved in 1995 to 1998 (%) - Hispanic or Latino
Year householder moved into unit - Moved in 1995 to 1998 (%) - American Indian and Alaska Native
Year householder moved into unit - Moved in 1995 to 1998 (%) - Multirace
Year householder moved into unit - Moved in 1995 to 1998 (%) - Other Race
Year householder moved into unit - Moved in 1990 to 1994 (%)
Year householder moved into unit - Moved in 1990 to 1994 (%) - White
Year householder moved into unit - Moved in 1990 to 1994 (%) - Black or African American
Year householder moved into unit - Moved in 1990 to 1994 (%) - Asian
Year householder moved into unit - Moved in 1990 to 1994 (%) - Hispanic or Latino
Year householder moved into unit - Moved in 1990 to 1994 (%) - American Indian and Alaska Native
Year householder moved into unit - Moved in 1990 to 1994 (%) - Multirace
Year householder moved into unit - Moved in 1990 to 1994 (%) - Other Race
Year householder moved into unit - Moved in 1980 to 1989 (%)
Year householder moved into unit - Moved in 1980 to 1989 (%) - White
Year householder moved into unit - Moved in 1980 to 1989 (%) - Black or African American
Year householder moved into unit - Moved in 1980 to 1989 (%) - Asian
Year householder moved into unit - Moved in 1980 to 1989 (%) - Hispanic or Latino
Year householder moved into unit - Moved in 1980 to 1989 (%) - American Indian and Alaska Native
Year householder moved into unit - Moved in 1980 to 1989 (%) - Multirace
Year householder moved into unit - Moved in 1980 to 1989 (%) - Other Race
Year householder moved into unit - Moved in 1970 to 1979 (%)
Year householder moved into unit - Moved in 1970 to 1979 (%) - White
Year householder moved into unit - Moved in 1970 to 1979 (%) - Black or African American
Year householder moved into unit - Moved in 1970 to 1979 (%) - Asian
Year householder moved into unit - Moved in 1970 to 1979 (%) - Hispanic or Latino
Year householder moved into unit - Moved in 1970 to 1979 (%) - American Indian and Alaska Native
Year householder moved into unit - Moved in 1970 to 1979 (%) - Multirace
Year householder moved into unit - Moved in 1970 to 1979 (%) - Other Race
Year householder moved into unit - Moved in 1969 or earlier (%)
Year householder moved into unit - Moved in 1969 or earlier (%) - White
Year householder moved into unit - Moved in 1969 or earlier (%) - Black or African American
Year householder moved into unit - Moved in 1969 or earlier (%) - Asian
Year householder moved into unit - Moved in 1969 or earlier (%) - Hispanic or Latino
Year householder moved into unit - Moved in 1969 or earlier (%) - American Indian and Alaska Native
Year householder moved into unit - Moved in 1969 or earlier (%) - Multirace
Year householder moved into unit - Moved in 1969 or earlier (%) - Other Race
Housing units lacking complete plumbing facilities (%)
Housing units lacking complete kitchen facilities (%)
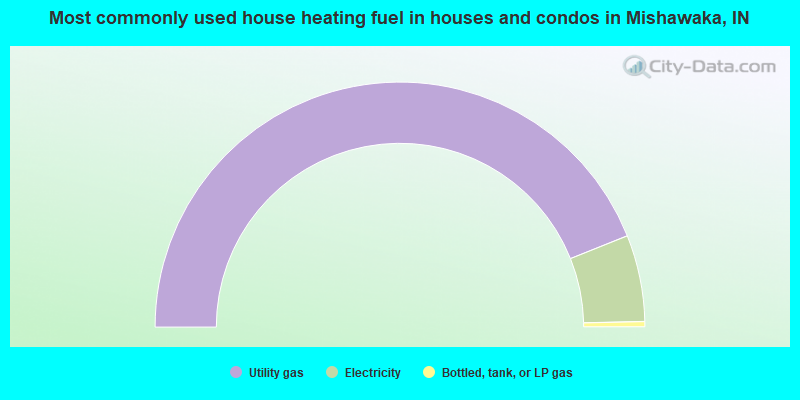
House heating fuel used in houses and condos - Utility gas (%)
House heating fuel used in houses and condos - Bottled, tank, or LP gas (%)
House heating fuel used in houses and condos - Electricity (%)
House heating fuel used in houses and condos - Fuel oil, kerosene, etc. (%)
House heating fuel used in houses and condos - Coal or coke (%)
House heating fuel used in houses and condos - Wood (%)
House heating fuel used in houses and condos - Solar energy (%)
House heating fuel used in houses and condos - Other fuel (%)
House heating fuel used in houses and condos - No fuel used (%)
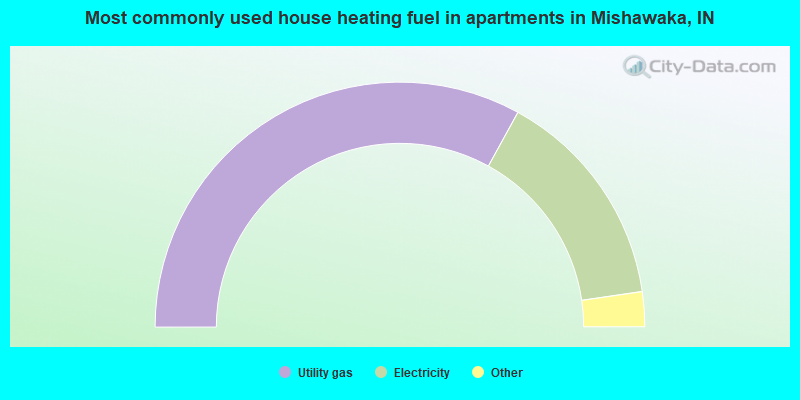
House heating fuel used in apartments - Utility gas (%)
House heating fuel used in apartments - Bottled, tank, or LP gas (%)
House heating fuel used in apartments - Electricity (%)
House heating fuel used in apartments - Fuel oil, kerosene, etc. (%)
House heating fuel used in apartments - Coal or coke (%)
House heating fuel used in apartments - Wood (%)
House heating fuel used in apartments - Solar energy (%)
House heating fuel used in apartments - Other fuel (%)
House heating fuel used in apartments - No fuel used (%)
Latest news about housing in Mishawaka, IN collected exclusively by city-data.com from local newspapers, TV, and radio stations
Median year house/condo built: 1967Median year apartment built: 1982Household type by relationship:
Households: 50,870
Male householders: 11,405 (5,120 living alone ), Female householders: 11,772 (5,276 living alone )7,500 spouses (7,432 opposite-sex spouses ), 1,642 unmarried partners , (1,599 opposite-sex unmarried partners ), 12,847 children (11,667 natural , 694 adopted , 485 stepchildren ), 1,484 grandchildren , 256 brothers or sisters , 491 parents , 147 foster children , 493 other relatives , 1,801 non-relatives In group quarters: 1,025
Size of family households: 5,344 2-persons , 2,425 3-persons , 2,142 4-persons , 946 5-persons , 252 6-persons , 196 7-or-more-persons .
Size of nonfamily households: 10,010 1-person , 1,321 2-persons , 106 3-persons , 37 4-persons , 31 5-persons , 11 6-persons .
5,035 married couples with children. single-parent households (869 men , 2,415 women ).
91.3% of residents of Mishawaka speak English at home. of residents speak Spanish at home (61% speak English very well , 25% speak English well , 9% speak English not well , 6% don't speak English at all ).of residents speak other Indo-European language at home (67% speak English very well , 33% speak English well ).of residents speak Asian or Pacific Island language at home (40% speak English very well , 46% speak English well , 15% speak English not well ).of residents speak other language at home (68% speak English very well , 16% speak English well , 9% speak English not well , 7% don't speak English at all ).
Foreign born population: 3,393 (6.7%)of them are naturalized citizens )
Median number of rooms in houses and condos:
Median number of rooms in apartments
Owner-occupied Renter-occupied
Rooms in owner-occupied houses in Mishawaka, Indiana
0 1 room 0 2 rooms 231 3 rooms 1,418 4 rooms 2,240 5 rooms 1,971 6 rooms 1,862 7 rooms 1,364 8 rooms 1,936 9+ rooms
Rooms in renter-occupied apartments in Mishawaka, Indiana
393 1 room 934 2 rooms 2,732 3 rooms 3,489 4 rooms 1,911 5 rooms 789 6 rooms 947 7 rooms 390 8 rooms 184 9+ rooms
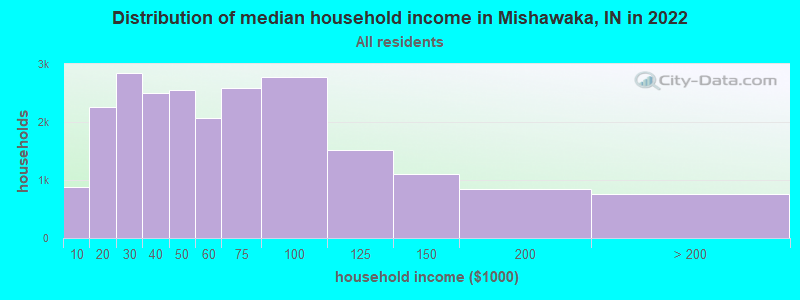
Mishawaka, IN household income distribution 876 Less than $10,0002,259 $10,000 to $19,9992,847 $20,000 to $29,9992,497 $30,000 to $39,9992,546 $40,000 to $49,9992,072 $50,000 to $59,9992,585 $60,000 to $74,9992,782 $75,000 to $99,9991,514 $100,000 to $124,9991,099 $125,000 to $149,999841 $150,000 to $199,999753 $200,000 or more
Home value of owner - occupied houses in 2022 in Mishawaka, IN 263 Less than $10,000130 $10,000 to $14,99952 $15,000 to $19,99938 $20,000 to $24,99922 $30,000 to $34,99922 $35,000 to $39,99967 $40,000 to $49,999188 $50,000 to $59,999120 $60,000 to $69,999564 $70,000 to $79,999538 $80,000 to $89,999742 $90,000 to $99,9991,655 $100,000 to $124,999963 $125,000 to $149,9991,099 $150,000 to $174,999885 $175,000 to $199,9991,136 $200,000 to $249,999615 $250,000 to $299,999545 $300,000 to $399,999190 $400,000 to $499,999315 $500,000 to $749,99958 $750,000 to $999,9992 $1,000,000 to $1,499,999Rent paid by renters in 2022 in Mishawaka, IN 18 Less than $10013 $100 to $149140 $200 to $24966 $250 to $299306 $300 to $34969 $350 to $399868 $400 to $449288 $450 to $499273 $500 to $549353 $550 to $599229 $600 to $649475 $650 to $6991,063 $700 to $749817 $750 to $7991,823 $800 to $8992,073 $900 to $9992,243 $1,000 to $1,249456 $1,250 to $1,499588 $1,500 to $1,999341 $2,000 to $2,49932 $2,500 to $2,99932 $3,500 or more329 No cash rent
Percentage of workers working in this county: 76.9%Number of people working at home: 1,762 (6.9% of all workers )
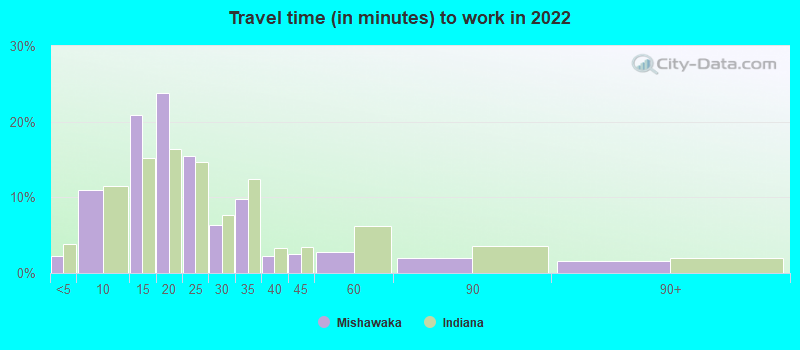
Travel time to work (commute)
Less than 5 minutes: 3235 to 9 minutes: 2,26310 to 14 minutes: 4,19515 to 19 minutes: 5,21920 to 24 minutes: 5,00925 to 29 minutes: 1,25530 to 34 minutes: 3,21335 to 39 minutes: 59540 to 44 minutes: 26445 to 59 minutes: 76760 to 89 minutes: 37390 or more minutes: 384
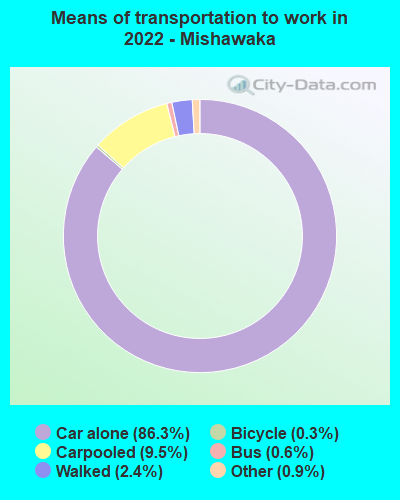
Means of transportation to work:
Drove a car alone: 23,158 (78.0%)Carpooled: 3,395 (11.4%)Bus : 207 (0.7%)Taxi: 243 (0.8%)Bicycle: 89 (0.3%)Walked: 646 (2.2%)Worked at home: 1,762 (5.9%)
Unemployment by race in 2022
Unemployment rate for White non-Hispanic residents 4.1% Males2.7% FemalesUnemployment rate for Black residents 35.9% Males9.0% FemalesUnemployment rate for Asian residents 11.1% FemalesUnemployment rate for other race residents 7.9% MalesUnemployment rate for two or more race residents 8.9% Males2.1% FemalesUnemployment rate for Hispanic or Latino residents 9.4% Males
Year of entry for the foreign-born population in Mishawaka, Indiana
1,954 2010 or later 344 2000 to 2009 540 1990 to 1999 436 1980 to 1989 152 1970 to 1979 339 Before 1970
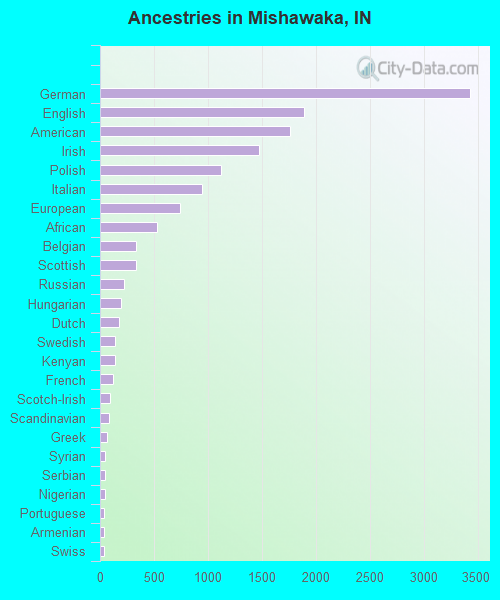
First ancestries reported:
German: 3,431 (16.0%)
English: 1,885 (8.8%)
American: 1,762 (8.2%)
Irish: 1,473 (6.9%)
Polish: 1,122 (5.2%)
Italian: 946 (4.4%)
European: 744 (3.5%)
African: 529 (2.5%)
Belgian: 337 (1.6%)
Scottish: 329 (1.5%)
Russian: 219 (1.0%)
Hungarian: 191 (0.9%)
Dutch: 180 (0.8%)
Swedish: 137 (0.6%)
Kenyan: 136 (0.6%)
French: 120 (0.6%)
Scotch-Irish: 97 (0.5%)
Scandinavian: 81 (0.4%)
Greek: 67 (0.3%)
Syrian: 49 (0.2%)
Serbian: 46 (0.2%)
Nigerian: 42 (0.2%)
Portuguese: 37 (0.2%)
Armenian: 36 (0.2%)
Swiss: 36 (0.2%)
Romanian: 35 (0.2%)
Norwegian: 34 (0.2%)
Ghanaian: 34 (0.2%)
Eastern European: 34 (0.2%)
British: 32 (0.1%)
Finnish: 28 (0.1%)
Jordanian: 27 (0.1%)
Brazilian: 26 (0.1%)
Northern European: 22 (0.1%)
Lebanese: 22 (0.1%)
Ukrainian: 22 (0.1%)
Pennsylvania German: 20 (0.09%)
Jamaican: 20 (0.09%)
Yugoslavian: 20 (0.09%)
Canadian: 18 (0.08%)
Welsh: 16 (0.07%)
Bulgarian: 16 (0.07%)
Austrian: 16 (0.07%)
Lithuanian: 15 (0.07%)
Macedonian: 15 (0.07%)
Czech: 13 (0.06%)
Turkish: 12 (0.06%)
French Canadian: 8 (0.04%)
Egyptian: 5 (0.02%)
Most common places of birth for foreign-born residents (%): Other Eastern Africa Mishawaka:
13.1% (419)Indiana:
0.4% (1,469)
Venezuela Mishawaka:
10.0% (319)Indiana:
1.8% (6,718)
China, excluding Hong Kong and Taiwan Mishawaka:
9.5% (303)Indiana:
5.3% (19,877)
India Mishawaka:
7.2% (231)Indiana:
8.5% (32,127)
Mexico Mishawaka:
4.4% (140)Indiana:
27.0% (101,996)
Vietnam Mishawaka:
4.0% (129)Indiana:
1.8% (6,645)
Canada Mishawaka:
3.8% (122)Indiana:
2.1% (7,834)
Kenya Mishawaka:
3.6% (114)Indiana:
0.8% (2,987)
Democratic Republic of Congo (Zaire) Mishawaka:
3.3% (105)Indiana:
0.3% (1,221)
Burma (Myanmar) Mishawaka:
2.8% (90)Indiana:
4.3% (16,289)
Philippines Mishawaka:
2.7% (88)Indiana:
3.1% (11,851)
Pakistan Mishawaka:
2.3% (74)Indiana:
0.9% (3,221)
Ecuador Mishawaka:
2.1% (66)Indiana:
0.2% (835)
Africa, n.e.c. Mishawaka:
1.7% (53)Indiana:
0.4% (1,465)
Poland Mishawaka:
1.5% (49)Indiana:
0.8% (2,959)
Place of birth for U.S.-born residents:
This state: 32,415Other state: 14,234Northeast: 1,361Midwest: 7,234South: 3,212West: 2,493 82.8% of Mishawaka residents lived in the same house 1 years ago.
Out of people who lived in different houses, 38.4% lived in this county.
Out of people who lived in different counties, 43.7% lived in Indiana.
Mishawaka:
82.8%State average:
87.1%
Education attainment for males 25 years and older:
No schooling: 116Nursery to 4th grade: 105th and 6th grade: 657th and 8th grade: 2739th grade: 21410th grade: 45811th grade: 31612th grade, no diploma: 484High school graduate (or equivalency): 5,626Less than 1 year of college: 1,423Some college more than 1 year, no degree: 2,223Associate degree: 1,040Bachelor's degree: 2,892Master's degree: 1,204Professional school degree: 244Doctorate degree: 361
Education attainment for females 25 years and older:
No schooling: 134Nursery to 4th grade: 155th and 6th grade: 47th and 8th grade: 809th grade: 27510th grade: 39311th grade: 24212th grade, no diploma: 431High school graduate (or equivalency): 5,478Less than 1 year of college: 1,572Some college more than 1 year, no degree: 2,534Associate degree: 1,858Bachelor's degree: 2,970Master's degree: 1,189Professional school degree: 304Doctorate degree: 186
Housing units in structures:
One, detached: 12,746One, attached: 1,475Two: 5263 or 4: 1,6325 to 9: 2,89910 to 19: 2,10720 to 49: 1,62550 or more: 1,562Mobile homes: 910Boats, RVs, vans, etc.: 19Median worth of mobile homes: $11,413
Housing units lacking complete plumbing facilities in 2022: 0.6%Housing units lacking complete kitchen facilities in 2022: 1.2%House/condo owner moved in on average 13 years ago
Renter moved in on average 2 years ago
Private vs. public school enrollment:
Students in private schools in grades 1 to 8 (elementary and middle school): 1,054 Students in private schools in grades 9 to 12 (high school): 221 Students in private undergraduate colleges: 937