Milford, CT (Connecticut) Houses and Residents
| Milford: | $388,173 |
| Connecticut: | $347,200 |
Mean price in 2022:
Detached houses: $462,685
Here: $462,685 State: $503,946 Townhouses or other attached units: $297,840
Here: $297,840 State: $304,959 In 2-unit structures: $841,528
Here: $841,528 State: $304,133 In 3-to-4-unit structures: $254,376
Here: $254,376 State: $272,970 In 5-or-more-unit structures: $262,054
Here: $262,054 State: $249,308 Mobile homes: $142,731
Here: $142,731 State: $151,361
Total population: 51,857 (Urban population: 50,602, Rural population: 0)
Houses: 23,103 (21,275 occupied: 16,495 owner occupied, 5,014 renter occupied)
| % of renters here: | 23% |
| State: | 34% |
Housing density: 1,037 houses/condos per square mile
Median price asked for vacant for-sale houses and condos in 2022: $162,970.
Median contract rent in 2022: $1,628 (lower quartile is $1,240, upper quartile is $1,947)
Median rent asked for vacant for-rent units in 2022: $1,582
Median gross rent in Milford, CT in 2022: $1,764
Housing units in Milford with a mortgage: 10,527 (1,098 second mortgage, 9 home equity loan, 1,077 both second mortgage and home equity loan)
Houses without a mortgage: 499
Median household income for houses/condos with a mortgage: $137,196
Median household income for apartments without a mortgage: $85,311
Median monthly housing costs: $1,808
Compare current foreclosures near Milford, CT:
| Photo | Address | Area | Beds / Baths | Price | Details |
|---|---|---|---|---|---|

|
#1
Davis Dr
Milford, CT 06460
|
1,165 sq. feet
|
1 baths 4 beds |
$454,900
|
show details |

|
#2
Riverdale Rd
Milford, CT 06460
|
912 sq. feet
|
1 baths 3 beds |
show details | |

|
#3
Richard St
Milford, CT 06460
|
2,162 sq. feet
|
2 baths 3 beds |
show details | |

|
#4
Gresham St
Milford, CT 06461
|
1,008 sq. feet
|
1 baths 3 beds |
show details | |

|
#5
Hoyt St
Milford, CT 06460
|
1,568 sq. feet
|
2 baths 3 beds |
show details | |

|
#6
Woodruff Rd
Milford, CT 06461
|
1,686 sq. feet
|
2 baths 3 beds |
show details | |

|
#7
New Haven Ave
Milford, CT 06460
|
1,521 sq. feet
|
2 baths 3 beds |
show details | |

|
#8
Overton Ave
Milford, CT 06460
|
1,325 sq. feet
|
1 baths 4 beds |
show details | |

|
#9
Darina Pl
Milford, CT 06460
|
1,466 sq. feet
|
1 baths 3 beds |
show details | |

|
#10
Harmony Ln
Milford, CT 06460
|
728 sq. feet
|
1 baths 2 beds |
show details |
| Photo | Address | Area | Beds / Baths | Price | Details |
|---|---|---|---|---|---|

|
#11
Lenox Ave
Milford, CT 06460
|
1,248 sq. feet
|
2 baths 4 beds |
show details | |

|
#12
Wildflower Dr
Milford, CT 06460
|
2,325 sq. feet
|
2 baths 3 beds |
show details | |

|
#13
Lenox Ave
Milford, CT 06460
|
1,645 sq. feet
|
2 baths 3 beds |
show details | |

|
#14
Gulf St
Milford, CT 06460
|
1,290 sq. feet
|
2 baths 4 beds |
show details | |

|
#15
Nicole Dr
Milford, CT 06460
|
1,540 sq. feet
|
3 baths 3 beds |
show details | |

|
#16
Golden Hill St Apt 40
Milford, CT 06460
|
42,000 sq. feet
|
2 baths 5 beds |
show details | |

|
#17
Swanson Cres
Milford, CT 06461
|
755 sq. feet
|
1 baths 1 beds |
show details | |

|
#18
Naugatuck Ave
Milford, CT 06460
|
2,330 sq. feet
|
2 baths 2 beds |
show details | |

|
#19
Gulf St
Milford, CT 06460
|
2,429 sq. feet
|
2 baths 4 beds |
show details | |

|
#20
Robert Treat Dr Apt C
Milford, CT 06460
|
- sq. feet
|
- baths - beds |
show details |
| Photo | Address | Area | Beds / Baths | Price | Details |
|---|---|---|---|---|---|

|
#21
Marino Dr, C O Tara Delvecchio
Milford, CT 06460
|
- sq. feet
|
- baths - beds |
show details | |

|
#22
Schooner Ln Apt 2g
Milford, CT 06460
|
- sq. feet
|
- baths - beds |
show details | |

|
#23
Foran Rd Apt 49
Milford, CT 06460
|
- sq. feet
|
- baths - beds |
show details | |

|
#24
Viscount Dr Unit B55
Milford, CT 06460
|
- sq. feet
|
- baths - beds |
show details | |

|
#25
Plains Rd # F137
Milford, CT 06461
|
- sq. feet
|
- baths - beds |
show details | |

|
#26
Miles St
Milford, CT 06460
|
- sq. feet
|
- baths - beds |
show details | |

|
#27
Sterling Dr
Milford, CT 06460
|
- sq. feet
|
- baths - beds |
show details | |

|
#28
Lynne Pl
Bridgeport, CT 06610
|
1,152 sq. feet
|
2 baths 3 beds |
$389,900
|
show details |

|
#29
Sentinel Hill Rd
Derby, CT 06418
|
1,740 sq. feet
|
1 baths 2 beds |
$322,400
|
show details |

|
#30
Ellsworth St
West Haven, CT 06516
|
960 sq. feet
|
1 baths 3 beds |
$365,000
|
show details |
| Photo | Address | Area | Beds / Baths | Price | Details |
|---|---|---|---|---|---|

|
#31
Santangelo Terrace #30
Derby, CT 06418
|
652 sq. feet
|
1 baths 1 beds |
$189,000
|
show details |

|
#32
Amity Rd
Woodbridge, CT 06525
|
1,850 sq. feet
|
1 baths 3 beds |
$549,900
|
show details |

|
#33
Beecher Pl
East Haven, CT 06512
|
1,454 sq. feet
|
1 baths 3 beds |
$445,000
|
show details |

|
#34
Fairview Ave # U-2
Hamden, CT 06514
|
1,284 sq. feet
|
1 baths 3 beds |
$174,000
|
show details |

|
#35
Winchester Ave
Hamden, CT 06517
|
1,820 sq. feet
|
2 baths 5 beds |
$489,900
|
show details |

|
#36
Seymour Rd
New Haven, CT 06525
|
1,639 sq. feet
|
2 baths 3 beds |
$312,000
|
show details |

|
#37
N Star Dr
Seymour, CT 06483
|
1,670 sq. feet
|
2 baths 3 beds |
$424,900
|
show details |

|
#38
Beecher Ave
Shelton, CT 06484
|
1,911 sq. feet
|
2 baths 4 beds |
$589,900
|
show details |

|
#39
Birchwood Dr
Hamden, CT 06518
|
2,604 sq. feet
|
2 baths 3 beds |
$614,900
|
show details |

|
#40
Alfred Ct
Stratford, CT 06615
|
1,406 sq. feet
|
2 baths 3 beds |
$449,900
|
show details |
| Photo | Address | Area | Beds / Baths | Price | Details |
|---|---|---|---|---|---|

|
#41
Kennedy Dr
Bridgeport, CT 06606
|
1,063 sq. feet
|
1 baths 2 beds |
$224,900
|
show details |

|
#42
Sasco Hill Rd
Fairfield, CT 06824
|
- sq. feet
|
5 baths 5 beds |
$5,990,000
|
show details |

|
#43
Stevens St Apt 1-9
Bridgeport, CT 06606
|
681 sq. feet
|
1 baths 1 beds |
show details | |

|
#44
Dover St
Bridgeport, CT 06610
|
982 sq. feet
|
1 baths 2 beds |
show details | |

|
#45
Weber Ave
Bridgeport, CT 06610
|
1,322 sq. feet
|
2 baths 3 beds |
show details | |

|
#46
Russell Rd
Bethany, CT 06524
|
3,787 sq. feet
|
3 baths 5 beds |
show details | |

|
#47
-337 Ridgefield Ave
Bridgeport, CT 06610
|
3,679 sq. feet
|
3 baths 6 beds |
show details | |

|
#48
Forest Hills Rd
West Haven, CT 06516
|
1,638 sq. feet
|
1 baths 3 beds |
show details | |

|
#49
Daniel Ct
Westport, CT 06880
|
4,566 sq. feet
|
4 baths 4 beds |
show details | |

|
Check over 1 million property listings on Foreclosure.com!
|
browse all offers | |||

Latest news about housing in Milford, CT collected exclusively by city-data.com from local newspapers, TV, and radio stations


Median year apartment built: 1974
Household type by relationship:
Households: 50,872- Male householders: 9,821 (2,578 living alone), Female householders: 11,417 (4,042 living alone)
10,938 spouses (10,824 opposite-sex spouses), 1,275 unmarried partners, (1,231 opposite-sex unmarried partners), 13,766 children (13,095 natural, 163 adopted, 507 stepchildren), 620 grandchildren, 400 brothers or sisters, 641 parents, 35 foster children, 695 other relatives, 799 non-relatives
- In group quarters: 459
Size of family households: 6,195 2-persons, 3,363 3-persons, 2,401 4-persons, 750 5-persons, 363 6-persons, 95 7-or-more-persons.
Size of nonfamily households: 6,990 1-person, 1,313 2-persons, 72 3-persons, 9 4-persons.
6,411 married couples with children.
1,506 single-parent households (433 men, 1,073 women).
87.4% of residents of Milford speak English at home.
3.2% of residents speak Spanish at home (71% speak English very well, 25% speak English well, 3% speak English not well, 2% don't speak English at all).
5.3% of residents speak other Indo-European language at home (71% speak English very well, 19% speak English well, 6% speak English not well, 5% don't speak English at all).
3.0% of residents speak Asian or Pacific Island language at home (69% speak English very well, 16% speak English well, 13% speak English not well, 2% don't speak English at all).
0.8% of residents speak other language at home (74% speak English very well, 16% speak English well, 10% speak English not well).
Foreign born population: 5,152 (10.1%)
(69.5% of them are naturalized citizens)
| Here: | 6.2 |
| State: | 6.5 |
| Here: | 3.8 |
| State: | 4.0 |

- Bedrooms in owner-occupied houses and condos in Milford, Connecticut
- 22no bedroom
- 7961 bedroom
- 3,5212 bedrooms
- 7,8843 bedrooms
- 3,9144 bedrooms
- 3585+ bedrooms

- Bedrooms in renter-occupied apartments in Milford, Connecticut
- 229no bedroom
- 2,0231 bedroom
- 1,8302 bedrooms
- 6333 bedrooms
- 2874 bedrooms
- 135+ bedrooms

- Cars and other vehicles available in Milford in owner-occupied houses/condos
- 419no vehicle
- 4,3471 vehicle
- 6,7582 vehicles
- 3,4213 vehicles
- 1,1524 vehicles
- 3985+ vehicles

- Cars and other vehicles available in Milford in renter-occupied apartments
- 516no vehicle
- 2,6071 vehicle
- 1,6042 vehicles
- 2013 vehicles
- 634 vehicles
- 235+ vehicles

- Rooms in owner-occupied houses in Milford, Connecticut
- 101 room
- 452 rooms
- 5773 rooms
- 1,4094 rooms
- 2,9115 rooms
- 4,5256 rooms
- 2,8607 rooms
- 2,1568 rooms
- 2,0029+ rooms

- Rooms in renter-occupied apartments in Milford, Connecticut
- 1731 room
- 6862 rooms
- 1,1803 rooms
- 1,1474 rooms
- 8665 rooms
- 5576 rooms
- 1987 rooms
- 1098 rooms
- 989+ rooms


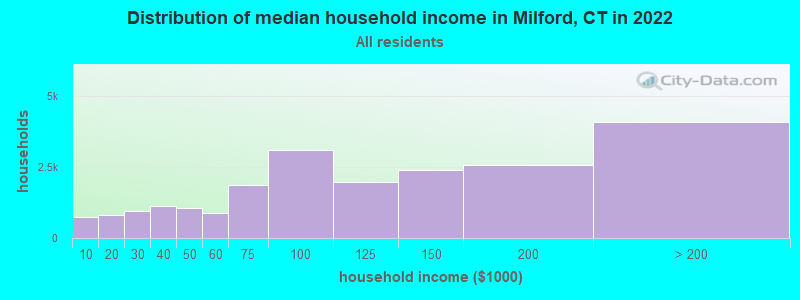
Milford, CT household income distribution

- 728Less than $10,000
- 825$10,000 to $19,999
- 939$20,000 to $29,999
- 1,131$30,000 to $39,999
- 1,073$40,000 to $49,999
- 878$50,000 to $59,999
- 1,850$60,000 to $74,999
- 3,098$75,000 to $99,999
- 1,967$100,000 to $124,999
- 2,379$125,000 to $149,999
- 2,573$150,000 to $199,999
- 4,084$200,000 or more
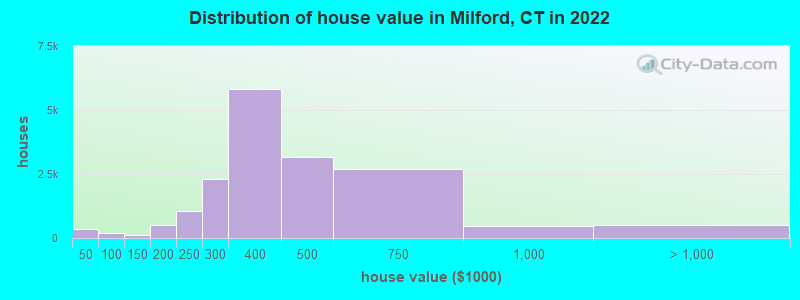
Home value of owner - occupied houses in 2022 in Milford, CT
-
- 107Less than $10,000
- 12$15,000 to $19,999
- 33$20,000 to $24,999
- 115$30,000 to $34,999
- 60$35,000 to $39,999
- 19$40,000 to $49,999
- 51$70,000 to $79,999
- 17$80,000 to $89,999
- 101$90,000 to $99,999
- 41$100,000 to $124,999
- 84$125,000 to $149,999
- 260$150,000 to $174,999
- 264$175,000 to $199,999
- 1,050$200,000 to $249,999
- 2,315$250,000 to $299,999
- 5,828$300,000 to $399,999
- 3,166$400,000 to $499,999
- 2,711$500,000 to $749,999
- 481$750,000 to $999,999
- 232$1,000,000 to $1,499,999
- 157$1,500,000 to $1,999,999
- 118$2,000,000 or more
Rent paid by renters in 2022 in Milford, CT
-
- 48$200 to $249
- 21$250 to $299
- 137$350 to $399
- 31$400 to $449
- 5$450 to $499
- 43$550 to $599
- 24$600 to $649
- 81$650 to $699
- 21$700 to $749
- 30$750 to $799
- 63$800 to $899
- 73$900 to $999
- 522$1,000 to $1,249
- 626$1,250 to $1,499
- 2,045$1,500 to $1,999
- 632$2,000 to $2,499
- 79$2,500 to $2,999
- 89$3,000 to $3,499
- 20$3,500 or more
- 337No cash rent


Percentage of workers working in this county: 61.6%
Number of people working at home: 4,838 (17.4% of all workers)
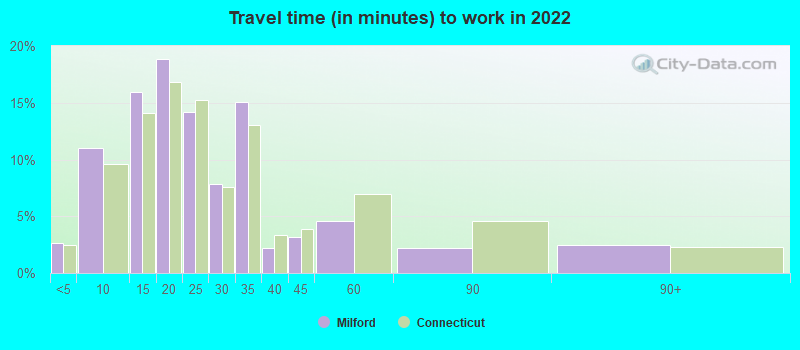
Travel time to work (commute)
- Less than 5 minutes: 426
- 5 to 9 minutes: 2,481
- 10 to 14 minutes: 3,606
- 15 to 19 minutes: 4,009
- 20 to 24 minutes: 3,676
- 25 to 29 minutes: 1,490
- 30 to 34 minutes: 2,260
- 35 to 39 minutes: 431
- 40 to 44 minutes: 779
- 45 to 59 minutes: 1,599
- 60 to 89 minutes: 1,314
- 90 or more minutes: 879
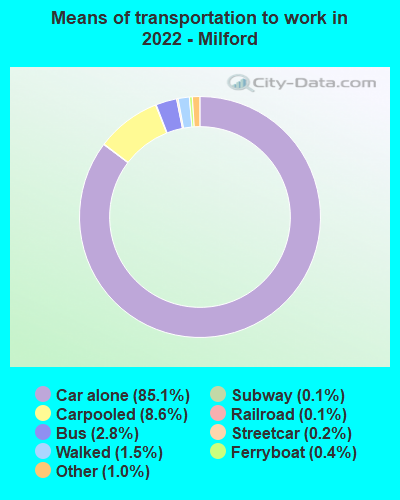
Means of transportation to work:
- Drove a car alone: 20,656 (70.4%)
- Carpooled: 2,219 (7.6%)
- Bus: 684 (2.3%)
- Subway or elevated rail: 81 (0.3%)
- Long-distance train or commuter rail: 17 (0.1%)
- Light rail, streetcar or trolley: 41 (0.1%)
- Ferryboat: 107 (0.4%)
- Taxi: 303 (1.0%)
- Bicycle: 10 (0.0%)
- Walked: 392 (1.3%)
- Worked at home: 4,838 (16.5%)

- Unemployment by race in 2022
- Unemployment rate for White non-Hispanic residents
- 2.7%Males
- 3.6%Females
- Unemployment rate for Black residents
- 3.9%Males
- Unemployment rate for Asian residents
- 5.1%Males
- 5.4%Females
- Unemployment rate for other race residents
- 1.6%Males
- Unemployment rate for two or more race residents
- 14.3%Males
- 2.9%Females
- Unemployment rate for Hispanic or Latino residents
- 6.1%Males
- 2.1%Females

- Year of entry for the foreign-born population in Milford, Connecticut
- 9832010 or later
- 1,0562000 to 2009
- 1,0981990 to 1999
- 7811980 to 1989
- 5821970 to 1979
- 1,339Before 1970

First ancestries reported:
- Italian: 4,550 (22.4%)
- Irish: 2,137 (10.5%)
- English: 1,300 (6.4%)
- German: 1,155 (5.7%)
- American: 1,043 (5.1%)
- Polish: 702 (3.5%)
- European: 389 (1.9%)
- French: 387 (1.9%)
- French Canadian: 384 (1.9%)
- Brazilian: 308 (1.5%)
- Eastern European: 232 (1.1%)
- Ukrainian: 224 (1.1%)
- Turkish: 217 (1.1%)
- Hungarian: 197 (1.0%)
- Russian: 184 (0.9%)
- Greek: 179 (0.9%)
- Scottish: 178 (0.9%)
- Portuguese: 153 (0.8%)
- Albanian: 132 (0.6%)
- Slovak: 132 (0.6%)
- Cape Verdean: 129 (0.6%)
- Swedish: 100 (0.5%)
- Norwegian: 99 (0.5%)
- Northern European: 76 (0.4%)
- Canadian: 75 (0.4%)
- Croatian: 70 (0.3%)
- Czech: 70 (0.3%)
- British: 58 (0.3%)
- Bulgarian: 53 (0.3%)
- Romanian: 44 (0.2%)
- Lebanese: 40 (0.2%)
- Austrian: 33 (0.2%)
- Arab: 33 (0.2%)
- Ethiopian: 29 (0.1%)
- Dutch: 28 (0.1%)
- Scandinavian: 24 (0.1%)
- Scotch-Irish: 23 (0.1%)
- Egyptian: 23 (0.1%)
- Czechoslovakian: 22 (0.1%)
- Armenian: 22 (0.1%)
- Finnish: 21 (0.1%)
- Ghanaian: 19 (0.09%)
- Jordanian: 19 (0.09%)
- Lithuanian: 18 (0.09%)
- Haitian: 18 (0.09%)
- West Indian: 15 (0.07%)
- Moroccan: 14 (0.07%)
- Swiss: 14 (0.07%)
- Slovene: 10 (0.05%)
- Jamaican: 9 (0.04%)
- Belgian: 8 (0.04%)
- Serbian: 8 (0.04%)
- Trinidadian and Tobagonian: 8 (0.04%)
- Syrian: 6 (0.03%)
Most common places of birth for foreign-born residents (%):
| Milford: | 7.9% (408) |
| Connecticut: | 7.3% (39,879) |
| Milford: | 6.6% (339) |
| Connecticut: | 4.4% (24,001) |
| Milford: | 5.5% (282) |
| Connecticut: | 4.7% (25,461) |
| Milford: | 5.2% (269) |
| Connecticut: | 2.8% (15,141) |
| Milford: | 4.2% (214) |
| Connecticut: | 1.9% (10,545) |
| Milford: | 4.0% (206) |
| Connecticut: | 0.6% (3,362) |
| Milford: | 4.0% (204) |
| Connecticut: | 3.3% (18,124) |
| Milford: | 3.2% (165) |
| Connecticut: | 0.5% (2,805) |
| Milford: | 3.2% (163) |
| Connecticut: | 2.3% (12,380) |
| Milford: | 2.7% (139) |
| Connecticut: | 5.0% (27,361) |
| Milford: | 2.5% (131) |
| Connecticut: | 4.4% (24,026) |
| Milford: | 2.4% (122) |
| Connecticut: | 4.0% (21,729) |
| Milford: | 2.3% (118) |
| Connecticut: | 1.2% (6,448) |
| Milford: | 2.0% (103) |
| Connecticut: | 1.4% (7,495) |
| Milford: | 1.9% (99) |
| Connecticut: | 1.7% (9,214) |
| Milford: | 1.8% (91) |
| Connecticut: | 0.5% (2,715) |
| Milford: | 1.7% (90) |
| Connecticut: | 1.2% (6,551) |
| Milford: | 1.7% (88) |
| Connecticut: | 0.4% (1,946) |
| Milford: | 1.7% (86) |
| Connecticut: | 0.9% (5,088) |
| Milford: | 1.6% (84) |
| Connecticut: | 1.3% (7,149) |
| Milford: | 1.6% (83) |
| Connecticut: | 0.4% (2,234) |
| Milford: | 1.6% (80) |
| Connecticut: | 1.2% (6,678) |
Place of birth for U.S.-born residents:
- This state: 32,745
- Other state: 11,717
- Northeast: 8,111
- Midwest: 1,333
- South: 1,416
- West: 870
91.3% of Milford residents lived in the same house 1 years ago.
Out of people who lived in different houses, 25.6% lived in this county.
Out of people who lived in different counties, 46.4% lived in Connecticut.
| Milford: | 91.3% |
| State average: | 88.4% |
Education attainment for males 25 years and older:
- No schooling: 215
- Nursery to 4th grade: 23
- 5th and 6th grade: 0
- 7th and 8th grade: 95
- 9th grade: 119
- 10th grade: 149
- 11th grade: 49
- 12th grade, no diploma: 206
- High school graduate (or equivalency): 4,659
- Less than 1 year of college: 1,083
- Some college more than 1 year, no degree: 1,985
- Associate degree: 1,124
- Bachelor's degree: 5,040
- Master's degree: 2,425
- Professional school degree: 730
- Doctorate degree: 216

Education attainment for females 25 years and older:
- No schooling: 252
- Nursery to 4th grade: 58
- 5th and 6th grade: 60
- 7th and 8th grade: 74
- 9th grade: 30
- 10th grade: 122
- 11th grade: 72
- 12th grade, no diploma: 249
- High school graduate (or equivalency): 4,742
- Less than 1 year of college: 1,117
- Some college more than 1 year, no degree: 1,845
- Associate degree: 1,940
- Bachelor's degree: 5,664
- Master's degree: 3,414
- Professional school degree: 722
- Doctorate degree: 362


Housing units in structures:
- One, detached: 15,977
- One, attached: 1,476
- Two: 980
- 3 or 4: 1,234
- 5 to 9: 906
- 10 to 19: 1,089
- 20 to 49: 894
- 50 or more: 329
- Mobile homes: 214
Median worth of mobile homes: $102,653
Housing units lacking complete kitchen facilities in 2022: 0.6%
House/condo owner moved in on average 16 years ago
Renter moved in on average 2 years ago

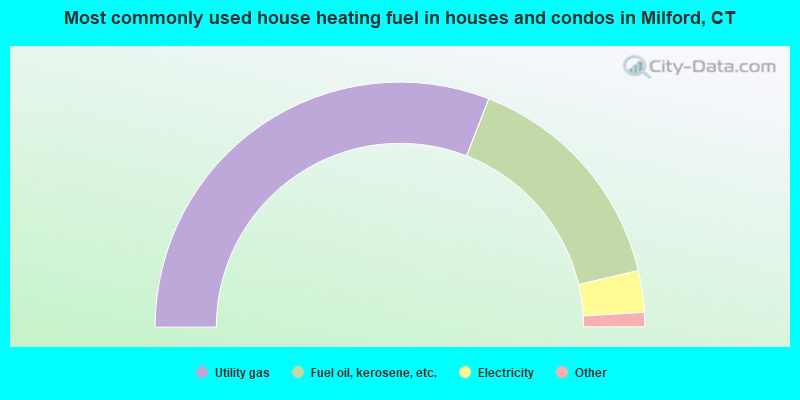
- 61.9%Utility gas
- 30.8%Fuel oil, kerosene, etc.
- 5.5%Electricity
- 0.8%Bottled, tank, or LP gas
- 0.4%Other fuel
- 0.3%Wood
- 0.2%No fuel used
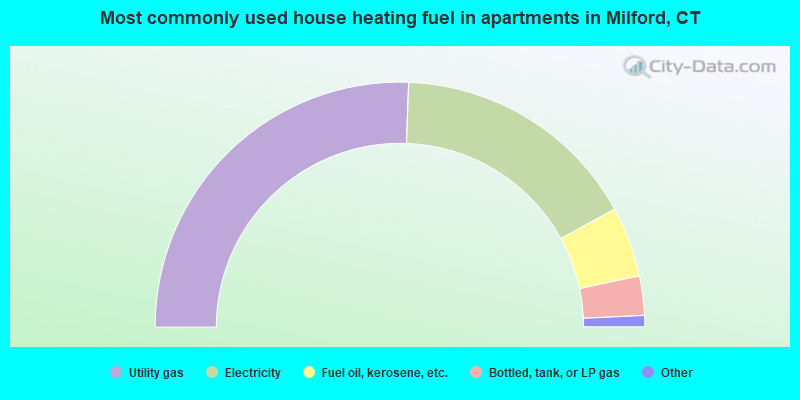
- 51.2%Utility gas
- 32.9%Electricity
- 9.3%Fuel oil, kerosene, etc.
- 5.2%Bottled, tank, or LP gas
- 0.6%No fuel used
- 0.5%Other fuel
- 0.3%Wood
Private vs. public school enrollment:
| Here: | 6.7% |
| Connecticut: | 9.5% |
| Here: | 19.1% |
| Connecticut: | 12.9% |
| Here: | 37.1% |
| Connecticut: | 35.5% |


