Midwest City, OK (Oklahoma) Houses and Residents
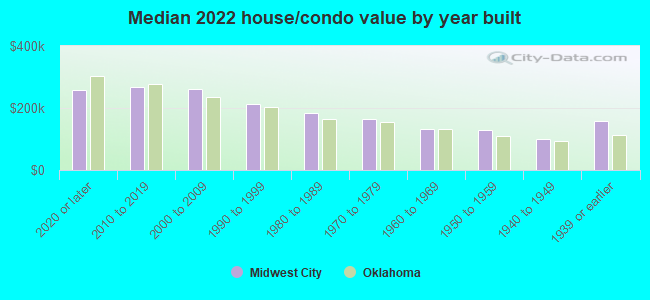
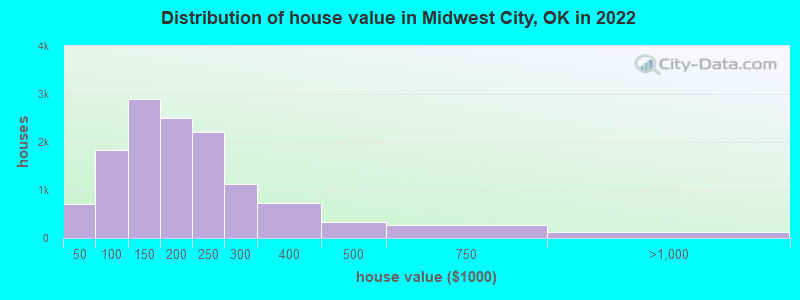
Estimated median house or condo value in 2022: $169,952 (it was $61,600 in 2000 )
Midwest City:
$169,952Oklahoma:
$191,700
Lower value quartile - upper value quartile: $118,610 - $249,855Total population: 57,039 (Urban population: 54,048, Rural population: 154 (all nonfarm) )
Houses: 27,073 (24,718 occupied: 13,824 owner occupied, 10,851 renter occupied )
% of renters here:
44%State:
35%
Housing density: 1,101 houses/condos per square mile
Median price asked for vacant for-sale houses and condos in 2022: $133,683.
Median contract rent in 2022: $789 (lower quartile is $656, upper quartile is $982)
Median rent asked for vacant for-rent units in 2022: $1,004
Median gross rent in Midwest City, OK in 2022: $998
Housing units in Midwest City with a mortgage: 7,757 (327 second mortgage, 26 home equity loan, 151 both second mortgage and home equity loan )Houses without a mortgage: 195
Median household income for houses/condos with a mortgage: $85,354
Median household income for apartments without a mortgage: $54,318
Median monthly housing costs: $956
Data:
Median house or condo value ($)
Median house or condo value ($ change since 2000)
Median house or condo value ($) - White
Median house or condo value ($) - Black or African American
Median house or condo value ($) - Asian
Median house or condo value ($) - Hispanic or Latino
Median house or condo value ($) - American Indian and Alaska Native
Median house or condo value ($) - Multirace
Median house or condo value ($) - Other Race
Median price asked for mobile homes ($)
Household density (households per square mile)
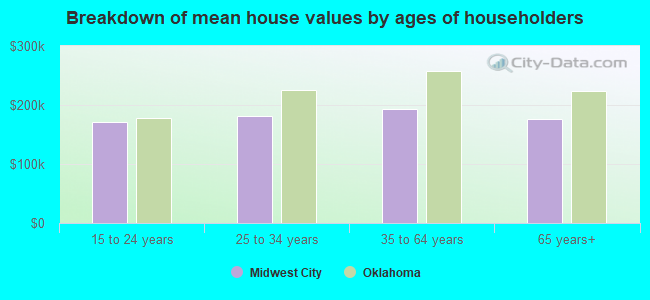
Mean house or condo value by units in structure - 1, detached ($)
Mean house or condo value by units in structure - 1, attached ($)
Mean house or condo value by units in structure - 2 ($)
Mean house or condo value by units in structure by units in structure - 3 or 4 ($)
Mean house or condo value by units in structure - 5 or more ($)
Mean house or condo value by units in structure - Boat, RV, van, etc. ($)
Mean house or condo value by units in structure - Mobile home ($)
Median contract rent ($)
Median contract rent - Lower quartile ($)
Median contract rent - Upper quartile ($)
Median gross rent ($)
Urban houses (%)
Rural houses (%)
Houses occupied (%)
Houses occupied (% change since 2000)
Houses owner occupied (%)
Houses owner occupied (% change since 2000)
Houses renter occupied (%)
Houses renter occupied (% change since 2000)
Vacant housing units - For rent (%)
Vacant housing units - For rent (% change since 2000)
Vacant housing units - For sale only (%)
Vacant housing units - For sale only (% change since 2000)
Vacant housing units - Rented or sold, not occupied (%)
Vacant housing units - Rented or sold, not occupied (% change since 2000)
Vacant housing units - For seasonal, recreational, or occasional use (%)
Vacant housing units - For seasonal, recreational, or occasional use (% change since 2000)
Vacant housing units - For migrant workers (%)
Vacant housing units - For migrant workers (% change since 2000)
Vacant housing units - Other vacant (%)
Vacant housing units - Other vacant (% change since 2000)
Median monthly housing costs ($)
Median household income for houses/condos with a mortgage ($)
Median household income for houses/condos without a mortgage ($)
Median household income ($)
Median household income ($) - White
Median household income ($) - Black or African American
Median household income ($) - Asian
Median household income ($) - Hispanic or Latino
Median household income ($) - American Indian and Alaska Native
Median household income ($) - Multirace
Median household income ($) - Other Race
Mortgage status - with mortgage (%)
Mortgage status - with second mortgage (%)
Mortgage status - with home equity loan (%)
Mortgage status - with both second mortgage and home equity loan (%)
Mortgage status - without a mortgage (%)
Median year house/condo built
Median year apartment built
Household type by relationship - Male householder living alone (%)
Household type by relationship - Male householder not living alone (%)
Household type by relationship - Female householder living alone (%)
Household type by relationship - Female householder not living alone (%)
Household type by relationship - Opposite-Sex spouse (%)
Household type by relationship - Same-Sex spouse (%)
Household type by relationship - Opposite-Sex unmarried partner (%)
Household type by relationship - Same-Sex unmarried partner (%)
Household type by relationship - In group quarters (%)
Size of family households - 2-person household (%)
Size of family households - 3-person household (%)
Size of family households - 4-person household (%)
Size of family households - 5-person household (%)
Size of family households - 6-person household (%)
Size of family households - 7-or-more-person household (%)
Size of nonfamily households - 1-person household (%)
Size of nonfamily households - 2-person household (%)
Size of nonfamily households - 3-person household (%)
Size of nonfamily households - 4-person household (%)
Size of nonfamily households - 5-person household (%)
Size of nonfamily households - 6-person household (%)
Size of nonfamily households - 7-or-moreperson household (%)
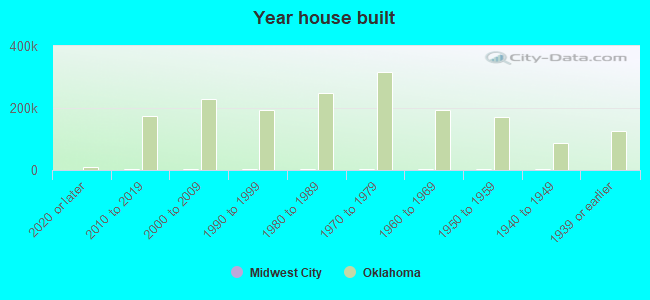
Year house built - Built 2010 or later (%)
Year house built - Built 2000 to 2009 (%)
Year house built - Built 1990 to 1999 (%)
Year house built - Built 1980 to 1989 (%)
Year house built - Built 1970 to 1979 (%)
Year house built - Built 1960 to 1969 (%)
Year house built - Built 1950 to 1959 (%)
Year house built - Built 1940 to 1949 (%)
Year house built - Built 1939 or earlier (%)
Median number of rooms in houses and condos
Median number of rooms in apartments
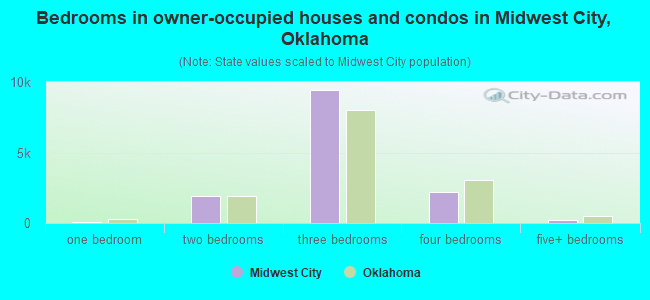
Median number of bedrooms in owner occupied houses
Mean number of bedrooms in owner occupied houses
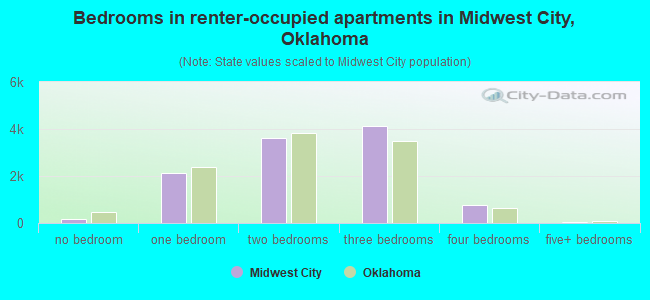
Median number of bedrooms in renter occupied houses
Mean number of bedrooms in renter occupied houses
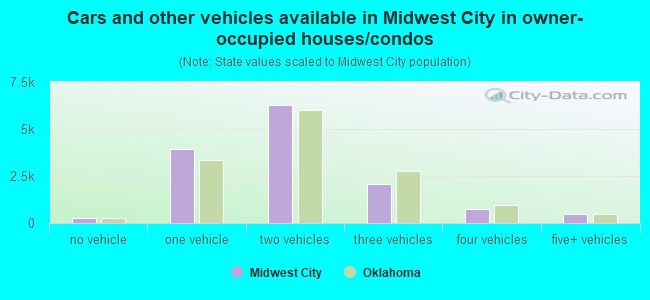
Median number of vehichles in owner occupied houses
Mean number of vehichles in owner occupied houses
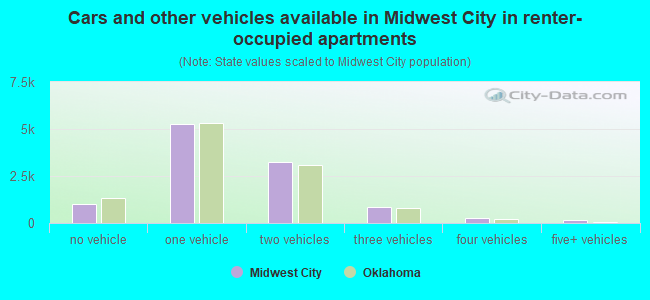
Median number of vehichles in renter occupied houses
Mean number of vehichles in renter occupied houses
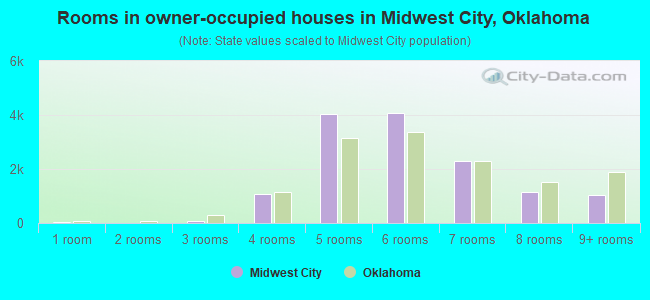
Rooms in owner-occupied houses - 1 room (%)
Rooms in owner-occupied houses - 2 rooms (%)
Rooms in owner-occupied houses - 3 rooms (%)
Rooms in owner-occupied houses - 4 rooms (%)
Rooms in owner-occupied houses - 5 rooms (%)
Rooms in owner-occupied houses - 6 rooms (%)
Rooms in owner-occupied houses - 7 rooms (%)
Rooms in owner-occupied houses - 8 rooms (%)
Rooms in owner-occupied houses - 9+ rooms (%)
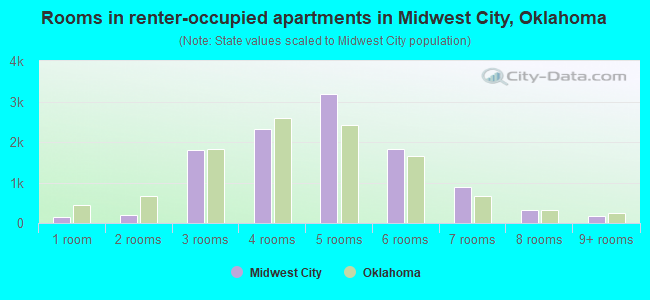
Rooms in renter-occupied houses - 1 room (%)
Rooms in renter-occupied houses - 2 rooms (%)
Rooms in renter-occupied houses - 3 rooms (%)
Rooms in renter-occupied houses - 4 rooms (%)
Rooms in renter-occupied houses - 5 rooms (%)
Rooms in renter-occupied houses - 6 rooms (%)
Rooms in renter-occupied houses - 7 rooms (%)
Rooms in renter-occupied houses - 8 rooms (%)
Rooms in renter-occupied houses - 9+ rooms (%)
Bedrooms in owner-occupied houses - no bedrooms (%)
Bedrooms in owner-occupied houses - 1 bedroom (%)
Bedrooms in owner-occupied houses - 2 bedrooms (%)
Bedrooms in owner-occupied houses - 3 bedrooms (%)
Bedrooms in owner-occupied houses - 4 bedrooms (%)
Bedrooms in owner-occupied houses - 5+ bedrooms (%)
Bedrooms in renter-occupied houses - no bedrooms (%)
Bedrooms in renter-occupied houses - 1 bedroom (%)
Bedrooms in renter-occupied houses - 2 bedrooms (%)
Bedrooms in renter-occupied houses - 3 bedrooms (%)
Bedrooms in renter-occupied houses - 4 bedrooms (%)
Bedrooms in renter-occupied houses - 5+ bedrooms (%)
Vehicles available in owner-occupied houses - no vehicle available (%)
Vehicles available in owner-occupied houses - 1 vehicle available(%)
Vehicles available in owner-occupied houses - 2 Vehicles available (%)
Vehicles available in owner-occupied houses - 3 Vehicles available (%)
Vehicles available in owner-occupied houses - 4 Vehicles available (%)
Vehicles available in owner-occupied houses - 5+ Vehicles available (%)
Vehicles available in renter-occupied houses - no vehicle available (%)
Vehicles available in renter-occupied houses - 1 vehicle available (%)
Vehicles available in renter-occupied houses - 2 Vehicles available (%)
Vehicles available in renter-occupied houses - 3 Vehicles available (%)
Vehicles available in renter-occupied houses - 4 Vehicles available (%)
Vehicles available in renter-occupied houses - 5+ Vehicles available (%)
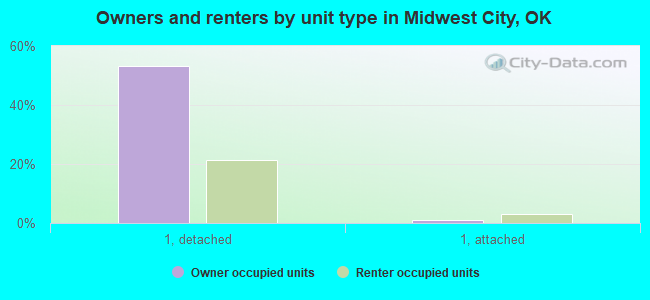
Housing units in structures - 1, detached (%)
Housing units in structures - 1, attached (%)
Housing units in structures - 2 (%)
Housing units in structures - 3 or 4 (%)
Housing units in structures - 5 to 9 (%)
Housing units in structures - 10 to 19 (%)
Housing units in structures - 20 to 49 (%)
Housing units in structures - 50 or more (%)
Housing units in structures - Mobile home (%)
Housing units in structures - Boat, RV, van, etc. (%)
Housing units in structures - Owners - 1, detached (%)
Housing units in structures - Owners - 1, attached (%)
Housing units in structures - Owners - 2 (%)
Housing units in structures - Owners - 3 or 4 (%)
Housing units in structures - Owners - 5 to 9 (%)
Housing units in structures - Owners - 10 to 19 (%)
Housing units in structures - Owners - 20 to 49 (%)
Housing units in structures - Owners - 50 or more (%)
Housing units in structures - Owners - Mobile home (%)
Housing units in structures - Owners - Boat, RV, van, etc. (%)
Housing units in structures - Renters - 1, detached (%)
Housing units in structures - Renters - 1, attached (%)
Housing units in structures - Renters - 2 (%)
Housing units in structures - Renters - 3 or 4 (%)
Housing units in structures - Renters - 5 to 9 (%)
Housing units in structures - Renters - 10 to 19 (%)
Housing units in structures - Renters - 20 to 49 (%)
Housing units in structures - Renters - 50 or more (%)
Housing units in structures - Renters - Mobile home (%)
Housing units in structures - Renters - Boat, RV, van, etc. (%)
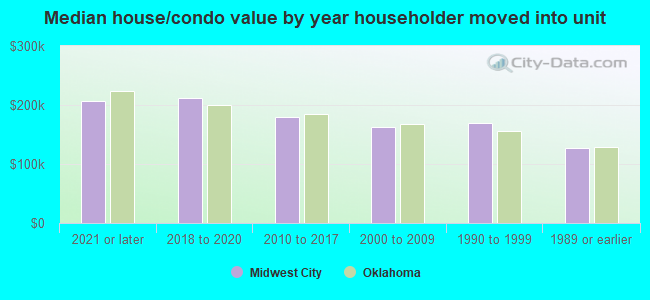
House/condo owner moved in on average (years ago)
Renter moved in on average (years ago)
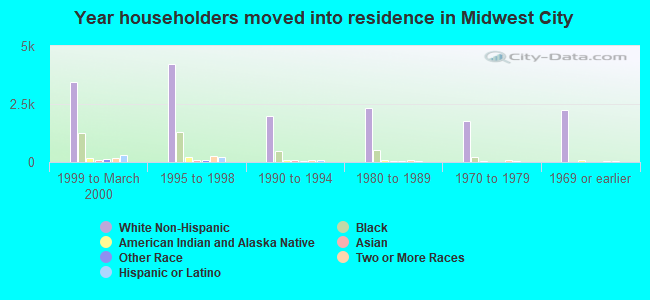
Year householder moved into unit - Moved in 1999 to March 2000 (%)
Year householder moved into unit - Moved in 1999 to March 2000 (%) - White
Year householder moved into unit - Moved in 1999 to March 2000 (%) - Black or African American
Year householder moved into unit - Moved in 1999 to March 2000 (%) - Asian
Year householder moved into unit - Moved in 1999 to March 2000 (%) - Hispanic or Latino
Year householder moved into unit - Moved in 1999 to March 2000 (%) - American Indian and Alaska Native
Year householder moved into unit - Moved in 1999 to March 2000 (%) - Multirace
Year householder moved into unit - Moved in 1999 to March 2000 (%) - Other Race
Year householder moved into unit - Moved in 1995 to 1998 (%)
Year householder moved into unit - Moved in 1995 to 1998 (%) - White
Year householder moved into unit - Moved in 1995 to 1998 (%) - Black or African American
Year householder moved into unit - Moved in 1995 to 1998 (%) - Asian
Year householder moved into unit - Moved in 1995 to 1998 (%) - Hispanic or Latino
Year householder moved into unit - Moved in 1995 to 1998 (%) - American Indian and Alaska Native
Year householder moved into unit - Moved in 1995 to 1998 (%) - Multirace
Year householder moved into unit - Moved in 1995 to 1998 (%) - Other Race
Year householder moved into unit - Moved in 1990 to 1994 (%)
Year householder moved into unit - Moved in 1990 to 1994 (%) - White
Year householder moved into unit - Moved in 1990 to 1994 (%) - Black or African American
Year householder moved into unit - Moved in 1990 to 1994 (%) - Asian
Year householder moved into unit - Moved in 1990 to 1994 (%) - Hispanic or Latino
Year householder moved into unit - Moved in 1990 to 1994 (%) - American Indian and Alaska Native
Year householder moved into unit - Moved in 1990 to 1994 (%) - Multirace
Year householder moved into unit - Moved in 1990 to 1994 (%) - Other Race
Year householder moved into unit - Moved in 1980 to 1989 (%)
Year householder moved into unit - Moved in 1980 to 1989 (%) - White
Year householder moved into unit - Moved in 1980 to 1989 (%) - Black or African American
Year householder moved into unit - Moved in 1980 to 1989 (%) - Asian
Year householder moved into unit - Moved in 1980 to 1989 (%) - Hispanic or Latino
Year householder moved into unit - Moved in 1980 to 1989 (%) - American Indian and Alaska Native
Year householder moved into unit - Moved in 1980 to 1989 (%) - Multirace
Year householder moved into unit - Moved in 1980 to 1989 (%) - Other Race
Year householder moved into unit - Moved in 1970 to 1979 (%)
Year householder moved into unit - Moved in 1970 to 1979 (%) - White
Year householder moved into unit - Moved in 1970 to 1979 (%) - Black or African American
Year householder moved into unit - Moved in 1970 to 1979 (%) - Asian
Year householder moved into unit - Moved in 1970 to 1979 (%) - Hispanic or Latino
Year householder moved into unit - Moved in 1970 to 1979 (%) - American Indian and Alaska Native
Year householder moved into unit - Moved in 1970 to 1979 (%) - Multirace
Year householder moved into unit - Moved in 1970 to 1979 (%) - Other Race
Year householder moved into unit - Moved in 1969 or earlier (%)
Year householder moved into unit - Moved in 1969 or earlier (%) - White
Year householder moved into unit - Moved in 1969 or earlier (%) - Black or African American
Year householder moved into unit - Moved in 1969 or earlier (%) - Asian
Year householder moved into unit - Moved in 1969 or earlier (%) - Hispanic or Latino
Year householder moved into unit - Moved in 1969 or earlier (%) - American Indian and Alaska Native
Year householder moved into unit - Moved in 1969 or earlier (%) - Multirace
Year householder moved into unit - Moved in 1969 or earlier (%) - Other Race
Housing units lacking complete plumbing facilities (%)
Housing units lacking complete kitchen facilities (%)
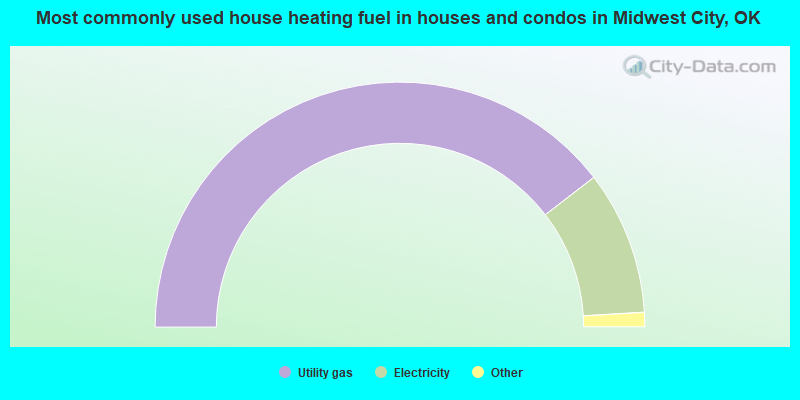
House heating fuel used in houses and condos - Utility gas (%)
House heating fuel used in houses and condos - Bottled, tank, or LP gas (%)
House heating fuel used in houses and condos - Electricity (%)
House heating fuel used in houses and condos - Fuel oil, kerosene, etc. (%)
House heating fuel used in houses and condos - Coal or coke (%)
House heating fuel used in houses and condos - Wood (%)
House heating fuel used in houses and condos - Solar energy (%)
House heating fuel used in houses and condos - Other fuel (%)
House heating fuel used in houses and condos - No fuel used (%)
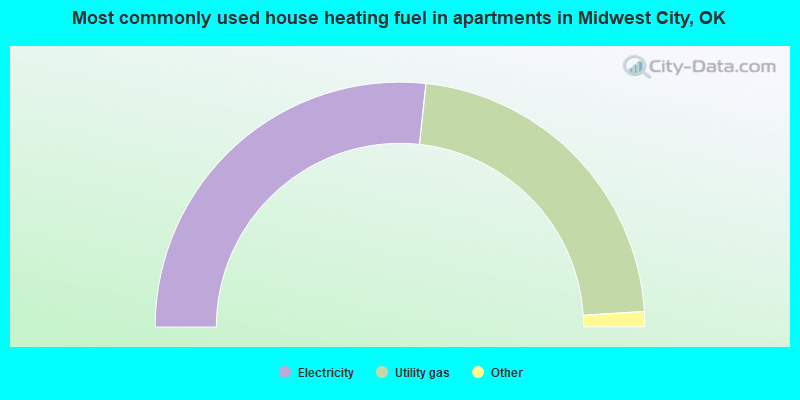
House heating fuel used in apartments - Utility gas (%)
House heating fuel used in apartments - Bottled, tank, or LP gas (%)
House heating fuel used in apartments - Electricity (%)
House heating fuel used in apartments - Fuel oil, kerosene, etc. (%)
House heating fuel used in apartments - Coal or coke (%)
House heating fuel used in apartments - Wood (%)
House heating fuel used in apartments - Solar energy (%)
House heating fuel used in apartments - Other fuel (%)
House heating fuel used in apartments - No fuel used (%)
Median year house/condo built: 1974Median year apartment built: 1976Household type by relationship:
Households: 58,616
Male householders: 10,974 (3,379 living alone ), Female householders: 13,436 (4,528 living alone )9,187 spouses (9,084 opposite-sex spouses ), 1,529 unmarried partners , (1,366 opposite-sex unmarried partners ), 17,421 children (16,013 natural , 415 adopted , 992 stepchildren ), 1,542 grandchildren , 826 brothers or sisters , 517 parents , 160 foster children , 1,019 other relatives , 1,486 non-relatives In group quarters: 513
Size of family households: 6,431 2-persons , 4,050 3-persons , 2,668 4-persons , 1,048 5-persons , 647 6-persons , 217 7-or-more-persons .
Size of nonfamily households: 8,000 1-person , 1,426 2-persons , 167 3-persons , 29 4-persons .
7,186 married couples with children. single-parent households (974 men , 4,660 women ).
94.1% of residents of Midwest City speak English at home. of residents speak Spanish at home (70% speak English very well , 15% speak English well , 13% speak English not well , 2% don't speak English at all ).of residents speak other Indo-European language at home (91% speak English very well , 6% speak English well , 3% speak English not well ).of residents speak Asian or Pacific Island language at home (66% speak English very well , 30% speak English well , 4% speak English not well ).of residents speak other language at home (83% speak English very well , 14% speak English well , 3% speak English not well ).
Foreign born population: 2,058 (3.5%)of them are naturalized citizens )
Median number of rooms in houses and condos:
Median number of rooms in apartments
Owner-occupied Renter-occupied
Rooms in owner-occupied houses in Midwest City, Oklahoma
39 1 room 0 2 rooms 58 3 rooms 1,073 4 rooms 4,054 5 rooms 4,078 6 rooms 2,311 7 rooms 1,162 8 rooms 1,049 9+ rooms
Rooms in renter-occupied apartments in Midwest City, Oklahoma
159 1 room 189 2 rooms 1,798 3 rooms 2,332 4 rooms 3,178 5 rooms 1,834 6 rooms 880 7 rooms 312 8 rooms 170 9+ rooms
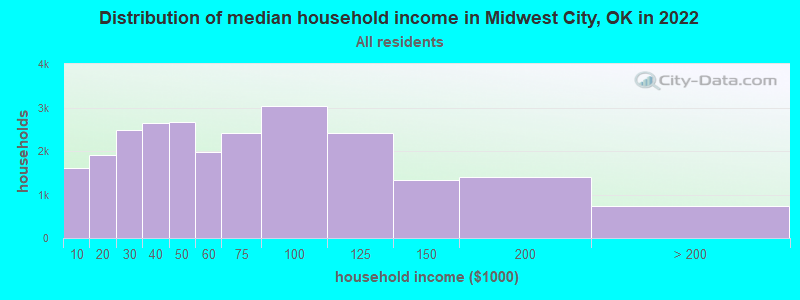
Midwest City, OK household income distribution 1,607 Less than $10,0001,903 $10,000 to $19,9992,485 $20,000 to $29,9992,633 $30,000 to $39,9992,657 $40,000 to $49,9991,970 $50,000 to $59,9992,416 $60,000 to $74,9993,037 $75,000 to $99,9992,408 $100,000 to $124,9991,328 $125,000 to $149,9991,411 $150,000 to $199,999745 $200,000 or more
Home value of owner - occupied houses in 2022 in Midwest City, OK 201 Less than $10,000115 $10,000 to $14,999156 $15,000 to $19,99976 $20,000 to $24,99925 $25,000 to $29,99917 $30,000 to $34,9997 $35,000 to $39,999103 $40,000 to $49,999122 $50,000 to $59,999331 $60,000 to $69,999322 $70,000 to $79,999497 $80,000 to $89,999454 $90,000 to $99,9991,834 $100,000 to $124,9991,056 $125,000 to $149,9991,537 $150,000 to $174,999954 $175,000 to $199,9992,197 $200,000 to $249,9991,120 $250,000 to $299,999734 $300,000 to $399,999340 $400,000 to $499,999268 $500,000 to $749,99983 $750,000 to $999,99916 $1,000,000 to $1,499,99911 $1,500,000 to $1,999,99923 $2,000,000 or moreRent paid by renters in 2022 in Midwest City, OK 106 Less than $10017 $100 to $149181 $150 to $199268 $200 to $24964 $250 to $29953 $300 to $34950 $350 to $399129 $400 to $449210 $450 to $499209 $500 to $549581 $550 to $599495 $600 to $649705 $650 to $6991,266 $700 to $7491,023 $750 to $7991,699 $800 to $8991,038 $900 to $9991,450 $1,000 to $1,249785 $1,250 to $1,499166 $1,500 to $1,9990 $2,000 to $2,49977 $3,500 or more369 No cash rent
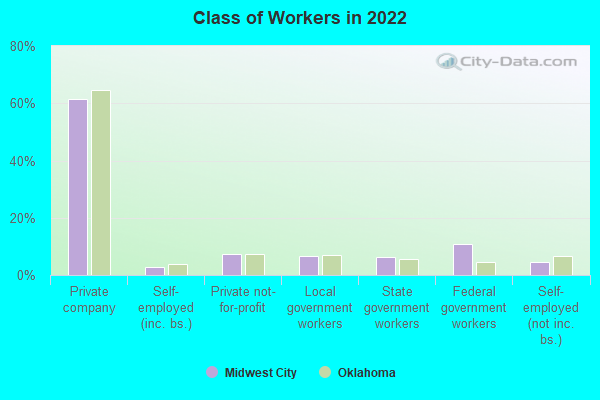
Percentage of workers working in this county: 93.8%Number of people working at home: 2,873 (10.9% of all workers )
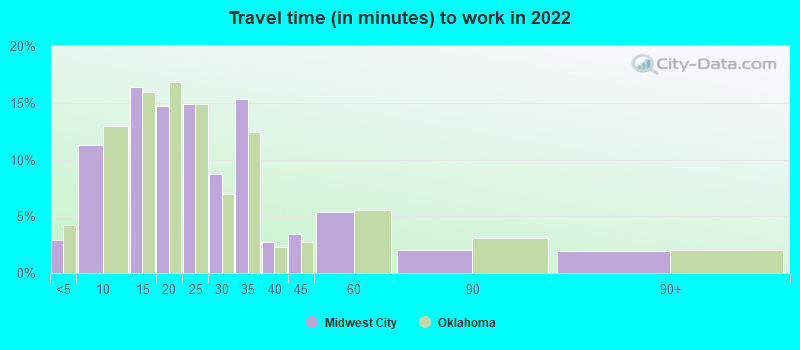
Travel time to work (commute)
Less than 5 minutes: 6375 to 9 minutes: 2,31010 to 14 minutes: 3,30815 to 19 minutes: 4,08520 to 24 minutes: 3,87125 to 29 minutes: 2,12230 to 34 minutes: 4,13835 to 39 minutes: 59040 to 44 minutes: 83745 to 59 minutes: 78360 to 89 minutes: 36690 or more minutes: 390
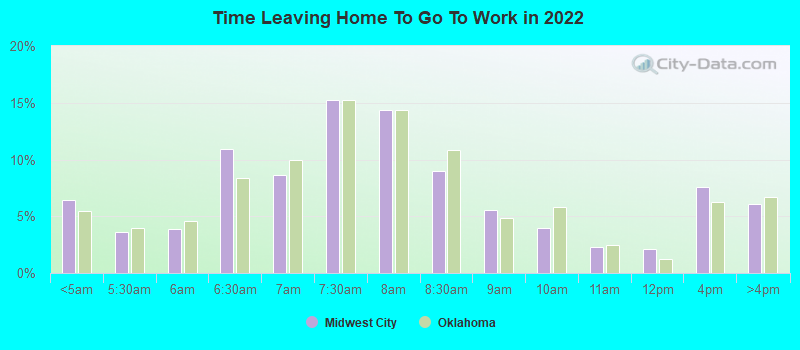
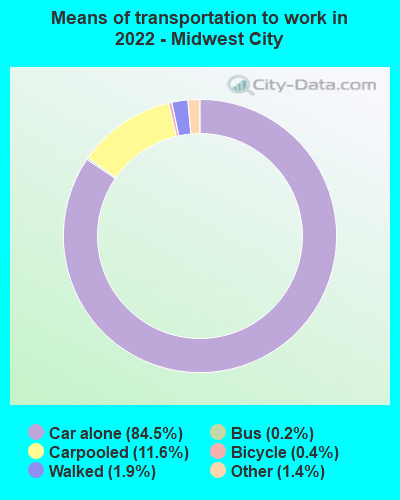
Means of transportation to work:
Drove a car alone: 14,260 (73.3%)Carpooled: 2,007 (10.3%)Bus : 27 (0.1%)Taxi: 248 (1.3%)Bicycle: 57 (0.3%)Walked: 320 (1.6%)Worked at home: 2,873 (14.8%)
Unemployment by race in 2022
Unemployment rate for White non-Hispanic residents 5.4% Males7.0% FemalesUnemployment rate for Black residents 11.3% Males5.3% FemalesUnemployment rate for American Indian and Alaska Native residents 24.3% Males5.0% FemalesUnemployment rate for other race residents 6.0% Males10.9% FemalesUnemployment rate for two or more race residents 2.7% Males2.6% FemalesUnemployment rate for Hispanic or Latino residents 5.2% Males6.3% Females
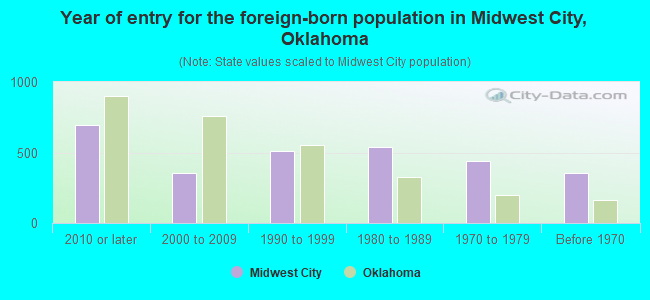
Year of entry for the foreign-born population in Midwest City, Oklahoma
698 2010 or later 358 2000 to 2009 514 1990 to 1999 536 1980 to 1989 442 1970 to 1979 357 Before 1970
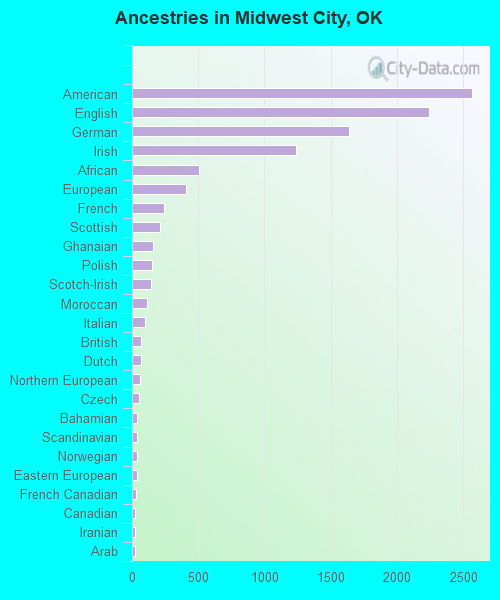
First ancestries reported:
American: 2,567 (8.4%)
English: 2,239 (7.3%)
German: 1,636 (5.4%)
Irish: 1,239 (4.1%)
African: 506 (1.7%)
European: 407 (1.3%)
French: 240 (0.8%)
Scottish: 213 (0.7%)
Ghanaian: 155 (0.5%)
Polish: 154 (0.5%)
Scotch-Irish: 145 (0.5%)
Moroccan: 114 (0.4%)
Italian: 96 (0.3%)
British: 68 (0.2%)
Dutch: 66 (0.2%)
Northern European: 59 (0.2%)
Czech: 54 (0.2%)
Bahamian: 40 (0.1%)
Scandinavian: 37 (0.1%)
Norwegian: 34 (0.1%)
Eastern European: 34 (0.1%)
French Canadian: 33 (0.1%)
Canadian: 26 (0.09%)
Iranian: 26 (0.09%)
Arab: 25 (0.08%)
Czechoslovakian: 22 (0.07%)
Danish: 16 (0.05%)
Lithuanian: 16 (0.05%)
Portuguese: 16 (0.05%)
Swedish: 14 (0.05%)
Cape Verdean: 13 (0.04%)
Belgian: 11 (0.04%)
Nigerian: 8 (0.03%)
Pennsylvania German: 7 (0.02%)
Dutch West Indian: 6 (0.02%)
Welsh: 5 (0.02%)
Hungarian: 4 (0.01%) Most common places of birth for foreign-born residents (%): Mexico Midwest City:
26.9% (548)Oklahoma:
42.4% (103,425)
Philippines Midwest City:
11.2% (228)Oklahoma:
2.3% (5,671)
Morocco Midwest City:
8.3% (169)Oklahoma:
0.2% (480)
Canada Midwest City:
6.7% (137)Oklahoma:
2.0% (4,771)
Vietnam Midwest City:
4.3% (88)Oklahoma:
5.6% (13,699)
Ghana Midwest City:
4.2% (85)Oklahoma:
0.5% (1,202)
Germany Midwest City:
2.2% (44)Oklahoma:
2.3% (5,498)
China, excluding Hong Kong and Taiwan Midwest City:
2.0% (41)Oklahoma:
3.2% (7,698)
Bahamas Midwest City:
2.0% (41)Oklahoma:
0.1% (277)
Korea Midwest City:
1.9% (39)Oklahoma:
1.7% (4,140)
United Kingdom, excluding England and Scotland Midwest City:
1.9% (38)Oklahoma:
0.5% (1,194)
Iran Midwest City:
1.9% (38)Oklahoma:
0.9% (2,098)
Peru Midwest City:
1.8% (37)Oklahoma:
0.5% (1,321)
Saudi Arabia Midwest City:
1.8% (37)Oklahoma:
0.3% (829)
Pakistan Midwest City:
1.7% (35)Oklahoma:
0.8% (1,923)
Jamaica Midwest City:
1.5% (31)Oklahoma:
0.4% (997)
Place of birth for U.S.-born residents:
This state: 36,862Other state: 18,765Northeast: 1,305Midwest: 4,654South: 7,723West: 5,085 82.9% of Midwest City residents lived in the same house 1 years ago.
Out of people who lived in different houses, 39.5% lived in this county.
Out of people who lived in different counties, 50.5% lived in Oklahoma.
Midwest City:
82.9%State average:
85.5%
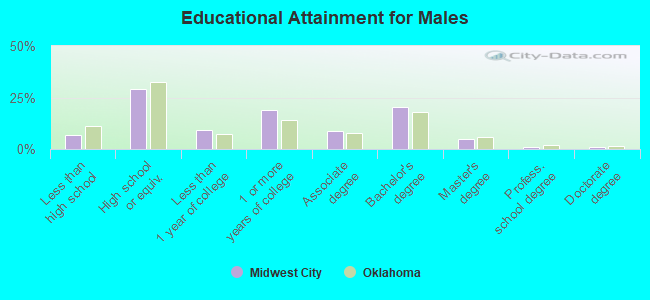
Education attainment for males 25 years and older:
No schooling: 209Nursery to 4th grade: 85th and 6th grade: 1027th and 8th grade: 869th grade: 9210th grade: 14011th grade: 26812th grade, no diploma: 267High school graduate (or equivalency): 5,040Less than 1 year of college: 1,623Some college more than 1 year, no degree: 3,318Associate degree: 1,527Bachelor's degree: 3,558Master's degree: 823Professional school degree: 136Doctorate degree: 140
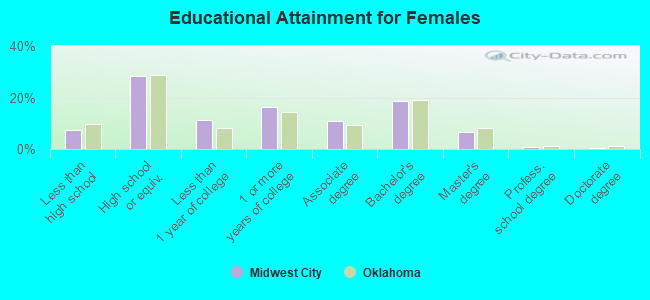
Education attainment for females 25 years and older:
No schooling: 131Nursery to 4th grade: 75th and 6th grade: 627th and 8th grade: 1149th grade: 15510th grade: 28911th grade: 29612th grade, no diploma: 520High school graduate (or equivalency): 5,898Less than 1 year of college: 2,337Some college more than 1 year, no degree: 3,404Associate degree: 2,299Bachelor's degree: 3,888Master's degree: 1,351Professional school degree: 132Doctorate degree: 55
Housing units in structures:
One, detached: 20,210One, attached: 901Two: 3303 or 4: 5775 to 9: 1,64110 to 19: 1,25720 to 49: 61250 or more: 948Mobile homes: 592Median worth of mobile homes: $31,389
Housing units lacking complete plumbing facilities in 2022: 0.7%Housing units lacking complete kitchen facilities in 2022: 2.3%House/condo owner moved in on average 13 years ago
Renter moved in on average 3 years ago
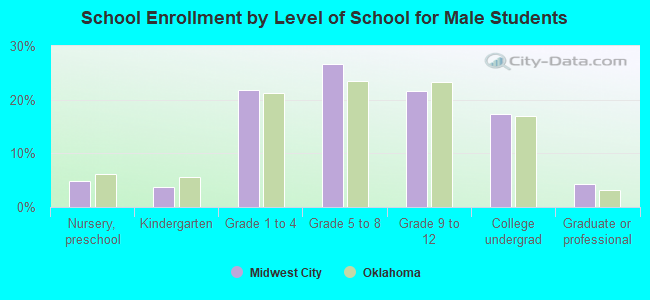
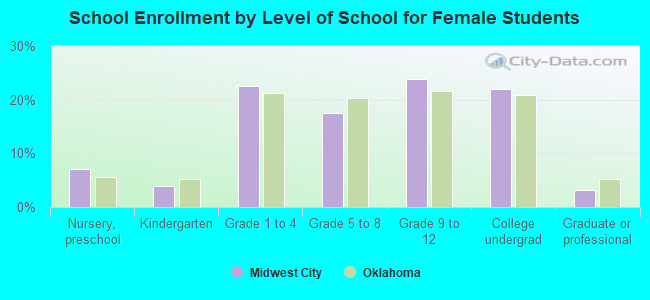
Private vs. public school enrollment:
Students in private schools in grades 1 to 8 (elementary and middle school): 592 Students in private schools in grades 9 to 12 (high school): 244 Students in private undergraduate colleges: 620