Middleburg Heights, OH (Ohio) Houses and Residents
| Middleburg Heights: | $221,757 |
| Ohio: | $204,100 |
Mean price in 2022:
Detached houses: $242,042
Here: $242,042 State: $254,366 Townhouses or other attached units: $148,666
Here: $148,666 State: $225,733 In 2-unit structures: $105,162
Here: $105,162 State: $144,384 In 3-to-4-unit structures: $134,775
Here: $134,775 State: $203,002 In 5-or-more-unit structures: $93,697
Here: $93,697 State: $211,593
Total population: 15,751 (Urban population: 15,542, Rural population: 0)
Houses: 7,640 (7,464 occupied: 5,191 owner occupied, 2,316 renter occupied)
| % of renters here: | 31% |
| State: | 33% |
Housing density: 946 houses/condos per square mile
Median price asked for vacant for-sale houses and condos in 2022: $1,759,923.
Median contract rent in 2022: $906 (lower quartile is $809, upper quartile is $1,218)
Median rent asked for vacant for-rent units in 2022: $1,161
Median gross rent in Middleburg Heights, OH in 2022: $1,008
Housing units in Middleburg Heights with a mortgage: 2,904 (416 second mortgage, 16 home equity loan, 368 both second mortgage and home equity loan)
Houses without a mortgage: 275
Median household income for houses/condos with a mortgage: $90,752
Median household income for apartments without a mortgage: $61,078
Median monthly housing costs: $999
Compare current foreclosures near Middleburg Heights, OH:
| Photo | Address | Area | Beds / Baths | Price | Details |
|---|---|---|---|---|---|

|
#1
Denison Ave
Elyria, OH 44035
|
875 sq. feet
|
1 baths 3 beds |
$149,900
|
show details |

|
#2
E 134th St
Cleveland, OH 44105
|
1,549 sq. feet
|
1 baths 3 beds |
$129,900
|
show details |

|
#3
Greenfield Ct
Berea, OH 44017
|
840 sq. feet
|
1 baths 2 beds |
$144,500
|
show details |

|
#4
E 128th St
Cleveland, OH 44120
|
1,894 sq. feet
|
1 baths 4 beds |
$44,900
|
show details |

|
#5
Ashland Dr
Brook Park, OH 44142
|
888 sq. feet
|
1 baths 3 beds |
$214,500
|
show details |

|
#6
Westgrove Ct
Medina, OH 44256
|
1,688 sq. feet
|
2 baths 3 beds |
$274,900
|
show details |

|
#7
Sugar Ridge Rd
North Ridgeville, OH 44039
|
1,823 sq. feet
|
2 baths 4 beds |
$354,900
|
show details |

|
#8
E 128th St
Cleveland, OH 44120
|
2,590 sq. feet
|
3 baths 5 beds |
$22,500
|
show details |

|
#9
E 147th St
Cleveland, OH 44120
|
2,360 sq. feet
|
3 baths 5 beds |
$22,500
|
show details |

|
#10
Maryland Ave
Cleveland, OH 44105
|
1,908 sq. feet
|
2 baths 4 beds |
$29,900
|
show details |
| Photo | Address | Area | Beds / Baths | Price | Details |
|---|---|---|---|---|---|

|
#11
E 97th St
Cleveland, OH 44105
|
- sq. feet
|
1 baths 5 beds |
$62,400
|
show details |

|
#12
Van Aken Blvd Apt 207
Beachwood, OH 44122
|
798 sq. feet
|
1 baths 2 beds |
show details | |

|
#13
Daleford Rd
Cleveland, OH 44120
|
3,164 sq. feet
|
3 baths 6 beds |
show details | |

|
#14
E 176th St
Cleveland, OH 44128
|
722 sq. feet
|
1 baths 2 beds |
show details | |

|
#15
E 79th St
Cleveland, OH 44103
|
1,744 sq. feet
|
1 baths 4 beds |
show details | |

|
#16
Glenbury Ave
Lakewood, OH 44107
|
1,978 sq. feet
|
2 baths 4 beds |
show details | |

|
#17
Ennis Ave
Bedford, OH 44146
|
1,321 sq. feet
|
1 baths 4 beds |
show details | |

|
#18
Stockbridge Ave
Cleveland, OH 44128
|
1,466 sq. feet
|
2 baths 3 beds |
show details | |

|
#19
W 30th St
Cleveland, OH 44109
|
1,552 sq. feet
|
1 baths 3 beds |
show details | |

|
#20
Tate Ave
Cleveland, OH 44109
|
1,548 sq. feet
|
2 baths 4 beds |
show details |
| Photo | Address | Area | Beds / Baths | Price | Details |
|---|---|---|---|---|---|

|
#21
Bayes Ave
Lakewood, OH 44107
|
1,224 sq. feet
|
1 baths 2 beds |
show details | |

|
#22
W 104th St
Cleveland, OH 44111
|
971 sq. feet
|
2 baths 2 beds |
show details | |

|
#23
Berkshire Rd
Elyria, OH 44035
|
1,260 sq. feet
|
2 baths 3 beds |
show details | |

|
#24
Delaware Dr
Cleveland, OH 44106
|
2,272 sq. feet
|
4 baths 4 beds |
show details | |

|
#25
W 90th St
Cleveland, OH 44102
|
1,196 sq. feet
|
1 baths 3 beds |
show details | |

|
#26
E Dartmoor Ave
Independence, OH 44131
|
1,828 sq. feet
|
2 baths 3 beds |
show details | |

|
#27
Lincoln Ave
Lakewood, OH 44107
|
2,306 sq. feet
|
2 baths 4 beds |
show details | |

|
#28
Hilliard Blvd
Rocky River, OH 44116
|
1,969 sq. feet
|
3 baths 3 beds |
show details | |

|
#29
Glendale Ave
Cleveland, OH 44128
|
1,316 sq. feet
|
2 baths 3 beds |
show details | |

|
#30
Eldred Ave
Bedford, OH 44146
|
1,260 sq. feet
|
2 baths 4 beds |
show details |
| Photo | Address | Area | Beds / Baths | Price | Details |
|---|---|---|---|---|---|

|
#31
Lexington Ave
Elyria, OH 44035
|
977 sq. feet
|
1 baths 2 beds |
show details | |

|
#32
Edgepark Dr
North Olmsted, OH 44070
|
2,234 sq. feet
|
2 baths 4 beds |
show details | |

|
#33
Elbur Ave
Lakewood, OH 44107
|
1,462 sq. feet
|
1 baths 3 beds |
show details | |

|
#34
Chestnut Rd
Independence, OH 44131
|
1,784 sq. feet
|
2 baths 4 beds |
show details | |

|
#35
Delaware Ave
Elyria, OH 44035
|
768 sq. feet
|
1 baths 3 beds |
show details | |

|
#36
Morningside Dr
Cleveland, OH 44109
|
1,301 sq. feet
|
2 baths 3 beds |
show details | |

|
#37
Salinas Dr
Avon, OH 44011
|
2,136 sq. feet
|
3 baths 3 beds |
show details | |

|
#38
Dover Center Rd
North Olmsted, OH 44070
|
2,580 sq. feet
|
3 baths 4 beds |
show details | |

|
#39
Tampa Ave
Cleveland, OH 44109
|
1,265 sq. feet
|
1 baths 3 beds |
show details | |

|
#40
Leyton Rd
Bedford, OH 44146
|
1,210 sq. feet
|
3 baths 3 beds |
show details |
| Photo | Address | Area | Beds / Baths | Price | Details |
|---|---|---|---|---|---|

|
#41
Center Rd
Bedford, OH 44146
|
2,564 sq. feet
|
3 baths 5 beds |
show details | |

|
#42
Eldamere Ave
Cleveland, OH 44128
|
1,326 sq. feet
|
2 baths 3 beds |
show details | |

|
#43
Woodbury Rd
Cleveland, OH 44120
|
2,058 sq. feet
|
2 baths 4 beds |
show details | |

|
#44
Willet Cir
North Olmsted, OH 44070
|
1,762 sq. feet
|
3 baths 4 beds |
show details | |

|
#45
Denison Ave
Cleveland, OH 44102
|
1,816 sq. feet
|
2 baths 3 beds |
show details | |

|
#46
Throckley Ave
Cleveland, OH 44128
|
1,248 sq. feet
|
2 baths 3 beds |
show details | |

|
#47
Cypress Ave
Cleveland, OH 44109
|
2,208 sq. feet
|
2 baths 4 beds |
show details | |

|
#48
Mountville Dr
Maple Heights, OH 44137
|
1,175 sq. feet
|
2 baths 3 beds |
show details | |

|
#49
Clarence Ave
Lakewood, OH 44107
|
1,360 sq. feet
|
1 baths 3 beds |
show details | |

|
Check over 1 million property listings on Foreclosure.com!
|
browse all offers | |||


 | Need guidance to find apartments where Indians (Bhartiya) do live (6 replies) |
| How to attract more young educated people? (139 replies) |
| Best Brewery in Cleveland (22 replies) |
| Townhomes in Berea (18 replies) |
| Moving to Cleveland from Tampa (6 replies) |
| suburban West Side equivalents of suburban East Side areas (57 replies) |

Median year apartment built: 1973
Household type by relationship:
Households: 15,657- Male householders: 3,814 (1,324 living alone), Female householders: 3,537 (1,743 living alone)
3,269 spouses (3,233 opposite-sex spouses), 383 unmarried partners, (372 opposite-sex unmarried partners), 3,351 children (3,287 natural, 46 adopted, 17 stepchildren), 207 grandchildren, 122 brothers or sisters, 113 parents, 4 foster children, 230 other relatives, 202 non-relatives
- In group quarters: 420
Size of family households: 2,002 2-persons, 1,004 3-persons, 732 4-persons, 153 5-persons, 107 6-persons, 15 7-or-more-persons.
Size of nonfamily households: 3,090 1-person, 360 2-persons, 23 3-persons, 12 4-persons.
1,687 married couples with children.
531 single-parent households (202 men, 329 women).
83.1% of residents of Middleburg Heights speak English at home.
3.3% of residents speak Spanish at home (81% speak English very well, 19% speak English well).
9.2% of residents speak other Indo-European language at home (67% speak English very well, 28% speak English well, 4% speak English not well).
3.5% of residents speak Asian or Pacific Island language at home (60% speak English very well, 35% speak English well, 5% speak English not well).
1.6% of residents speak other language at home (57% speak English very well, 38% speak English well, 6% speak English not well).
Foreign born population: 2,321 (14.8%)
(51.5% of them are naturalized citizens)
| Here: | 6.8 |
| State: | 6.7 |
| Here: | 4.0 |
| State: | 4.4 |

- Bedrooms in owner-occupied houses and condos in Middleburg Heights, Ohio
- 0no bedroom
- 121 bedroom
- 8692 bedrooms
- 3,0133 bedrooms
- 1,0974 bedrooms
- 2015+ bedrooms

- Bedrooms in renter-occupied apartments in Middleburg Heights, Ohio
- 107no bedroom
- 9341 bedroom
- 1,0732 bedrooms
- 1073 bedrooms
- 824 bedrooms
- 125+ bedrooms

- Cars and other vehicles available in Middleburg Heights in owner-occupied houses/condos
- 133no vehicle
- 1,9171 vehicle
- 2,1312 vehicles
- 6233 vehicles
- 3414 vehicles
- 485+ vehicles

- Cars and other vehicles available in Middleburg Heights in renter-occupied apartments
- 131no vehicle
- 1,7641 vehicle
- 3582 vehicles
- 593 vehicles
- 54 vehicles
- 05+ vehicles

- Rooms in owner-occupied houses in Middleburg Heights, Ohio
- 01 room
- 02 rooms
- 543 rooms
- 3714 rooms
- 7545 rooms
- 1,1016 rooms
- 1,0617 rooms
- 9528 rooms
- 8989+ rooms

- Rooms in renter-occupied apartments in Middleburg Heights, Ohio
- 1071 room
- 1122 rooms
- 5183 rooms
- 7654 rooms
- 5385 rooms
- 1566 rooms
- 237 rooms
- 398 rooms
- 589+ rooms


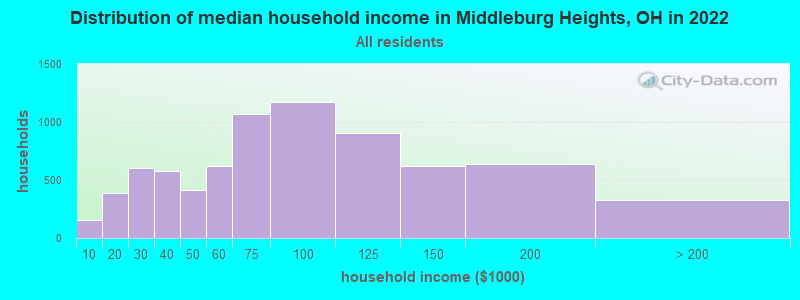
Middleburg Heights, OH household income distribution

- 152Less than $10,000
- 390$10,000 to $19,999
- 604$20,000 to $29,999
- 579$30,000 to $39,999
- 417$40,000 to $49,999
- 621$50,000 to $59,999
- 1,065$60,000 to $74,999
- 1,174$75,000 to $99,999
- 901$100,000 to $124,999
- 621$125,000 to $149,999
- 640$150,000 to $199,999
- 327$200,000 or more
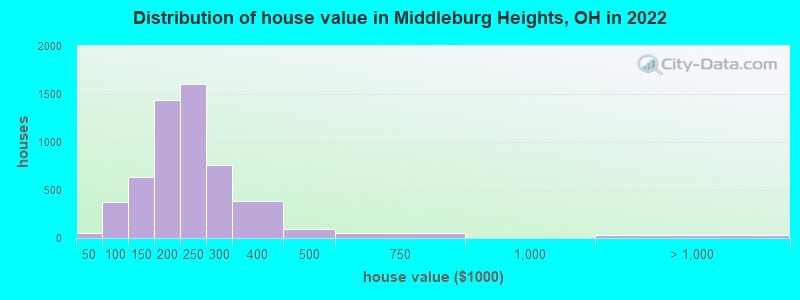
Home value of owner - occupied houses in 2022 in Middleburg Heights, OH
-
- 14Less than $10,000
- 27$15,000 to $19,999
- 5$20,000 to $24,999
- 1$35,000 to $39,999
- 30$50,000 to $59,999
- 88$60,000 to $69,999
- 60$70,000 to $79,999
- 153$80,000 to $89,999
- 37$90,000 to $99,999
- 268$100,000 to $124,999
- 362$125,000 to $149,999
- 589$150,000 to $174,999
- 851$175,000 to $199,999
- 1,604$200,000 to $249,999
- 759$250,000 to $299,999
- 386$300,000 to $399,999
- 91$400,000 to $499,999
- 53$500,000 to $749,999
- 24$1,000,000 to $1,499,999
- 6$1,500,000 to $1,999,999
Rent paid by renters in 2022 in Middleburg Heights, OH
-
- 3$250 to $299
- 7$300 to $349
- 8$500 to $549
- 19$550 to $599
- 92$600 to $649
- 95$650 to $699
- 106$700 to $749
- 289$750 to $799
- 420$800 to $899
- 193$900 to $999
- 562$1,000 to $1,249
- 294$1,250 to $1,499
- 90$1,500 to $1,999
- 10$2,000 to $2,499
- 10$2,500 to $2,999
- 15$3,000 to $3,499
- 72No cash rent


Percentage of workers working in this county: 91.5%
Number of people working at home: 1,041 (13.3% of all workers)
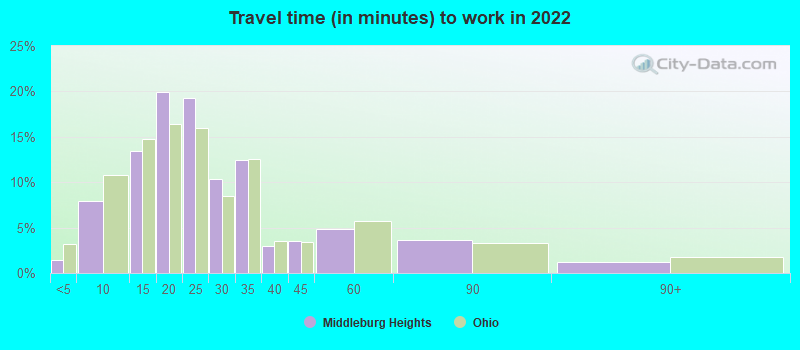
Travel time to work (commute)
- Less than 5 minutes: 55
- 5 to 9 minutes: 770
- 10 to 14 minutes: 1,051
- 15 to 19 minutes: 930
- 20 to 24 minutes: 1,393
- 25 to 29 minutes: 804
- 30 to 34 minutes: 886
- 35 to 39 minutes: 239
- 40 to 44 minutes: 106
- 45 to 59 minutes: 359
- 60 to 89 minutes: 108
- 90 or more minutes: 27
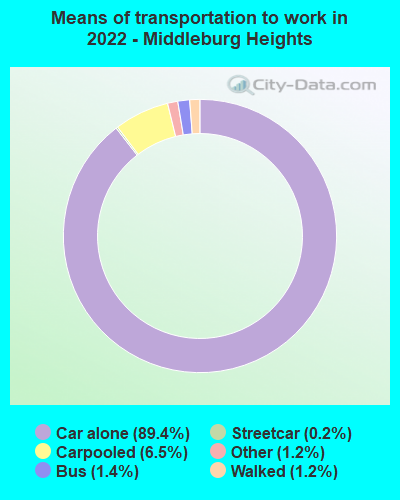
Means of transportation to work:
- Drove a car alone: 14,672 (81.6%)
- Carpooled: 1,082 (6.0%)
- Bus: 204 (1.1%)
- Subway or elevated rail: 40 (0.2%)
- Taxi: 203 (1.1%)
- Bicycle: 16 (0.1%)
- Walked: 231 (1.3%)
- Worked at home: 1,041 (5.8%)

- Unemployment by race in 2022
- Unemployment rate for White non-Hispanic residents
- 0.4%Males
- 1.7%Females
- Unemployment rate for two or more race residents
- 3.6%Males
- 5.3%Females
- Unemployment rate for Hispanic or Latino residents
- 1.1%Males
- 6.3%Females

- Year of entry for the foreign-born population in Middleburg Heights, Ohio
- 1,3232010 or later
- 3392000 to 2009
- 1871990 to 1999
- 1681980 to 1989
- 2261970 to 1979
- 736Before 1970

First ancestries reported:
- Polish: 769 (11.0%)
- Italian: 723 (10.4%)
- German: 692 (9.9%)
- Irish: 380 (5.4%)
- Hungarian: 358 (5.1%)
- American: 321 (4.6%)
- Slovak: 204 (2.9%)
- English: 185 (2.7%)
- Slovene: 177 (2.5%)
- European: 106 (1.5%)
- Greek: 106 (1.5%)
- Ukrainian: 96 (1.4%)
- Romanian: 88 (1.3%)
- Croatian: 62 (0.9%)
- Scottish: 51 (0.7%)
- Arab: 38 (0.5%)
- Swiss: 30 (0.4%)
- Austrian: 29 (0.4%)
- French: 26 (0.4%)
- Russian: 25 (0.4%)
- Albanian: 24 (0.3%)
- Slavic: 24 (0.3%)
- Eastern European: 21 (0.3%)
- Czechoslovakian: 20 (0.3%)
- Yugoslavian: 13 (0.2%)
- Lithuanian: 12 (0.2%)
- Lebanese: 11 (0.2%)
- Serbian: 11 (0.2%)
- Scotch-Irish: 9 (0.1%)
- Canadian: 5 (0.07%)
- Scandinavian: 4 (0.06%)
- Welsh: 3 (0.04%)
- Armenian: 2 (0.03%)
Most common places of birth for foreign-born residents (%):
| Middleburg Heights: | 39.9% (960) |
| Ohio: | 11.6% (66,525) |
| Middleburg Heights: | 5.1% (122) |
| Ohio: | 1.2% (6,679) |
| Middleburg Heights: | 4.9% (117) |
| Ohio: | 7.8% (44,796) |
| Middleburg Heights: | 4.8% (115) |
| Ohio: | 0.4% (2,186) |
| Middleburg Heights: | 4.1% (98) |
| Ohio: | 0.2% (1,250) |
| Middleburg Heights: | 3.9% (95) |
| Ohio: | 1.1% (6,346) |
| Middleburg Heights: | 3.7% (90) |
| Ohio: | 1.9% (10,960) |
| Middleburg Heights: | 2.9% (71) |
| Ohio: | 0.5% (2,620) |
| Middleburg Heights: | 2.9% (70) |
| Ohio: | 0.4% (2,140) |
| Middleburg Heights: | 2.5% (61) |
| Ohio: | 0.1% (362) |
| Middleburg Heights: | 1.7% (42) |
| Ohio: | 2.6% (14,988) |
| Middleburg Heights: | 1.7% (42) |
| Ohio: | 0.3% (1,875) |
Place of birth for U.S.-born residents:
- This state: 11,204
- Other state: 1,978
- Northeast: 714
- Midwest: 259
- South: 781
- West: 221
89.0% of Middleburg Heights residents lived in the same house 1 years ago.
Out of people who lived in different houses, 38.7% lived in this county.
Out of people who lived in different counties, 32.2% lived in Ohio.
| Middleburg Heights: | 89.0% |
| State average: | 87.8% |
Education attainment for males 25 years and older:
- No schooling: 49
- Nursery to 4th grade: 0
- 5th and 6th grade: 10
- 7th and 8th grade: 31
- 9th grade: 68
- 10th grade: 173
- 11th grade: 74
- 12th grade, no diploma: 106
- High school graduate (or equivalency): 1,607
- Less than 1 year of college: 328
- Some college more than 1 year, no degree: 516
- Associate degree: 666
- Bachelor's degree: 1,597
- Master's degree: 549
- Professional school degree: 98
- Doctorate degree: 140

Education attainment for females 25 years and older:
- No schooling: 81
- Nursery to 4th grade: 0
- 5th and 6th grade: 20
- 7th and 8th grade: 60
- 9th grade: 24
- 10th grade: 34
- 11th grade: 44
- 12th grade, no diploma: 94
- High school graduate (or equivalency): 1,737
- Less than 1 year of college: 455
- Some college more than 1 year, no degree: 856
- Associate degree: 695
- Bachelor's degree: 1,250
- Master's degree: 883
- Professional school degree: 60
- Doctorate degree: 42


Housing units in structures:
- One, detached: 4,355
- One, attached: 860
- Two: 149
- 3 or 4: 159
- 5 to 9: 436
- 10 to 19: 1,405
- 20 to 49: 72
- 50 or more: 186
- Mobile homes: 12
Housing units lacking complete kitchen facilities in 2022: 1.1%
House/condo owner moved in on average 12 years ago
Renter moved in on average 5 years ago

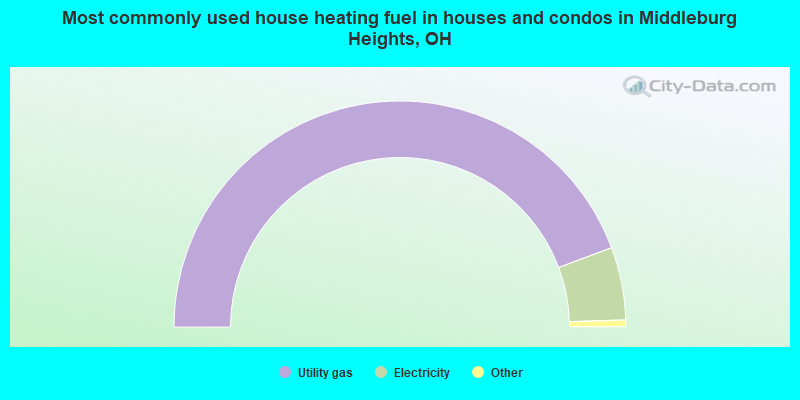
- 88.6%Utility gas
- 10.4%Electricity
- 0.5%Bottled, tank, or LP gas
- 0.3%No fuel used
- 0.2%Other fuel
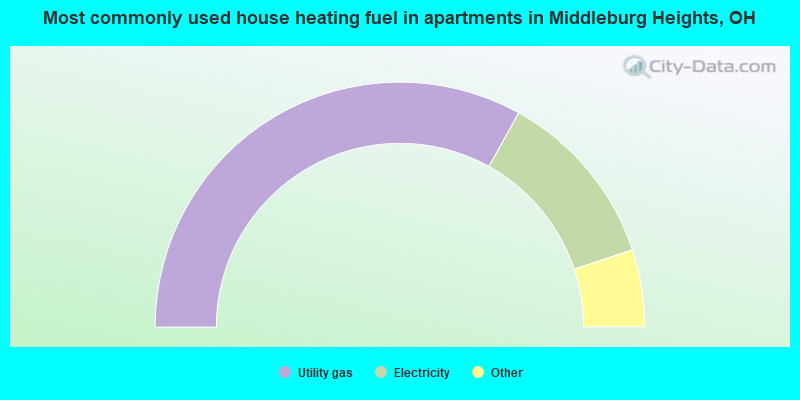
- 66.2%Utility gas
- 23.7%Electricity
- 3.6%No fuel used
- 3.6%Other fuel
- 3.0%Bottled, tank, or LP gas
Private vs. public school enrollment:
| Here: | 10.9% |
| Ohio: | 16.0% |
| Here: | 23.3% |
| Ohio: | 13.1% |
| Here: | 35.2% |
| Ohio: | 22.3% |


