Mendota Heights, MN (Minnesota) Houses and Residents
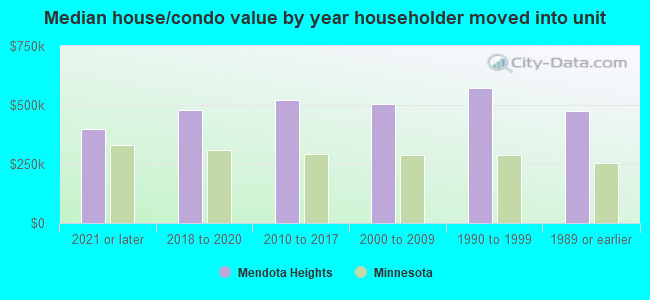
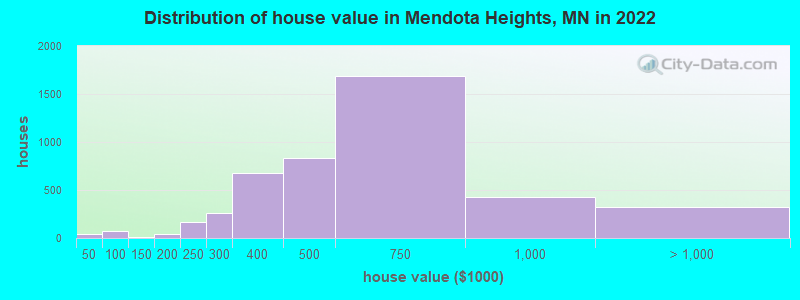
| Mendota Heights: | $511,095 |
| Minnesota: | $314,600 |
Total population: 11,222 (All urban)
Houses: 5,030 (4,875 occupied: 4,036 owner occupied, 859 renter occupied)
| % of renters here: | 18% |
| State: | 28% |
Housing density: 538 houses/condos per square mile
Median price asked for vacant for-sale houses and condos in 2022: $968,399.
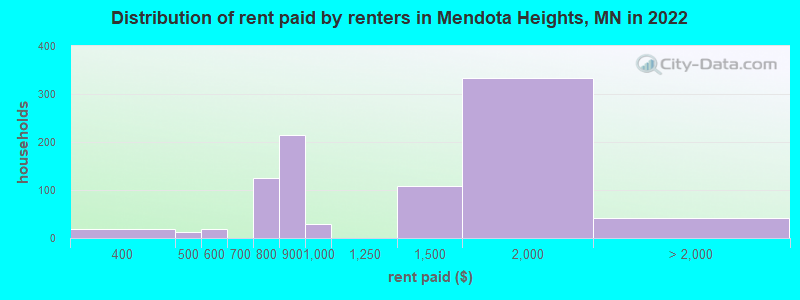
Median contract rent in 2022: $993 (lower quartile is $827, upper quartile is $1,710)
Median rent asked for vacant for-rent units in 2022: $4,684
Median gross rent in Mendota Heights, MN in 2022: $1,311
Housing units in Mendota Heights with a mortgage: 2,425 (438 second mortgage, 0 home equity loan, 356 both second mortgage and home equity loan)
Houses without a mortgage: 71
Median household income for houses/condos with a mortgage: $169,921
Median household income for apartments without a mortgage: $116,186
Median monthly housing costs: $1,642
Compare current foreclosures near Mendota Heights, MN:
| Photo | Address | Area | Beds / Baths | Price | Details |
|---|---|---|---|---|---|

|
#1
76th Street E. Unit
Inver Grove Heights, MN 55076
|
1,048 sq. feet
|
2 baths 2 beds |
$219,900
|
show details |

|
#2
York Ave S Apt 122
Minneapolis, MN 55435
|
956 sq. feet
|
1 baths 1 beds |
$157,000
|
show details |

|
#3
1st Ave S
Minneapolis, MN 55408
|
1,932 sq. feet
|
2 baths 3 beds |
$354,900
|
show details |

|
#4
Charles Ave
Saint Paul, MN 55103
|
906 sq. feet
|
1 baths 2 beds |
$224,500
|
show details |

|
#5
English Ave
Farmington, MN 55024
|
1,440 sq. feet
|
3 baths 2 beds |
$254,900
|
show details |

|
#6
26th Ave S
Minneapolis, MN 55406
|
1,232 sq. feet
|
1 baths 2 beds |
$309,900
|
show details |

|
#7
Granite St
Saint Paul, MN 55117
|
2,136 sq. feet
|
2 baths 4 beds |
$172,000
|
show details |

|
#8
Maple Island Rd
Burnsville, MN 55306
|
1,302 sq. feet
|
2 baths 2 beds |
$294,900
|
show details |

|
#9
Groveland Ave Apt 1708
Minneapolis, MN 55403
|
739 sq. feet
|
1 baths 1 beds |
$98,000
|
show details |

|
#10
Bedford Ave
Minneapolis, MN 55436
|
1,726 sq. feet
|
1 baths 3 beds |
$299,900
|
show details |
| Photo | Address | Area | Beds / Baths | Price | Details |
|---|---|---|---|---|---|

|
#11
W 44th St Apt 7
Minneapolis, MN 55410
|
710 sq. feet
|
1 baths 2 beds |
$154,900
|
show details |

|
#12
Parklawn Ave Apt 109
Minneapolis, MN 55435
|
1,121 sq. feet
|
2 baths 2 beds |
$105,000
|
show details |

|
#13
Wacouta St Unit Unit Gl-D
Saint Paul, MN 55101
|
- sq. feet
|
1 baths 1 beds |
$179,900
|
show details |

|
#14
Rice Creek Ter
Saint Paul, MN 55112
|
2,248 sq. feet
|
2 baths 4 beds |
show details | |

|
#15
1st Ave S
Minneapolis, MN 55420
|
1,200 sq. feet
|
1 baths 3 beds |
show details | |

|
#16
Salem Ave
Minneapolis, MN 55416
|
925 sq. feet
|
2 baths 2 beds |
show details | |

|
#17
County Road D W Apt 3
Saint Paul, MN 55112
|
1,504 sq. feet
|
2 baths 3 beds |
show details | |

|
#18
Knox Ave N
Minneapolis, MN 55430
|
552 sq. feet
|
1 baths 1 beds |
show details | |

|
#19
Hawthorne Ave E
Saint Paul, MN 55130
|
1,050 sq. feet
|
3 baths 3 beds |
show details | |

|
#20
Bryant Ave N
Minneapolis, MN 55430
|
1,180 sq. feet
|
1 baths 3 beds |
show details |
| Photo | Address | Area | Beds / Baths | Price | Details |
|---|---|---|---|---|---|

|
#21
Dorland Rd S
Saint Paul, MN 55119
|
1,028 sq. feet
|
2 baths 3 beds |
show details | |

|
#22
2nd Ave N
Minneapolis, MN 55405
|
1,092 sq. feet
|
1 baths 3 beds |
show details | |

|
#23
Perry Ave N
Minneapolis, MN 55422
|
1,668 sq. feet
|
2 baths 3 beds |
show details | |

|
#24
Hillwood Dr E
Saint Paul, MN 55119
|
1,429 sq. feet
|
2 baths 2 beds |
show details | |

|
#25
Portland Ave
Minneapolis, MN 55407
|
840 sq. feet
|
1 baths 2 beds |
show details | |

|
#26
35th Ave S
Minneapolis, MN 55406
|
920 sq. feet
|
2 baths 2 beds |
show details | |

|
#27
Foothill Rd S
Cottage Grove, MN 55016
|
1,585 sq. feet
|
2 baths 4 beds |
show details | |

|
#28
Logan Ave N
Minneapolis, MN 55411
|
1,708 sq. feet
|
2 baths 4 beds |
show details | |

|
#29
3rd St E
Saint Paul, MN 55106
|
1,016 sq. feet
|
1 baths 3 beds |
show details | |

|
#30
Nicollet Ave Apt 201
Burnsville, MN 55337
|
950 sq. feet
|
1 baths 2 beds |
show details |
| Photo | Address | Area | Beds / Baths | Price | Details |
|---|---|---|---|---|---|

|
#31
9th Ave S
Hopkins, MN 55343
|
1,008 sq. feet
|
2 baths 2 beds |
show details | |

|
#32
Arthur St NE
Minneapolis, MN 55432
|
1,174 sq. feet
|
2 baths 3 beds |
show details | |

|
#33
Arthur St NE
Minneapolis, MN 55432
|
1,174 sq. feet
|
2 baths 3 beds |
show details | |

|
#34
34th Pl N
Minneapolis, MN 55422
|
816 sq. feet
|
1 baths 2 beds |
show details | |

|
#35
Hallmark Ave S
Cottage Grove, MN 55016
|
1,328 sq. feet
|
1 baths 4 beds |
show details | |

|
#36
34th Pl N
Minneapolis, MN 55422
|
816 sq. feet
|
1 baths 2 beds |
show details | |

|
#37
Webster Ave
Savage, MN 55378
|
1,120 sq. feet
|
1 baths 2 beds |
show details | |

|
#38
Red Pine Cir E
Saint Paul, MN 55119
|
2,394 sq. feet
|
3 baths 4 beds |
show details | |

|
#39
Pompano Dr Apt A301
Hopkins, MN 55343
|
1,176 sq. feet
|
2 baths 2 beds |
show details | |

|
#40
Girard Ave N
Minneapolis, MN 55430
|
1,058 sq. feet
|
1 baths 2 beds |
show details |
| Photo | Address | Area | Beds / Baths | Price | Details |
|---|---|---|---|---|---|

|
#41
Thomas Ave
Saint Paul, MN 55104
|
2,111 sq. feet
|
2 baths 4 beds |
show details | |

|
#42
Edmund Ave
Saint Paul, MN 55104
|
1,882 sq. feet
|
2 baths 4 beds |
show details | |

|
#43
Hadley Ave N
Saint Paul, MN 55128
|
1,232 sq. feet
|
2 baths 4 beds |
show details | |

|
#44
Bryant Ave N
Minneapolis, MN 55430
|
1,368 sq. feet
|
1 baths 3 beds |
show details | |

|
#45
South Ave E
Saint Paul, MN 55109
|
1,578 sq. feet
|
2 baths 3 beds |
show details | |

|
#46
Grand Way Apt 332
Minneapolis, MN 55416
|
1,028 sq. feet
|
2 baths 2 beds |
show details | |

|
#47
Overton Dr NE
Minneapolis, MN 55432
|
1,286 sq. feet
|
2 baths 3 beds |
show details | |

|
#48
Hyacinth Ave E
Saint Paul, MN 55106
|
1,183 sq. feet
|
1 baths 3 beds |
show details | |

|
#49
Dunbury Ave
Farmington, MN 55024
|
2,232 sq. feet
|
2 baths 4 beds |
show details | |

|
Check over 1 million property listings on Foreclosure.com!
|
browse all offers | |||


 | What are the nicest condo and apartment complexes close to the river and near Mendota Heights ?? (0 replies) |
| Retirement Criteria (new to forum) (13 replies) |
| Older homes vs newer construction (11 replies) |
| West St. Paul to Mendota Heights area.... for house purchase (13 replies) |
| Thoughts On Outer Suburbs (7 replies) |
| Are you a Twin Cities transplant? (126 replies) |

Median year apartment built: 1993
Household type by relationship:
Households: 11,752- Male householders: 2,275 (445 living alone), Female householders: 2,504 (756 living alone)
2,882 spouses (2,882 opposite-sex spouses), 93 unmarried partners, (93 opposite-sex unmarried partners), 3,524 children (3,430 natural, 59 adopted, 34 stepchildren), 79 grandchildren, 54 brothers or sisters, 34 parents, 0 foster children, 119 other relatives, 88 non-relatives
- In group quarters: 95
Size of family households: 1,918 2-persons, 405 3-persons, 831 4-persons, 263 5-persons, 72 6-persons, 18 7-or-more-persons.
Size of nonfamily households: 1,206 1-person, 122 2-persons, 33 3-persons.
1,977 married couples with children.
441 single-parent households (29 men, 412 women).
93.1% of residents of Mendota Heights speak English at home.
2.6% of residents speak Spanish at home (69% speak English very well, 22% speak English well, 9% speak English not well).
1.5% of residents speak other Indo-European language at home (88% speak English very well, 3% speak English well, 10% speak English not well).
1.5% of residents speak Asian or Pacific Island language at home (58% speak English very well, 30% speak English well, 12% speak English not well).
2.0% of residents speak other language at home (100% speak English very well).
Foreign born population: 566 (4.8%)
(80.0% of them are naturalized citizens)
| Here: | 8.3 |
| State: | 7.1 |
| Here: | 4.0 |
| State: | 3.8 |
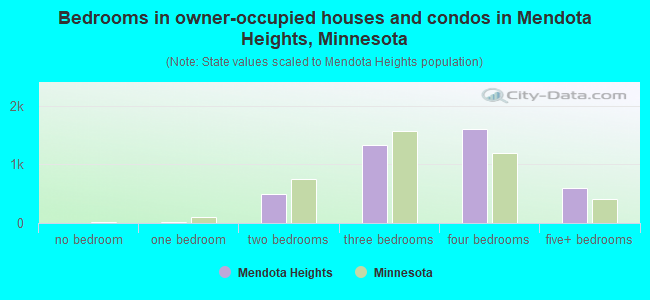
- Bedrooms in owner-occupied houses and condos in Mendota Heights, Minnesota
- 5no bedroom
- 111 bedroom
- 4962 bedrooms
- 1,3213 bedrooms
- 1,6004 bedrooms
- 6025+ bedrooms
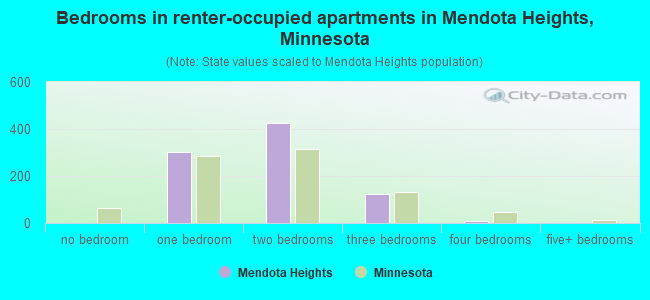
- Bedrooms in renter-occupied apartments in Mendota Heights, Minnesota
- 0no bedroom
- 3021 bedroom
- 4272 bedrooms
- 1233 bedrooms
- 74 bedrooms
- 05+ bedrooms
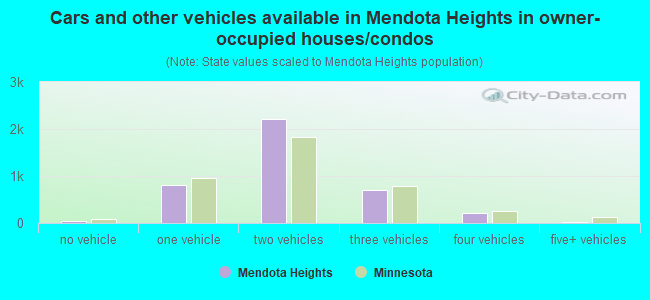
- Cars and other vehicles available in Mendota Heights in owner-occupied houses/condos
- 48no vehicle
- 8181 vehicle
- 2,2172 vehicles
- 7033 vehicles
- 2204 vehicles
- 315+ vehicles
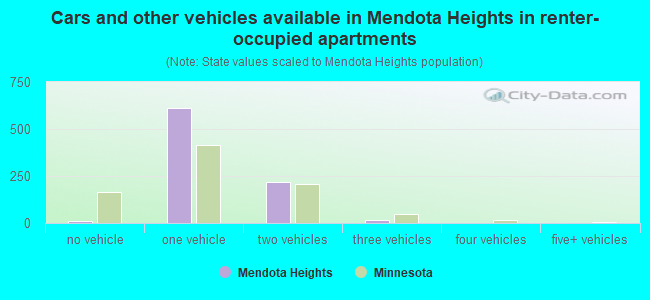
- Cars and other vehicles available in Mendota Heights in renter-occupied apartments
- 11no vehicle
- 6131 vehicle
- 2202 vehicles
- 143 vehicles
- 04 vehicles
- 05+ vehicles
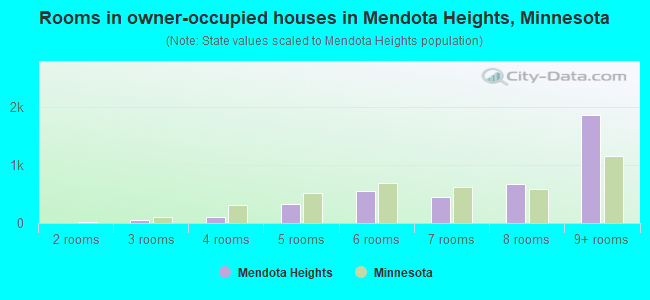
- Rooms in owner-occupied houses in Mendota Heights, Minnesota
- 51 room
- 02 rooms
- 533 rooms
- 1044 rooms
- 3225 rooms
- 5566 rooms
- 4567 rooms
- 6738 rooms
- 1,8679+ rooms
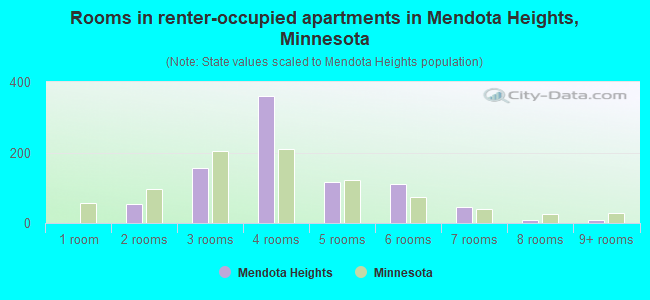
- Rooms in renter-occupied apartments in Mendota Heights, Minnesota
- 01 room
- 552 rooms
- 1553 rooms
- 3594 rooms
- 1165 rooms
- 1126 rooms
- 457 rooms
- 88 rooms
- 99+ rooms
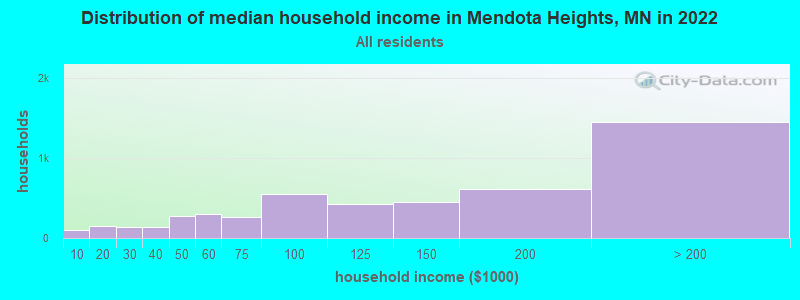
Mendota Heights, MN household income distribution

- 94Less than $10,000
- 149$10,000 to $19,999
- 143$20,000 to $29,999
- 138$30,000 to $39,999
- 281$40,000 to $49,999
- 304$50,000 to $59,999
- 264$60,000 to $74,999
- 551$75,000 to $99,999
- 427$100,000 to $124,999
- 447$125,000 to $149,999
- 616$150,000 to $199,999
- 1,452$200,000 or more
Home value of owner - occupied houses in 2022 in Mendota Heights, MN
-
- 9$25,000 to $29,999
- 35$40,000 to $49,999
- 25$60,000 to $69,999
- 14$70,000 to $79,999
- 14$100,000 to $124,999
- 9$150,000 to $174,999
- 34$175,000 to $199,999
- 170$200,000 to $249,999
- 264$250,000 to $299,999
- 674$300,000 to $399,999
- 831$400,000 to $499,999
- 1,692$500,000 to $749,999
- 428$750,000 to $999,999
- 300$1,000,000 to $1,499,999
- 13$1,500,000 to $1,999,999
- 5$2,000,000 or more
Rent paid by renters in 2022 in Mendota Heights, MN
-
- 0$250 to $299
- 18$300 to $349
- 11$400 to $449
- 17$500 to $549
- 123$700 to $749
- 214$800 to $899
- 29$900 to $999
- 107$1,250 to $1,499
- 333$1,500 to $1,999
- 19$2,000 to $2,499
- 22No cash rent
Percentage of workers working in this county: 54.4%
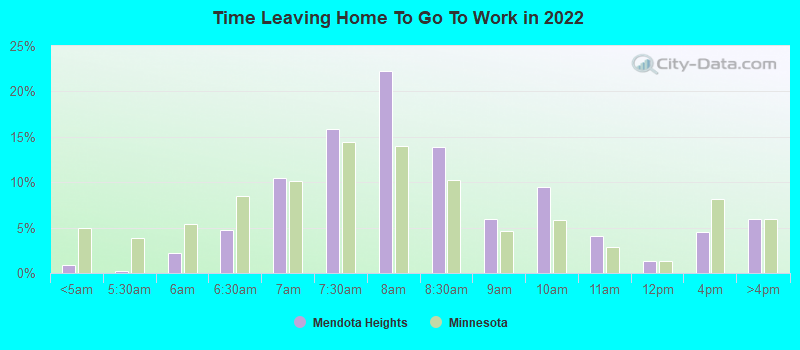
Number of people working at home: 1,863 (31.1% of all workers)
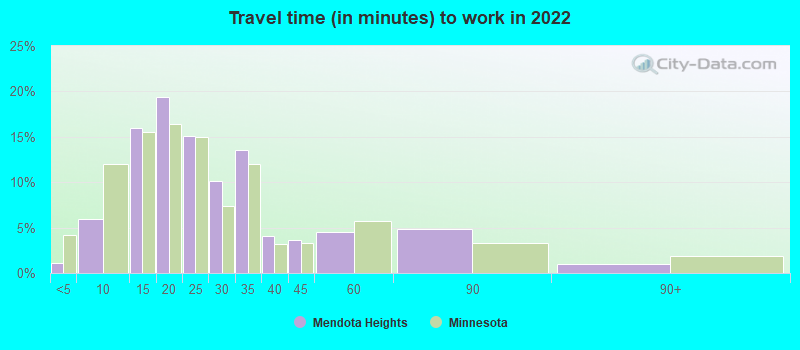
Travel time to work (commute)
- Less than 5 minutes: 52
- 5 to 9 minutes: 379
- 10 to 14 minutes: 753
- 15 to 19 minutes: 1,190
- 20 to 24 minutes: 687
- 25 to 29 minutes: 606
- 30 to 34 minutes: 483
- 35 to 39 minutes: 60
- 40 to 44 minutes: 57
- 45 to 59 minutes: 110
- 60 to 89 minutes: 52
- 90 or more minutes: 12
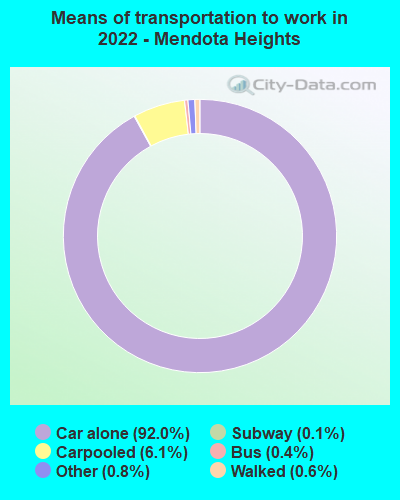
Means of transportation to work:
- Drove a car alone: 7,511 (72.2%)
- Carpooled: 575 (5.5%)
- Bus: 28 (0.3%)
- Long-distance train or commuter rail: 11 (0.1%)
- Taxi: 109 (1.0%)
- Bicycle: 4 (0.0%)
- Walked: 44 (0.4%)
- Worked at home: 1,863 (17.9%)
- Unemployment by race in 2022
- Unemployment rate for White non-Hispanic residents
- 1.1%Males
- 0.7%Females
- Unemployment rate for Black residents
- 10.0%Males
- Unemployment rate for two or more race residents
- 0.3%Females
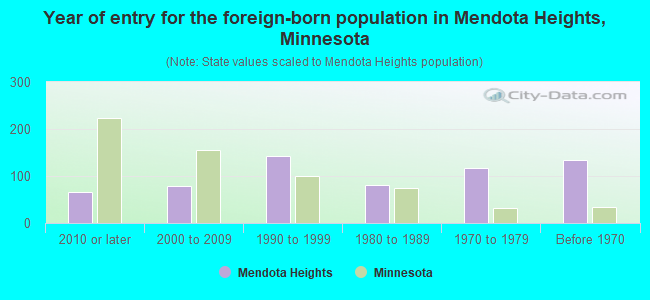
- Year of entry for the foreign-born population in Mendota Heights, Minnesota
- 672010 or later
- 792000 to 2009
- 1421990 to 1999
- 811980 to 1989
- 1161970 to 1979
- 133Before 1970
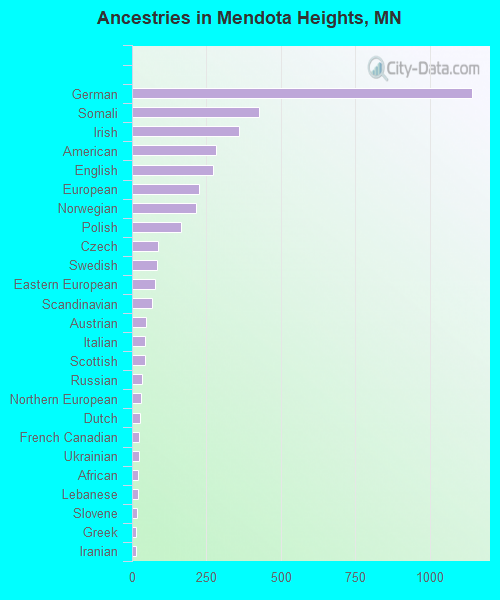
First ancestries reported:
- German: 1,142 (25.3%)
- Somali: 426 (9.4%)
- Irish: 358 (7.9%)
- American: 281 (6.2%)
- English: 272 (6.0%)
- European: 226 (5.0%)
- Norwegian: 216 (4.8%)
- Polish: 164 (3.6%)
- Czech: 88 (2.0%)
- Swedish: 83 (1.8%)
- Eastern European: 76 (1.7%)
- Scandinavian: 68 (1.5%)
- Austrian: 48 (1.1%)
- Italian: 43 (1.0%)
- Scottish: 43 (1.0%)
- Russian: 35 (0.8%)
- Northern European: 30 (0.7%)
- Dutch: 27 (0.6%)
- French Canadian: 24 (0.5%)
- Ukrainian: 23 (0.5%)
- African: 20 (0.4%)
- Lebanese: 19 (0.4%)
- Slovene: 18 (0.4%)
- Greek: 12 (0.3%)
- Iranian: 12 (0.3%)
- Swiss: 12 (0.3%)
- Hungarian: 10 (0.2%)
- French: 8 (0.2%)
- British: 7 (0.2%)
- Scotch-Irish: 5 (0.1%)
- Armenian: 4 (0.09%)
- Arab: 2 (0.04%)
Most common places of birth for foreign-born residents (%):
| Mendota Heights: | 20.5% (113) |
| Minnesota: | 8.0% (38,461) |
| Mendota Heights: | 13.2% (73) |
| Minnesota: | 2.0% (9,850) |
| Mendota Heights: | 10.9% (60) |
| Minnesota: | 3.8% (18,442) |
| Mendota Heights: | 8.2% (45) |
| Minnesota: | 12.1% (58,312) |
| Mendota Heights: | 6.9% (38) |
| Minnesota: | 0.5% (2,552) |
| Mendota Heights: | 4.5% (25) |
| Minnesota: | 2.4% (11,675) |
| Mendota Heights: | 4.2% (23) |
| Minnesota: | 0.5% (2,283) |
| Mendota Heights: | 3.8% (21) |
| Minnesota: | 1.0% (4,646) |
| Mendota Heights: | 3.8% (21) |
| Minnesota: | 0.2% (1,174) |
| Mendota Heights: | 3.6% (20) |
| Minnesota: | 1.3% (6,329) |
| Mendota Heights: | 3.3% (18) |
| Minnesota: | 2.5% (11,939) |
| Mendota Heights: | 3.1% (17) |
| Minnesota: | 3.6% (17,119) |
| Mendota Heights: | 2.5% (14) |
| Minnesota: | 0.4% (2,035) |
| Mendota Heights: | 2.4% (13) |
| Minnesota: | 4.0% (19,333) |
| Mendota Heights: | 2.0% (11) |
| Minnesota: | 0.8% (3,651) |
| Mendota Heights: | 1.8% (10) |
| Minnesota: | 0.4% (1,875) |
| Mendota Heights: | 1.6% (9) |
| Minnesota: | 0.5% (2,345) |
Place of birth for U.S.-born residents:
- This state: 8,317
- Other state: 2,739
- Northeast: 363
- Midwest: 1,676
- South: 263
- West: 385
90.0% of Mendota Heights residents lived in the same house 1 years ago.
Out of people who lived in different houses, 18.4% lived in this county.
Out of people who lived in different counties, 88.5% lived in Minnesota.
| Mendota Heights: | 90.0% |
| State average: | 87.4% |
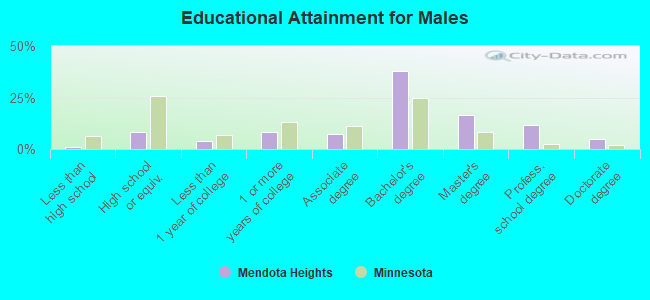
Education attainment for males 25 years and older:
- No schooling: 11
- Nursery to 4th grade: 0
- 5th and 6th grade: 0
- 7th and 8th grade: 0
- 9th grade: 6
- 10th grade: 0
- 11th grade: 12
- 12th grade, no diploma: 17
- High school graduate (or equivalency): 334
- Less than 1 year of college: 157
- Some college more than 1 year, no degree: 329
- Associate degree: 294
- Bachelor's degree: 1,490
- Master's degree: 645
- Professional school degree: 458
- Doctorate degree: 182
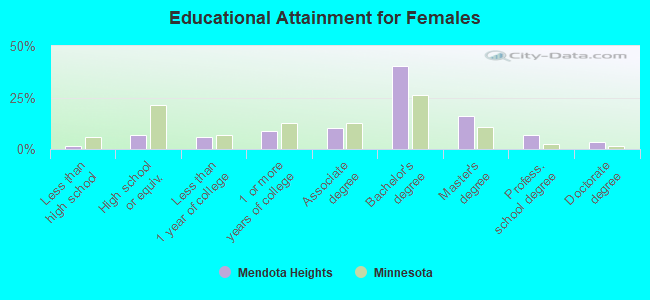
Education attainment for females 25 years and older:
- No schooling: 0
- Nursery to 4th grade: 3
- 5th and 6th grade: 0
- 7th and 8th grade: 0
- 9th grade: 7
- 10th grade: 5
- 11th grade: 23
- 12th grade, no diploma: 26
- High school graduate (or equivalency): 305
- Less than 1 year of college: 271
- Some college more than 1 year, no degree: 401
- Associate degree: 472
- Bachelor's degree: 1,867
- Master's degree: 748
- Professional school degree: 318
- Doctorate degree: 160


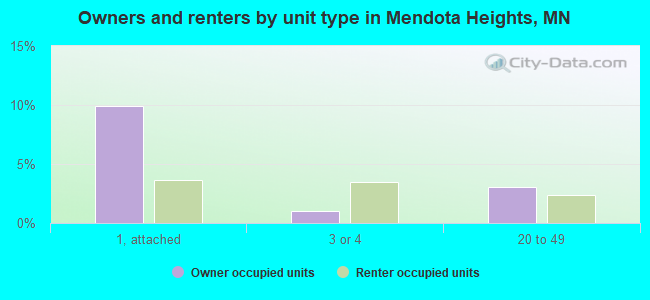
Housing units in structures:
- One, detached: 3,276
- One, attached: 750
- Two: 55
- 3 or 4: 206
- 5 to 9: 38
- 10 to 19: 35
- 20 to 49: 256
- 50 or more: 405
- Mobile homes: 5
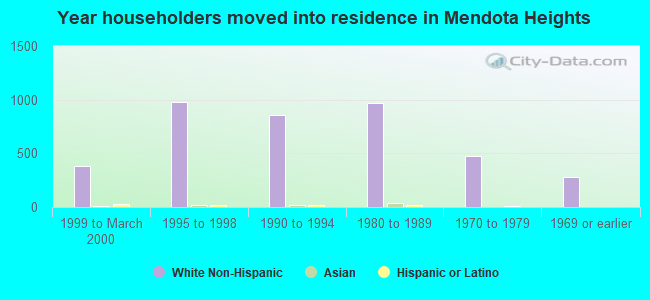
House/condo owner moved in on average 15 years ago
Renter moved in on average 4 years ago
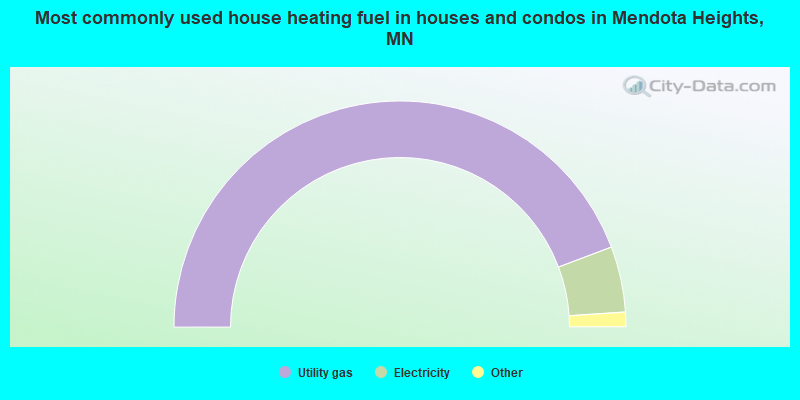
- 88.5%Utility gas
- 9.4%Electricity
- 0.8%Bottled, tank, or LP gas
- 0.5%Fuel oil, kerosene, etc.
- 0.3%Wood
- 0.3%No fuel used
- 0.2%Other fuel
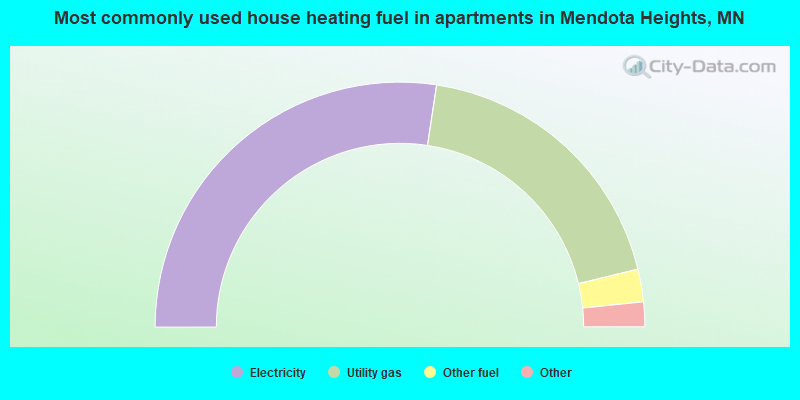
- 54.9%Electricity
- 37.7%Utility gas
- 4.3%Other fuel
- 2.0%No fuel used
- 1.1%Bottled, tank, or LP gas
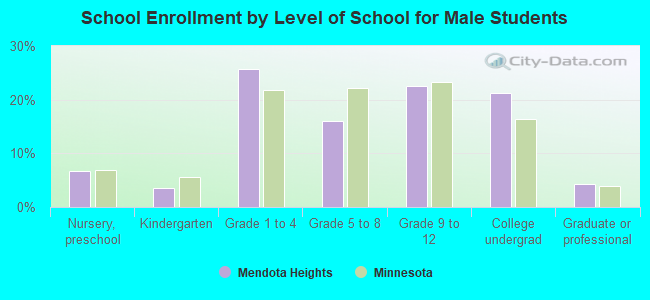
Private vs. public school enrollment:
| Here: | 37.4% |
| Minnesota: | 12.9% |
| Here: | 20.2% |
| Minnesota: | 8.6% |
| Here: | 25.9% |
| Minnesota: | 26.2% |