Memphis, TN (Tennessee) Houses and Residents
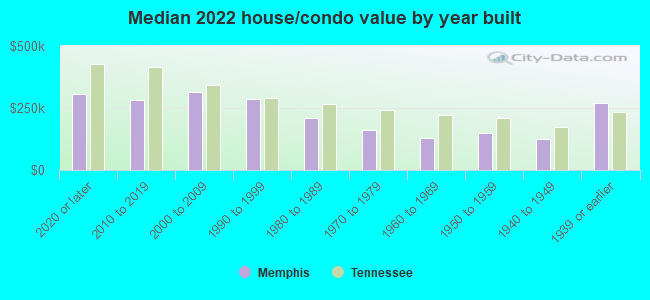
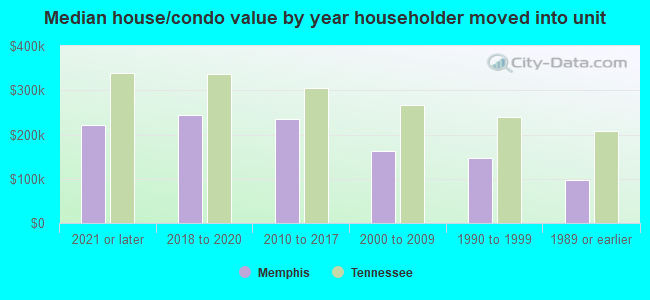
| Memphis: | $173,400 |
| Tennessee: | $284,800 |
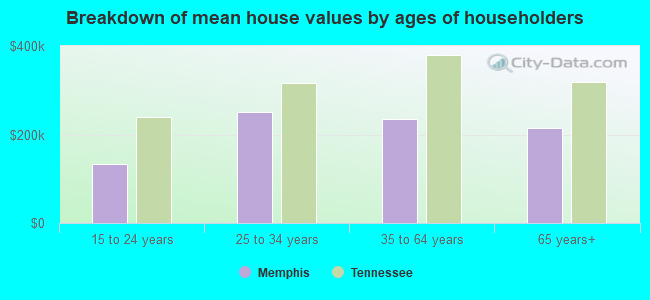
Mean price in 2022:
Detached houses: $259,313
Here: $259,313 State: $374,382 Townhouses or other attached units: $295,462
Here: $295,462 State: $354,101 In 2-unit structures: $308,890
Here: $308,890 State: $247,693 In 3-to-4-unit structures: $98,763
Here: $98,763 State: $239,060 In 5-or-more-unit structures: $217,893
Here: $217,893 State: $317,434 Mobile homes: $156,147
Here: $156,147 State: $101,421 Occupied boats, RVs, vans, etc.: $570,688
Here: $570,688 State: $142,822
Total population: 656,861 (Urban population: 649,352, Rural population: 493 (all nonfarm))
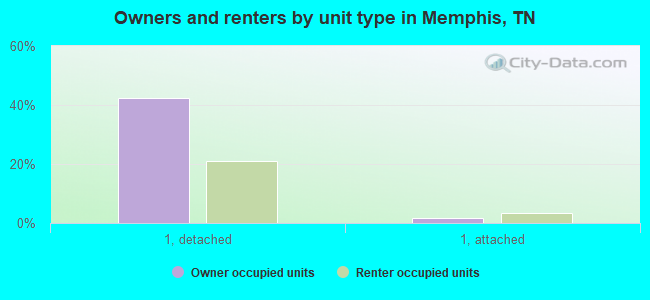
Houses: 290,535 (254,379 occupied: 117,057 owner occupied, 137,322 renter occupied)
| % of renters here: | 54% |
| State: | 33% |
Housing density: 1,040 houses/condos per square mile
Median price asked for vacant for-sale houses and condos in 2022: $112,203.
Median contract rent in 2022: $817 (lower quartile is $643, upper quartile is $1,094)
Median rent asked for vacant for-rent units in 2022: $989
Median gross rent in Memphis, TN in 2022: $1,098
Housing units in Memphis with a mortgage: 68,824 (4,847 second mortgage, 135 home equity loan, 3,853 both second mortgage and home equity loan)
Houses without a mortgage: 2,086
Median household income for houses/condos with a mortgage: $85,555
Median household income for apartments without a mortgage: $57,558
Median monthly housing costs: $1,058
Compare current foreclosures in Memphis, TN:
| Photo | Address | Area | Beds / Baths | Price | Details |
|---|---|---|---|---|---|

|
#1
University St
Memphis, TN 38127
|
1,152 sq. feet
|
2 baths 2 beds |
$31,750
|
show details |

|
#2
S Greer St
Memphis, TN 38111
|
820 sq. feet
|
1 baths 2 beds |
$120,000
|
show details |

|
#3
Gates Cv
Memphis, TN 38115
|
1,221 sq. feet
|
1 baths 2 beds |
$64,000
|
show details |

|
#4
Dolan Rd
Memphis, TN 38116
|
- sq. feet
|
2 baths 3 beds |
$82,950
|
show details |

|
#5
Majuba Ave
Memphis, TN 38109
|
960 sq. feet
|
1 baths 3 beds |
$15,900
|
show details |

|
#6
Northgate St
Memphis, TN 38127
|
1,528 sq. feet
|
1 baths 3 beds |
$29,900
|
show details |

|
#7
Santa Cruz Cv
Memphis, TN 38133
|
1,791 sq. feet
|
2 baths 3 beds |
show details | |

|
#8
Lloydminster Cv
Memphis, TN 38141
|
1,304 sq. feet
|
2 baths 3 beds |
show details | |

|
#9
Gillham Cv
Memphis, TN 38134
|
1,700 sq. feet
|
2 baths 3 beds |
show details | |

|
#10
Felix Ave
Memphis, TN 38111
|
1,189 sq. feet
|
1 baths 3 beds |
show details |
| Photo | Address | Area | Beds / Baths | Price | Details |
|---|---|---|---|---|---|

|
#11
Jardin Pl
Memphis, TN 38141
|
1,417 sq. feet
|
2 baths 3 beds |
show details | |

|
#12
Bonnie Dr
Memphis, TN 38116
|
2,422 sq. feet
|
2 baths 3 beds |
show details | |

|
#13
Lessa Ln
Memphis, TN 38134
|
2,148 sq. feet
|
2 baths 4 beds |
show details | |

|
#14
Tanglewood St
Memphis, TN 38104
|
964 sq. feet
|
1 baths 2 beds |
show details | |

|
#15
Elvis Presley Blvd
Memphis, TN 38116
|
1,725 sq. feet
|
2 baths 4 beds |
show details | |

|
#16
Blue Pearl Cv
Memphis, TN 38109
|
2,364 sq. feet
|
2 baths 3 beds |
show details | |

|
#17
E Mclemore Ave
Memphis, TN 38114
|
1,415 sq. feet
|
1 baths 3 beds |
show details | |

|
#18
Hermitage Dr
Memphis, TN 38116
|
2,072 sq. feet
|
3 baths 4 beds |
show details | |

|
#19
Queens Elizabeth Fair
Memphis, TN 38116
|
- sq. feet
|
2 baths 3 beds |
show details | |

|
#20
Gaylord Ln
Memphis, TN 38118
|
1,116 sq. feet
|
1 baths 3 beds |
show details |
| Photo | Address | Area | Beds / Baths | Price | Details |
|---|---|---|---|---|---|

|
#21
Boxtown Rd
Memphis, TN 38109
|
1,360 sq. feet
|
1 baths 3 beds |
show details | |

|
#22
Park Ave
Memphis, TN 38119
|
1,128 sq. feet
|
1 baths 2 beds |
show details | |

|
#23
Lucille Ave
Memphis, TN 38106
|
1,564 sq. feet
|
2 baths 4 beds |
show details | |

|
#24
Birch Glen Dr
Memphis, TN 38115
|
1,553 sq. feet
|
2 baths 3 beds |
show details | |

|
#25
Capri St
Memphis, TN 38117
|
1,358 sq. feet
|
1 baths 3 beds |
show details | |

|
#26
Faxon Ave
Memphis, TN 38122
|
1,771 sq. feet
|
2 baths 2 beds |
show details | |

|
#27
S Perkins Rd
Memphis, TN 38117
|
1,249 sq. feet
|
1 baths 3 beds |
show details | |

|
#28
Richland View Ln
Memphis, TN 38133
|
2,251 sq. feet
|
3 baths 4 beds |
show details | |

|
#29
Schanna Dr
Memphis, TN 38135
|
1,924 sq. feet
|
2 baths 3 beds |
show details | |

|
#30
Ginger Cir
Memphis, TN 38118
|
2,096 sq. feet
|
2 baths 3 beds |
show details |
| Photo | Address | Area | Beds / Baths | Price | Details |
|---|---|---|---|---|---|

|
#31
Eagle Valley Cv
Memphis, TN 38135
|
2,651 sq. feet
|
2 baths 4 beds |
show details | |

|
#32
Isabelle St
Memphis, TN 38122
|
941 sq. feet
|
1 baths 2 beds |
show details | |

|
#33
Maury St
Memphis, TN 38107
|
1,789 sq. feet
|
2 baths 3 beds |
show details | |

|
#34
Marynelle St
Memphis, TN 38116
|
1,967 sq. feet
|
2 baths 3 beds |
show details | |

|
#35
Sea Horse Dr
Memphis, TN 38141
|
1,689 sq. feet
|
2 baths 3 beds |
show details | |

|
#36
Berta Rd
Memphis, TN 38109
|
937 sq. feet
|
1 baths 2 beds |
show details | |

|
#37
Spring Morning Ct
Memphis, TN 38125
|
1,413 sq. feet
|
2 baths 3 beds |
show details | |

|
#38
Long Creek Rd
Memphis, TN 38125
|
2,472 sq. feet
|
2 baths 3 beds |
show details | |

|
#39
Orleans Rd
Memphis, TN 38116
|
1,976 sq. feet
|
2 baths 3 beds |
show details | |

|
#40
N Ball Rd
Memphis, TN 38106
|
912 sq. feet
|
1 baths 3 beds |
show details |
| Photo | Address | Area | Beds / Baths | Price | Details |
|---|---|---|---|---|---|

|
#41
E Belz Blvd
Memphis, TN 38109
|
175,250 sq. feet
|
1 baths 1 beds |
show details | |

|
#42
Dothan St
Memphis, TN 38118
|
- sq. feet
|
2 baths 3 beds |
show details | |

|
#43
N Lakewood Dr
Memphis, TN 38128
|
2,712 sq. feet
|
2 baths 3 beds |
show details | |

|
#44
N Hollywood St
Memphis, TN 38112
|
1,437 sq. feet
|
1 baths 3 beds |
show details | |

|
#45
N Mclean Blvd
Memphis, TN 38107
|
1,829 sq. feet
|
2 baths 3 beds |
show details | |

|
#46
Wildflower Ln
Memphis, TN 38125
|
2,730 sq. feet
|
2 baths 4 beds |
show details | |

|
#47
Hudgins Rd
Memphis, TN 38116
|
3,625 sq. feet
|
2 baths 4 beds |
show details | |

|
#48
Carney St
Memphis, TN 38127
|
1,070 sq. feet
|
2 baths 3 beds |
show details | |

|
#49
Harbor Bend Rd
Memphis, TN 38103
|
2,477 sq. feet
|
3 baths 3 beds |
show details | |

|
Check over 1 million property listings on Foreclosure.com!
|
browse all offers | |||

Latest news about housing in Memphis, TN collected exclusively by city-data.com from local newspapers, TV, and radio stations

 | Rental Houses Vs Apartments?? (4 replies) |
| Buying a condo in Memphis. Need advice. (2 replies) |
| Moving to Memphis - What's up w/ apartments downtown? (10 replies) |
| Condos, Lofts, Townhouses, Etc (5 replies) |
| Looking for Indian Community Apartments Memphis/GermanTown/collierville (8 replies) |
| Memphis Apartment Opinions (5 replies) |
Median year apartment built: 1974
Household type by relationship:
Households: 621,050- Male householders: 111,453 (47,715 living alone), Female householders: 142,926 (46,770 living alone)
66,872 spouses (66,012 opposite-sex spouses), 23,476 unmarried partners, (21,897 opposite-sex unmarried partners), 182,085 children (169,367 natural, 4,142 adopted, 8,576 stepchildren), 25,548 grandchildren, 12,688 brothers or sisters, 7,000 parents, 799 foster children, 17,098 other relatives, 17,763 non-relatives
- In group quarters: 13,342
Size of family households: 62,379 2-persons, 35,383 3-persons, 23,364 4-persons, 10,887 5-persons, 5,006 6-persons, 3,632 7-or-more-persons.
Size of nonfamily households: 94,485 1-person, 16,740 2-persons, 1,825 3-persons, 62 4-persons, 411 5-persons, 95 6-persons, 110 7-or-more-persons.
46,469 married couples with children.
76,949 single-parent households (13,141 men, 63,808 women).
90.1% of residents of Memphis speak English at home.
7.2% of residents speak Spanish at home (55% speak English very well, 19% speak English well, 17% speak English not well, 8% don't speak English at all).
0.8% of residents speak other Indo-European language at home (85% speak English very well, 12% speak English well, 2% speak English not well).
0.9% of residents speak Asian or Pacific Island language at home (57% speak English very well, 15% speak English well, 24% speak English not well, 3% don't speak English at all).
0.9% of residents speak other language at home (63% speak English very well, 15% speak English well, 15% speak English not well, 7% don't speak English at all).
Foreign born population: 44,676 (7.2%)
(29.1% of them are naturalized citizens)
| Here: | 6.4 |
| State: | 6.5 |
| Here: | 4.6 |
| State: | 4.4 |
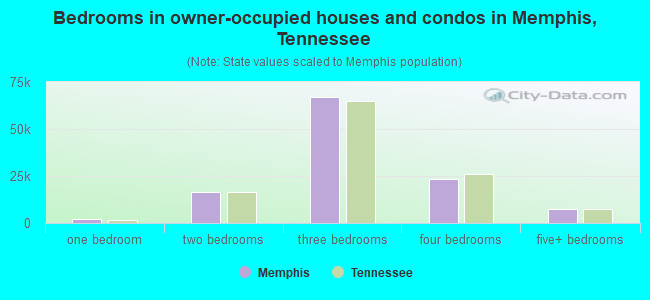
- Bedrooms in owner-occupied houses and condos in Memphis, Tennessee
- 360no bedroom
- 2,1771 bedroom
- 16,5872 bedrooms
- 66,9833 bedrooms
- 23,6704 bedrooms
- 7,2805+ bedrooms
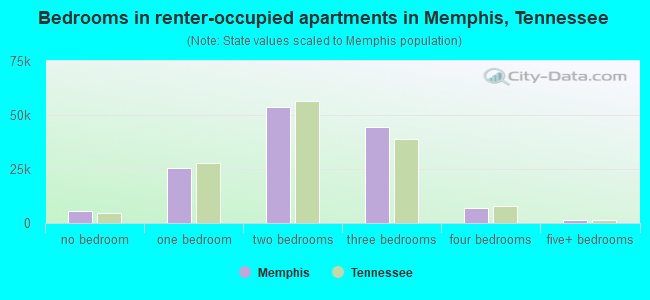
- Bedrooms in renter-occupied apartments in Memphis, Tennessee
- 5,327no bedroom
- 25,2381 bedroom
- 53,7152 bedrooms
- 44,4933 bedrooms
- 6,9874 bedrooms
- 1,5625+ bedrooms
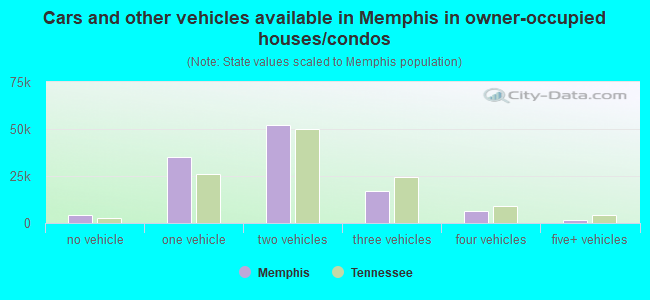
- Cars and other vehicles available in Memphis in owner-occupied houses/condos
- 4,403no vehicle
- 35,0021 vehicle
- 52,3532 vehicles
- 17,1093 vehicles
- 6,5024 vehicles
- 1,6885+ vehicles
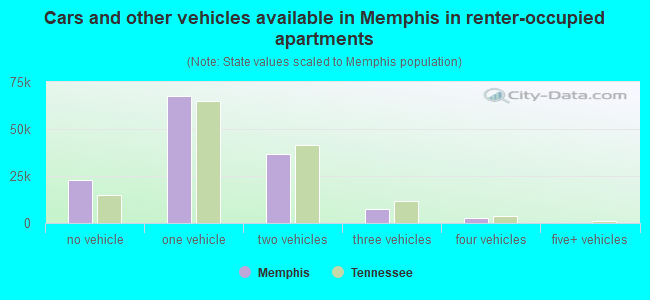
- Cars and other vehicles available in Memphis in renter-occupied apartments
- 22,941no vehicle
- 67,4221 vehicle
- 36,7302 vehicles
- 7,2573 vehicles
- 2,7244 vehicles
- 2485+ vehicles
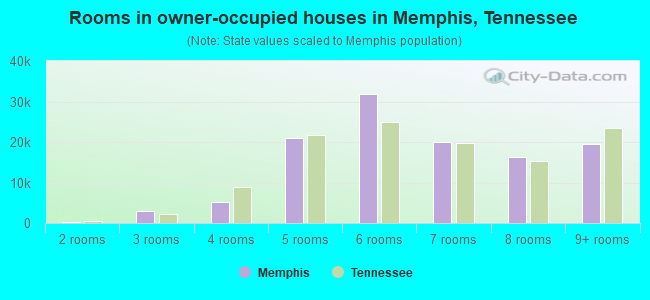
- Rooms in owner-occupied houses in Memphis, Tennessee
- 2621 room
- 1752 rooms
- 2,8563 rooms
- 5,1914 rooms
- 21,0185 rooms
- 31,7456 rooms
- 19,8857 rooms
- 16,3628 rooms
- 19,5639+ rooms
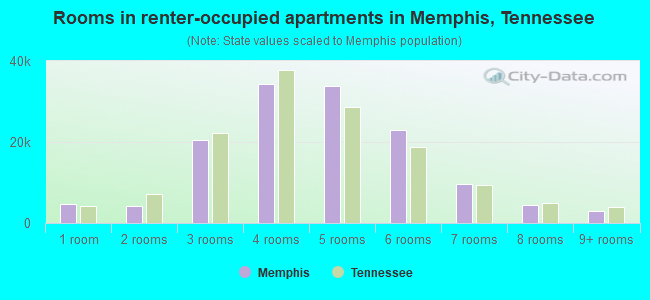
- Rooms in renter-occupied apartments in Memphis, Tennessee
- 4,7681 room
- 4,1662 rooms
- 20,4173 rooms
- 34,3324 rooms
- 33,8435 rooms
- 22,8976 rooms
- 9,5767 rooms
- 4,3308 rooms
- 2,9939+ rooms
Memphis, TN household income distribution

- 21,493Less than $10,000
- 26,054$10,000 to $19,999
- 29,051$20,000 to $29,999
- 24,013$30,000 to $39,999
- 24,930$40,000 to $49,999
- 18,512$50,000 to $59,999
- 25,896$60,000 to $74,999
- 27,251$75,000 to $99,999
- 15,997$100,000 to $124,999
- 15,558$125,000 to $149,999
- 12,662$150,000 to $199,999
- 12,962$200,000 or more

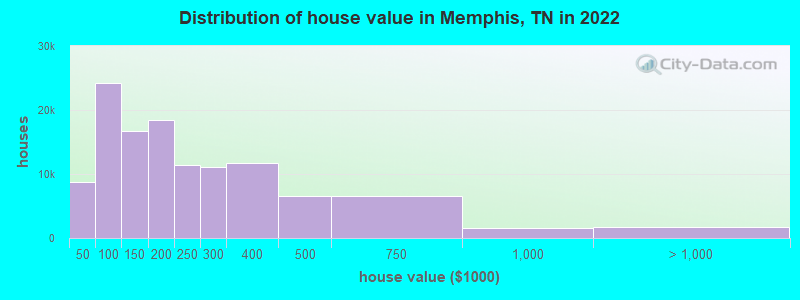
Home value of owner - occupied houses in 2022 in Memphis, TN
-
- 1,567Less than $10,000
- 1,039$10,000 to $14,999
- 494$15,000 to $19,999
- 1,260$20,000 to $24,999
- 865$25,000 to $29,999
- 1,113$30,000 to $34,999
- 481$35,000 to $39,999
- 1,923$40,000 to $49,999
- 3,117$50,000 to $59,999
- 5,605$60,000 to $69,999
- 4,266$70,000 to $79,999
- 5,532$80,000 to $89,999
- 3,836$90,000 to $99,999
- 9,695$100,000 to $124,999
- 6,965$125,000 to $149,999
- 11,503$150,000 to $174,999
- 6,942$175,000 to $199,999
- 11,483$200,000 to $249,999
- 11,167$250,000 to $299,999
- 11,768$300,000 to $399,999
- 6,622$400,000 to $499,999
- 6,596$500,000 to $749,999
- 1,487$750,000 to $999,999
- 1,057$1,000,000 to $1,499,999
- 226$1,500,000 to $1,999,999
- 448$2,000,000 or more
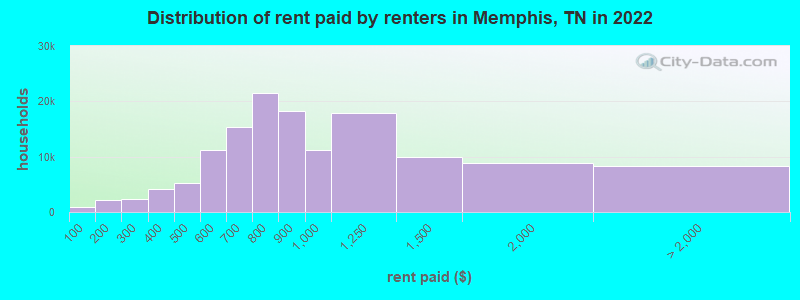
Rent paid by renters in 2022 in Memphis, TN
-
- 826Less than $100
- 1,217$100 to $149
- 1,010$150 to $199
- 1,344$200 to $249
- 1,056$250 to $299
- 2,074$300 to $349
- 2,042$350 to $399
- 2,550$400 to $449
- 2,743$450 to $499
- 5,896$500 to $549
- 5,233$550 to $599
- 8,081$600 to $649
- 7,299$650 to $699
- 9,871$700 to $749
- 11,651$750 to $799
- 18,221$800 to $899
- 11,173$900 to $999
- 17,912$1,000 to $1,249
- 9,957$1,250 to $1,499
- 8,809$1,500 to $1,999
- 1,702$2,000 to $2,499
- 880$2,500 to $2,999
- 297$3,000 to $3,499
- 223$3,500 or more
- 5,255No cash rent

Percentage of workers working in this county: 93.7%
Number of people working at home: 30,376 (10.7% of all workers)

Travel time to work (commute)
- Less than 5 minutes: 3,857
- 5 to 9 minutes: 29,575
- 10 to 14 minutes: 32,960
- 15 to 19 minutes: 47,807
- 20 to 24 minutes: 66,288
- 25 to 29 minutes: 19,597
- 30 to 34 minutes: 31,077
- 35 to 39 minutes: 4,552
- 40 to 44 minutes: 5,784
- 45 to 59 minutes: 5,679
- 60 to 89 minutes: 2,190
- 90 or more minutes: 3,339

Means of transportation to work:
- Drove a car alone: 314,405 (78.7%)
- Carpooled: 37,958 (9.5%)
- Bus: 1,751 (0.4%)
- Taxi: 7,243 (1.8%)
- Bicycle: 779 (0.2%)
- Walked: 7,028 (1.8%)
- Worked at home: 30,376 (7.6%)
- Unemployment by race in 2022
- Unemployment rate for White non-Hispanic residents
- 2.8%Males
- 3.6%Females
- Unemployment rate for Black residents
- 7.4%Males
- 7.4%Females
- Unemployment rate for American Indian and Alaska Native residents
- 14.1%Males
- 31.9%Females
- Unemployment rate for Asian residents
- 1.4%Males
- 4.3%Females
- Unemployment rate for other race residents
- 3.3%Males
- 10.5%Females
- Unemployment rate for two or more race residents
- 4.2%Males
- 3.3%Females
- Unemployment rate for Hispanic or Latino residents
- 3.8%Males
- 10.0%Females
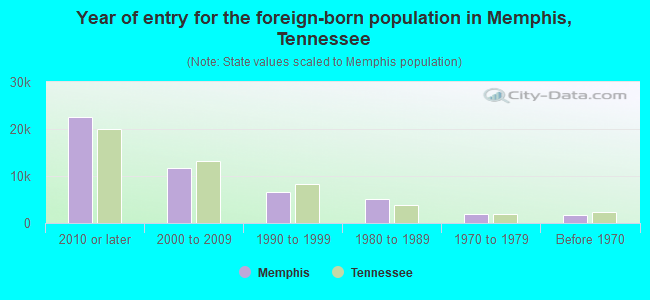
- Year of entry for the foreign-born population in Memphis, Tennessee
- 22,4722010 or later
- 11,6582000 to 2009
- 6,6871990 to 1999
- 5,0261980 to 1989
- 1,9891970 to 1979
- 1,747Before 1970
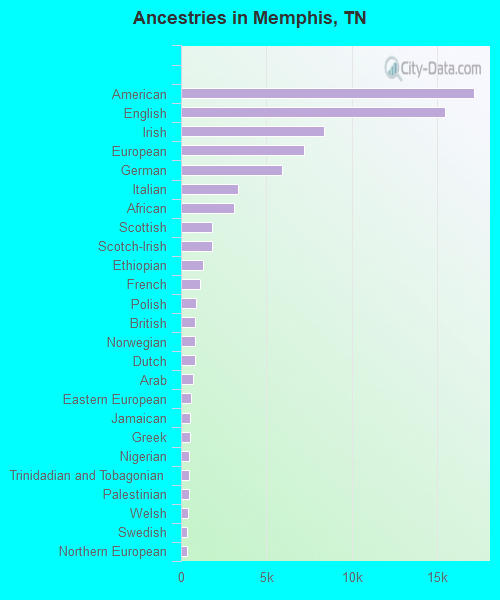
First ancestries reported:
- American: 17,193 (3.7%)
- English: 15,471 (3.4%)
- Irish: 8,381 (1.8%)
- European: 7,201 (1.6%)
- German: 5,932 (1.3%)
- Italian: 3,327 (0.7%)
- African: 3,078 (0.7%)
- Scottish: 1,846 (0.4%)
- Scotch-Irish: 1,798 (0.4%)
- Ethiopian: 1,315 (0.3%)
- French: 1,097 (0.2%)
- Polish: 876 (0.2%)
- British: 811 (0.2%)
- Norwegian: 807 (0.2%)
- Dutch: 806 (0.2%)
- Arab: 721 (0.2%)
- Eastern European: 569 (0.1%)
- Jamaican: 539 (0.1%)
- Greek: 517 (0.1%)
- Nigerian: 495 (0.1%)
- Trinidadian and Tobagonian: 481 (0.1%)
- Palestinian: 460 (0.10%)
- Welsh: 383 (0.08%)
- Swedish: 370 (0.08%)
- Northern European: 323 (0.07%)
- Scandinavian: 288 (0.06%)
- Russian: 287 (0.06%)
- Portuguese: 277 (0.06%)
- Czech: 253 (0.05%)
- Sudanese: 220 (0.05%)
- Egyptian: 219 (0.05%)
- Lebanese: 217 (0.05%)
- French Canadian: 211 (0.05%)
- Lithuanian: 156 (0.03%)
- Iranian: 144 (0.03%)
- Syrian: 142 (0.03%)
- Brazilian: 134 (0.03%)
- Turkish: 132 (0.03%)
- Danish: 120 (0.03%)
- Canadian: 108 (0.02%)
- Romanian: 104 (0.02%)
- Austrian: 94 (0.02%)
- Slavic: 94 (0.02%)
- Kenyan: 85 (0.02%)
- Hungarian: 81 (0.02%)
- Ukrainian: 80 (0.02%)
- Yugoslavian: 79 (0.02%)
- Swiss: 60 (0.01%)
- Ghanaian: 56 (0.01%)
- Cape Verdean: 53 (0.01%)
- Israeli: 53 (0.01%)
- Senegalese: 45 (0.01%)
- British West Indian: 42 (0.01%)
- Czechoslovakian: 41 (0.01%)
- Somali: 34 (0.01%)
- West Indian: 32 (0.01%)
- Iraqi: 31 (0.01%)
- Haitian: 27 (0.01%)
- Serbian: 25 (0.01%)
- Australian: 25 (0.01%)
- Bulgarian: 24 (0.01%)
Most common places of birth for foreign-born residents (%):
| Memphis: | 27.3% (11,369) |
| Tennessee: | 23.0% (86,435) |
| Memphis: | 10.4% (4,324) |
| Tennessee: | 4.6% (17,433) |
| Memphis: | 8.8% (3,646) |
| Tennessee: | 5.7% (21,286) |
| Memphis: | 5.4% (2,244) |
| Tennessee: | 1.6% (5,936) |
| Memphis: | 5.0% (2,067) |
| Tennessee: | 2.4% (8,894) |
| Memphis: | 3.3% (1,383) |
| Tennessee: | 3.3% (12,582) |
| Memphis: | 2.8% (1,173) |
| Tennessee: | 1.4% (5,265) |
| Memphis: | 2.8% (1,170) |
| Tennessee: | 2.7% (10,313) |
| Memphis: | 2.5% (1,045) |
| Tennessee: | 6.1% (23,079) |
| Memphis: | 2.0% (818) |
| Tennessee: | 1.2% (4,662) |
| Memphis: | 1.7% (722) |
| Tennessee: | 0.3% (1,075) |
| Memphis: | 1.6% (678) |
| Tennessee: | 0.3% (1,173) |
| Memphis: | 1.6% (667) |
| Tennessee: | 3.1% (11,640) |
Place of birth for U.S.-born residents:
- This state: 399,014
- Other state: 172,854
- Northeast: 11,576
- Midwest: 34,443
- South: 114,622
- West: 12,213
86.1% of Memphis residents lived in the same house 1 years ago.
Out of people who lived in different houses, 39.5% lived in this county.
Out of people who lived in different counties, 35.4% lived in Tennessee.
| Memphis: | 86.1% |
| State average: | 87.0% |
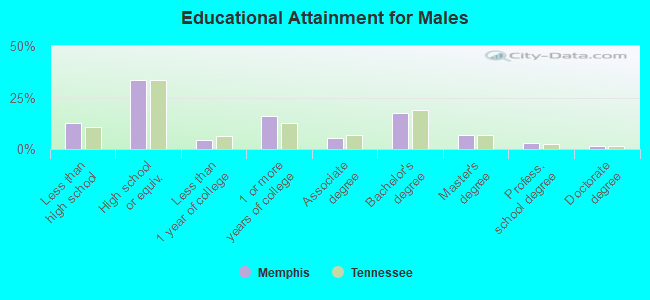
Education attainment for males 25 years and older:
- No schooling: 3,527
- Nursery to 4th grade: 748
- 5th and 6th grade: 2,729
- 7th and 8th grade: 2,860
- 9th grade: 1,977
- 10th grade: 3,137
- 11th grade: 4,203
- 12th grade, no diploma: 4,579
- High school graduate (or equivalency): 63,686
- Less than 1 year of college: 8,106
- Some college more than 1 year, no degree: 30,619
- Associate degree: 10,630
- Bachelor's degree: 33,047
- Master's degree: 12,562
- Professional school degree: 5,350
- Doctorate degree: 3,212
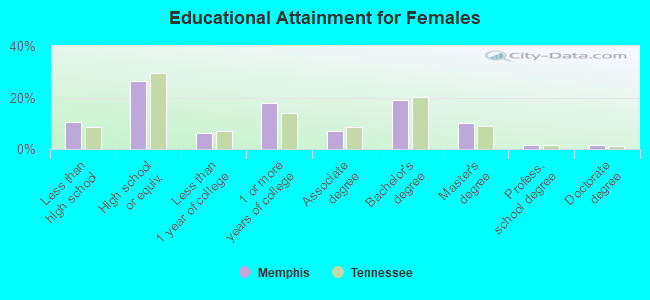
Education attainment for females 25 years and older:
- No schooling: 2,828
- Nursery to 4th grade: 766
- 5th and 6th grade: 1,998
- 7th and 8th grade: 2,549
- 9th grade: 2,521
- 10th grade: 2,806
- 11th grade: 5,699
- 12th grade, no diploma: 3,665
- High school graduate (or equivalency): 58,255
- Less than 1 year of college: 14,013
- Some college more than 1 year, no degree: 38,970
- Associate degree: 15,065
- Bachelor's degree: 41,838
- Master's degree: 22,389
- Professional school degree: 3,553
- Doctorate degree: 3,425
Housing units in structures:
- One, detached: 175,537
- One, attached: 14,494
- Two: 6,253
- 3 or 4: 18,092
- 5 to 9: 25,248
- 10 to 19: 18,381
- 20 to 49: 7,945
- 50 or more: 20,330
- Mobile homes: 3,940
- Boats, RVs, vans, etc.: 315
Median worth of mobile homes: $73,117
Housing units lacking complete kitchen facilities in 2022: 5.3%
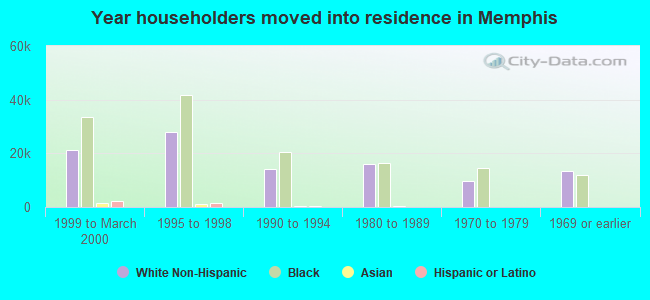
House/condo owner moved in on average 16 years ago
Renter moved in on average 2 years ago
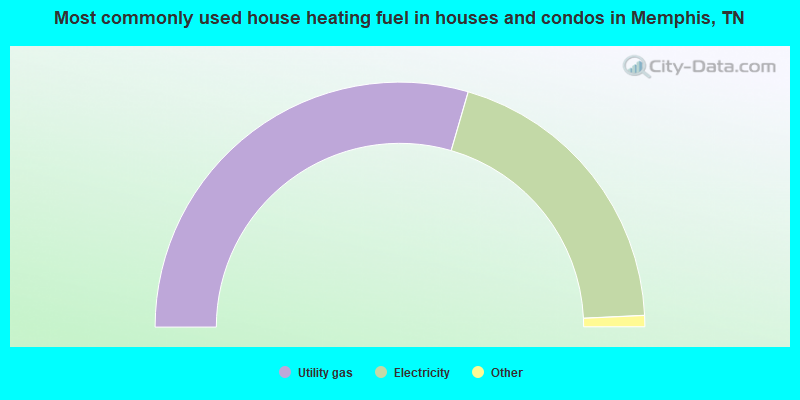
- 59.0%Utility gas
- 39.5%Electricity
- 0.9%Bottled, tank, or LP gas
- 0.2%No fuel used
- 0.1%Wood
- 0.1%Other fuel
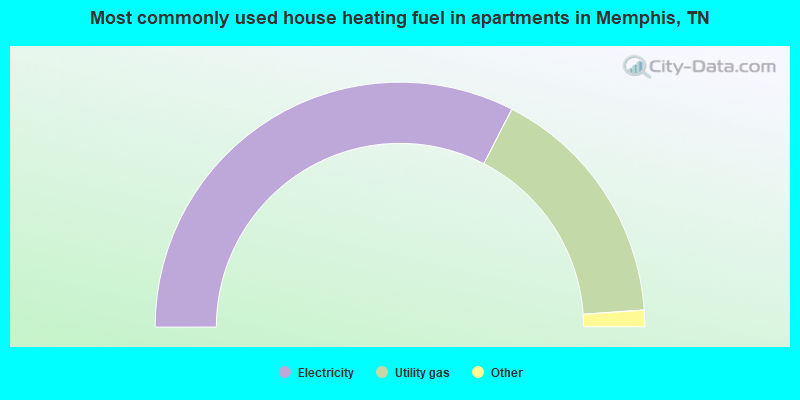
- 65.1%Electricity
- 32.7%Utility gas
- 0.9%Bottled, tank, or LP gas
- 0.7%No fuel used
- 0.2%Other fuel
- 0.1%Fuel oil, kerosene, etc.
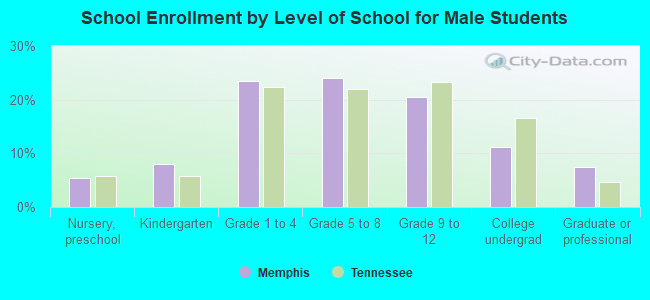
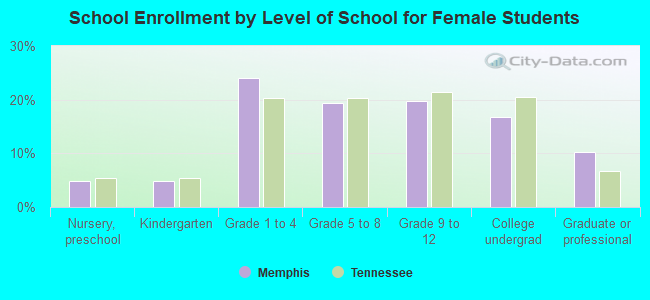
Private vs. public school enrollment:
| Here: | 9.6% |
| Tennessee: | 15.0% |
| Here: | 13.5% |
| Tennessee: | 16.2% |
| Here: | 26.1% |
| Tennessee: | 23.5% |