Medina, OH (Ohio) Houses and Residents
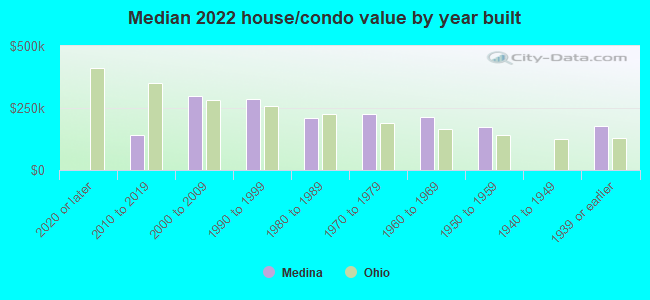
Estimated median house or condo value in 2022: $229,215 (it was $138,600 in 2000 )
Medina:
$229,215Ohio:
$204,100
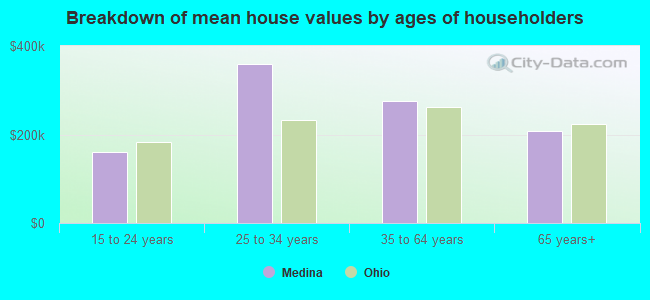
Lower value quartile - upper value quartile: $164,117 - $302,184Mean price in 2022: Detached houses: $294,055 Here:
$294,055State:
$254,366
Townhouses or other attached units: $176,816 Here:
$176,816State:
$225,733
In 2-unit structures: $136,650 Here:
$136,650State:
$144,384
In 3-to-4-unit structures: $60,196 Here:
$60,196State:
$203,002
In 5-or-more-unit structures: $147,365 Here:
$147,365State:
$211,593
Mobile homes: $28,842 Here:
$28,842State:
$62,719
Total population: 26,523 (Urban population: 24,836 (all inside urban clusters), Rural population: 234 (all nonfarm) )
Houses: 11,290 (10,754 occupied: 7,474 owner occupied, 3,315 renter occupied )
% of renters here:
31%State:
33%
Housing density: 1,015 houses/condos per square mile
Median price asked for vacant for-sale houses and condos in 2022 in this county: $3,756.
Median contract rent in 2022: $803 (lower quartile is $680, upper quartile is $1,138)
Median rent asked for vacant for-rent units in 2022: $1,499
Median gross rent in Medina, OH in 2022: $946
Housing units in Medina with a mortgage: 5,100 (739 second mortgage, 0 home equity loan, 677 both second mortgage and home equity loan )Houses without a mortgage: 234
Median household income for houses/condos with a mortgage: $102,559
Median household income for apartments without a mortgage: $77,465
Median monthly housing costs: $1,043
Data:
Median house or condo value ($)
Median house or condo value ($ change since 2000)
Median house or condo value ($) - White
Median house or condo value ($) - Black or African American
Median house or condo value ($) - Asian
Median house or condo value ($) - Hispanic or Latino
Median house or condo value ($) - American Indian and Alaska Native
Median house or condo value ($) - Multirace
Median house or condo value ($) - Other Race
Median price asked for mobile homes ($)
Household density (households per square mile)
Mean house or condo value by units in structure - 1, detached ($)
Mean house or condo value by units in structure - 1, attached ($)
Mean house or condo value by units in structure - 2 ($)
Mean house or condo value by units in structure by units in structure - 3 or 4 ($)
Mean house or condo value by units in structure - 5 or more ($)
Mean house or condo value by units in structure - Boat, RV, van, etc. ($)
Mean house or condo value by units in structure - Mobile home ($)
Median contract rent ($)
Median contract rent - Lower quartile ($)
Median contract rent - Upper quartile ($)
Median gross rent ($)
Urban houses (%)
Rural houses (%)
Houses occupied (%)
Houses occupied (% change since 2000)
Houses owner occupied (%)
Houses owner occupied (% change since 2000)
Houses renter occupied (%)
Houses renter occupied (% change since 2000)
Vacant housing units - For rent (%)
Vacant housing units - For rent (% change since 2000)
Vacant housing units - For sale only (%)
Vacant housing units - For sale only (% change since 2000)
Vacant housing units - Rented or sold, not occupied (%)
Vacant housing units - Rented or sold, not occupied (% change since 2000)
Vacant housing units - For seasonal, recreational, or occasional use (%)
Vacant housing units - For seasonal, recreational, or occasional use (% change since 2000)
Vacant housing units - For migrant workers (%)
Vacant housing units - For migrant workers (% change since 2000)
Vacant housing units - Other vacant (%)
Vacant housing units - Other vacant (% change since 2000)
Median monthly housing costs ($)
Median household income for houses/condos with a mortgage ($)
Median household income for houses/condos without a mortgage ($)
Median household income ($)
Median household income ($) - White
Median household income ($) - Black or African American
Median household income ($) - Asian
Median household income ($) - Hispanic or Latino
Median household income ($) - American Indian and Alaska Native
Median household income ($) - Multirace
Median household income ($) - Other Race
Mortgage status - with mortgage (%)
Mortgage status - with second mortgage (%)
Mortgage status - with home equity loan (%)
Mortgage status - with both second mortgage and home equity loan (%)
Mortgage status - without a mortgage (%)
Median year house/condo built
Median year apartment built
Household type by relationship - Male householder living alone (%)
Household type by relationship - Male householder not living alone (%)
Household type by relationship - Female householder living alone (%)
Household type by relationship - Female householder not living alone (%)
Household type by relationship - Opposite-Sex spouse (%)
Household type by relationship - Same-Sex spouse (%)
Household type by relationship - Opposite-Sex unmarried partner (%)
Household type by relationship - Same-Sex unmarried partner (%)
Household type by relationship - In group quarters (%)
Size of family households - 2-person household (%)
Size of family households - 3-person household (%)
Size of family households - 4-person household (%)
Size of family households - 5-person household (%)
Size of family households - 6-person household (%)
Size of family households - 7-or-more-person household (%)
Size of nonfamily households - 1-person household (%)
Size of nonfamily households - 2-person household (%)
Size of nonfamily households - 3-person household (%)
Size of nonfamily households - 4-person household (%)
Size of nonfamily households - 5-person household (%)
Size of nonfamily households - 6-person household (%)
Size of nonfamily households - 7-or-moreperson household (%)
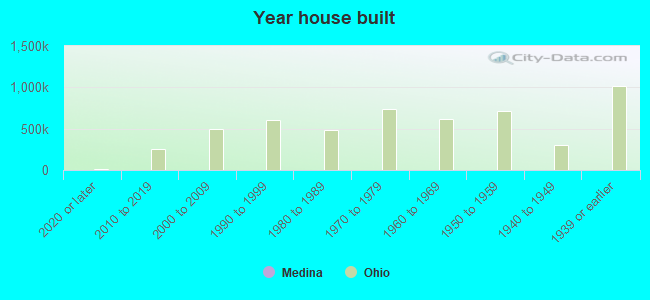
Year house built - Built 2010 or later (%)
Year house built - Built 2000 to 2009 (%)
Year house built - Built 1990 to 1999 (%)
Year house built - Built 1980 to 1989 (%)
Year house built - Built 1970 to 1979 (%)
Year house built - Built 1960 to 1969 (%)
Year house built - Built 1950 to 1959 (%)
Year house built - Built 1940 to 1949 (%)
Year house built - Built 1939 or earlier (%)
Median number of rooms in houses and condos
Median number of rooms in apartments
Median number of bedrooms in owner occupied houses
Mean number of bedrooms in owner occupied houses
Median number of bedrooms in renter occupied houses
Mean number of bedrooms in renter occupied houses
Median number of vehichles in owner occupied houses
Mean number of vehichles in owner occupied houses
Median number of vehichles in renter occupied houses
Mean number of vehichles in renter occupied houses
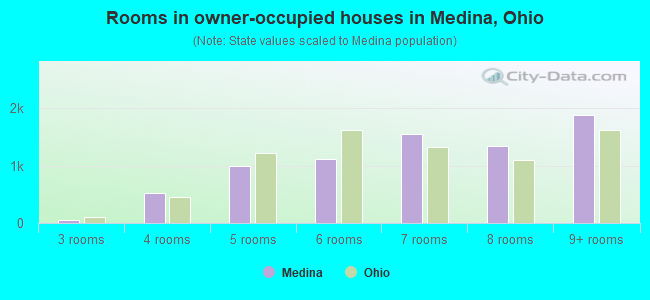
Rooms in owner-occupied houses - 1 room (%)
Rooms in owner-occupied houses - 2 rooms (%)
Rooms in owner-occupied houses - 3 rooms (%)
Rooms in owner-occupied houses - 4 rooms (%)
Rooms in owner-occupied houses - 5 rooms (%)
Rooms in owner-occupied houses - 6 rooms (%)
Rooms in owner-occupied houses - 7 rooms (%)
Rooms in owner-occupied houses - 8 rooms (%)
Rooms in owner-occupied houses - 9+ rooms (%)
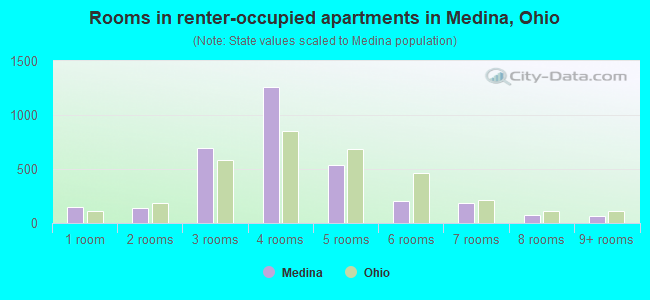
Rooms in renter-occupied houses - 1 room (%)
Rooms in renter-occupied houses - 2 rooms (%)
Rooms in renter-occupied houses - 3 rooms (%)
Rooms in renter-occupied houses - 4 rooms (%)
Rooms in renter-occupied houses - 5 rooms (%)
Rooms in renter-occupied houses - 6 rooms (%)
Rooms in renter-occupied houses - 7 rooms (%)
Rooms in renter-occupied houses - 8 rooms (%)
Rooms in renter-occupied houses - 9+ rooms (%)
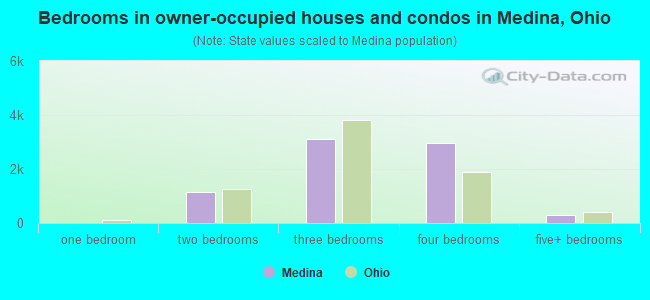
Bedrooms in owner-occupied houses - no bedrooms (%)
Bedrooms in owner-occupied houses - 1 bedroom (%)
Bedrooms in owner-occupied houses - 2 bedrooms (%)
Bedrooms in owner-occupied houses - 3 bedrooms (%)
Bedrooms in owner-occupied houses - 4 bedrooms (%)
Bedrooms in owner-occupied houses - 5+ bedrooms (%)
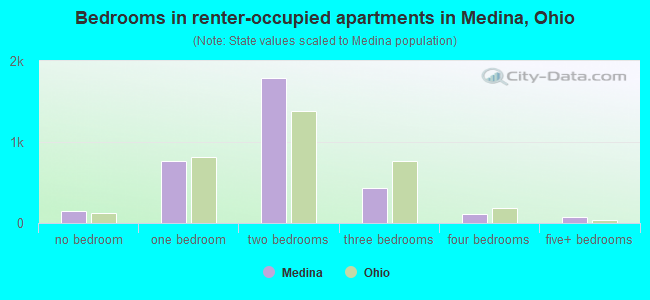
Bedrooms in renter-occupied houses - no bedrooms (%)
Bedrooms in renter-occupied houses - 1 bedroom (%)
Bedrooms in renter-occupied houses - 2 bedrooms (%)
Bedrooms in renter-occupied houses - 3 bedrooms (%)
Bedrooms in renter-occupied houses - 4 bedrooms (%)
Bedrooms in renter-occupied houses - 5+ bedrooms (%)
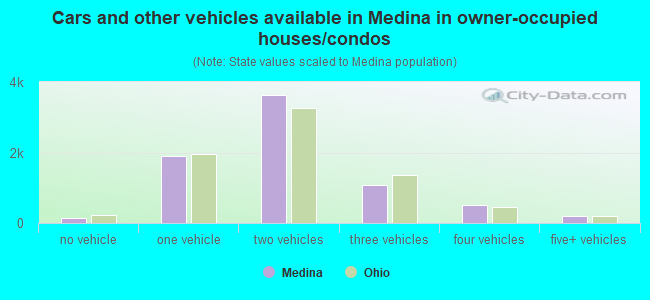
Vehicles available in owner-occupied houses - no vehicle available (%)
Vehicles available in owner-occupied houses - 1 vehicle available(%)
Vehicles available in owner-occupied houses - 2 Vehicles available (%)
Vehicles available in owner-occupied houses - 3 Vehicles available (%)
Vehicles available in owner-occupied houses - 4 Vehicles available (%)
Vehicles available in owner-occupied houses - 5+ Vehicles available (%)
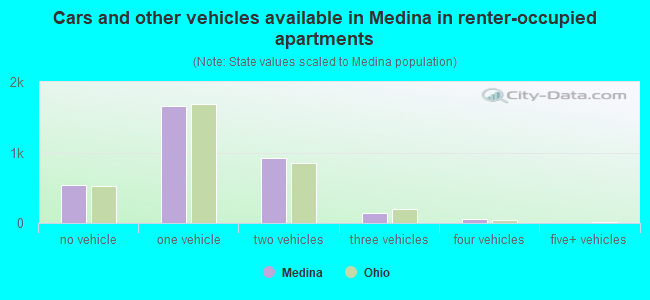
Vehicles available in renter-occupied houses - no vehicle available (%)
Vehicles available in renter-occupied houses - 1 vehicle available (%)
Vehicles available in renter-occupied houses - 2 Vehicles available (%)
Vehicles available in renter-occupied houses - 3 Vehicles available (%)
Vehicles available in renter-occupied houses - 4 Vehicles available (%)
Vehicles available in renter-occupied houses - 5+ Vehicles available (%)
Housing units in structures - 1, detached (%)
Housing units in structures - 1, attached (%)
Housing units in structures - 2 (%)
Housing units in structures - 3 or 4 (%)
Housing units in structures - 5 to 9 (%)
Housing units in structures - 10 to 19 (%)
Housing units in structures - 20 to 49 (%)
Housing units in structures - 50 or more (%)
Housing units in structures - Mobile home (%)
Housing units in structures - Boat, RV, van, etc. (%)
Housing units in structures - Owners - 1, detached (%)
Housing units in structures - Owners - 1, attached (%)
Housing units in structures - Owners - 2 (%)
Housing units in structures - Owners - 3 or 4 (%)
Housing units in structures - Owners - 5 to 9 (%)
Housing units in structures - Owners - 10 to 19 (%)
Housing units in structures - Owners - 20 to 49 (%)
Housing units in structures - Owners - 50 or more (%)
Housing units in structures - Owners - Mobile home (%)
Housing units in structures - Owners - Boat, RV, van, etc. (%)
Housing units in structures - Renters - 1, detached (%)
Housing units in structures - Renters - 1, attached (%)
Housing units in structures - Renters - 2 (%)
Housing units in structures - Renters - 3 or 4 (%)
Housing units in structures - Renters - 5 to 9 (%)
Housing units in structures - Renters - 10 to 19 (%)
Housing units in structures - Renters - 20 to 49 (%)
Housing units in structures - Renters - 50 or more (%)
Housing units in structures - Renters - Mobile home (%)
Housing units in structures - Renters - Boat, RV, van, etc. (%)
House/condo owner moved in on average (years ago)
Renter moved in on average (years ago)
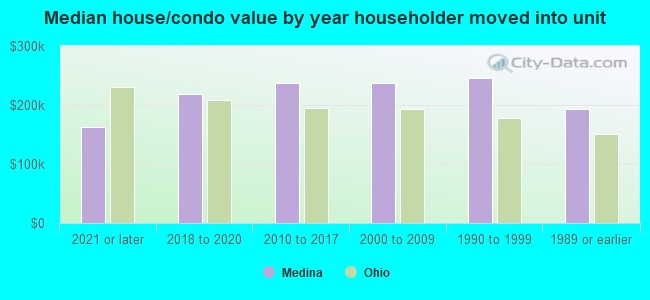
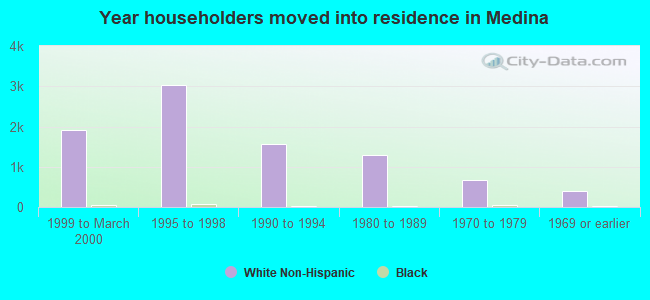
Year householder moved into unit - Moved in 1999 to March 2000 (%)
Year householder moved into unit - Moved in 1999 to March 2000 (%) - White
Year householder moved into unit - Moved in 1999 to March 2000 (%) - Black or African American
Year householder moved into unit - Moved in 1999 to March 2000 (%) - Asian
Year householder moved into unit - Moved in 1999 to March 2000 (%) - Hispanic or Latino
Year householder moved into unit - Moved in 1999 to March 2000 (%) - American Indian and Alaska Native
Year householder moved into unit - Moved in 1999 to March 2000 (%) - Multirace
Year householder moved into unit - Moved in 1999 to March 2000 (%) - Other Race
Year householder moved into unit - Moved in 1995 to 1998 (%)
Year householder moved into unit - Moved in 1995 to 1998 (%) - White
Year householder moved into unit - Moved in 1995 to 1998 (%) - Black or African American
Year householder moved into unit - Moved in 1995 to 1998 (%) - Asian
Year householder moved into unit - Moved in 1995 to 1998 (%) - Hispanic or Latino
Year householder moved into unit - Moved in 1995 to 1998 (%) - American Indian and Alaska Native
Year householder moved into unit - Moved in 1995 to 1998 (%) - Multirace
Year householder moved into unit - Moved in 1995 to 1998 (%) - Other Race
Year householder moved into unit - Moved in 1990 to 1994 (%)
Year householder moved into unit - Moved in 1990 to 1994 (%) - White
Year householder moved into unit - Moved in 1990 to 1994 (%) - Black or African American
Year householder moved into unit - Moved in 1990 to 1994 (%) - Asian
Year householder moved into unit - Moved in 1990 to 1994 (%) - Hispanic or Latino
Year householder moved into unit - Moved in 1990 to 1994 (%) - American Indian and Alaska Native
Year householder moved into unit - Moved in 1990 to 1994 (%) - Multirace
Year householder moved into unit - Moved in 1990 to 1994 (%) - Other Race
Year householder moved into unit - Moved in 1980 to 1989 (%)
Year householder moved into unit - Moved in 1980 to 1989 (%) - White
Year householder moved into unit - Moved in 1980 to 1989 (%) - Black or African American
Year householder moved into unit - Moved in 1980 to 1989 (%) - Asian
Year householder moved into unit - Moved in 1980 to 1989 (%) - Hispanic or Latino
Year householder moved into unit - Moved in 1980 to 1989 (%) - American Indian and Alaska Native
Year householder moved into unit - Moved in 1980 to 1989 (%) - Multirace
Year householder moved into unit - Moved in 1980 to 1989 (%) - Other Race
Year householder moved into unit - Moved in 1970 to 1979 (%)
Year householder moved into unit - Moved in 1970 to 1979 (%) - White
Year householder moved into unit - Moved in 1970 to 1979 (%) - Black or African American
Year householder moved into unit - Moved in 1970 to 1979 (%) - Asian
Year householder moved into unit - Moved in 1970 to 1979 (%) - Hispanic or Latino
Year householder moved into unit - Moved in 1970 to 1979 (%) - American Indian and Alaska Native
Year householder moved into unit - Moved in 1970 to 1979 (%) - Multirace
Year householder moved into unit - Moved in 1970 to 1979 (%) - Other Race
Year householder moved into unit - Moved in 1969 or earlier (%)
Year householder moved into unit - Moved in 1969 or earlier (%) - White
Year householder moved into unit - Moved in 1969 or earlier (%) - Black or African American
Year householder moved into unit - Moved in 1969 or earlier (%) - Asian
Year householder moved into unit - Moved in 1969 or earlier (%) - Hispanic or Latino
Year householder moved into unit - Moved in 1969 or earlier (%) - American Indian and Alaska Native
Year householder moved into unit - Moved in 1969 or earlier (%) - Multirace
Year householder moved into unit - Moved in 1969 or earlier (%) - Other Race
Housing units lacking complete plumbing facilities (%)
Housing units lacking complete kitchen facilities (%)
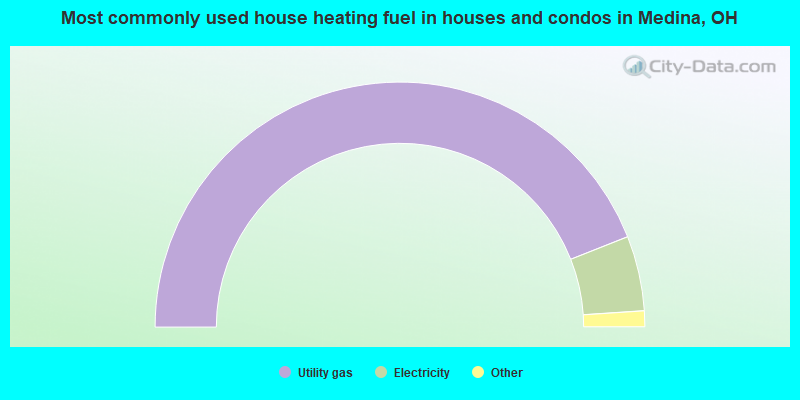
House heating fuel used in houses and condos - Utility gas (%)
House heating fuel used in houses and condos - Bottled, tank, or LP gas (%)
House heating fuel used in houses and condos - Electricity (%)
House heating fuel used in houses and condos - Fuel oil, kerosene, etc. (%)
House heating fuel used in houses and condos - Coal or coke (%)
House heating fuel used in houses and condos - Wood (%)
House heating fuel used in houses and condos - Solar energy (%)
House heating fuel used in houses and condos - Other fuel (%)
House heating fuel used in houses and condos - No fuel used (%)
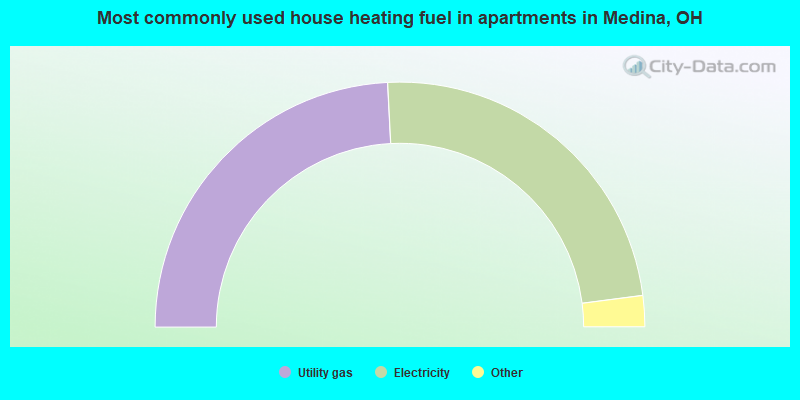
House heating fuel used in apartments - Utility gas (%)
House heating fuel used in apartments - Bottled, tank, or LP gas (%)
House heating fuel used in apartments - Electricity (%)
House heating fuel used in apartments - Fuel oil, kerosene, etc. (%)
House heating fuel used in apartments - Coal or coke (%)
House heating fuel used in apartments - Wood (%)
House heating fuel used in apartments - Solar energy (%)
House heating fuel used in apartments - Other fuel (%)
House heating fuel used in apartments - No fuel used (%)
Latest news about housing in Medina, OH collected exclusively by city-data.com from local newspapers, TV, and radio stations
Median year house/condo built: 1981Median year apartment built: 1977Household type by relationship:
Households: 26,258
Male householders: 5,002 (891 living alone ), Female householders: 5,685 (1,996 living alone )5,369 spouses (5,331 opposite-sex spouses ), 849 unmarried partners , (843 opposite-sex unmarried partners ), 7,636 children (6,978 natural , 42 adopted , 615 stepchildren ), 295 grandchildren , 141 brothers or sisters , 124 parents , 58 foster children , 185 other relatives , 412 non-relatives In group quarters: 497
Size of family households: 3,473 2-persons , 1,829 3-persons , 1,058 4-persons , 559 5-persons , 159 6-persons , 51 7-or-more-persons .
Size of nonfamily households: 3,308 1-person , 395 2-persons , 16 3-persons , 6 5-persons , 17 6-persons .
3,786 married couples with children. single-parent households (479 men , 1,339 women ).
96.1% of residents of Medina speak English at home. of residents speak Spanish at home (79% speak English very well , 19% speak English well , 2% speak English not well ).of residents speak other Indo-European language at home (74% speak English very well , 17% speak English well , 9% speak English not well ).of residents speak Asian or Pacific Island language at home (92% speak English very well , 8% speak English well ).
Foreign born population: 701 (2.7%)of them are naturalized citizens )
Median number of rooms in houses and condos:
Median number of rooms in apartments
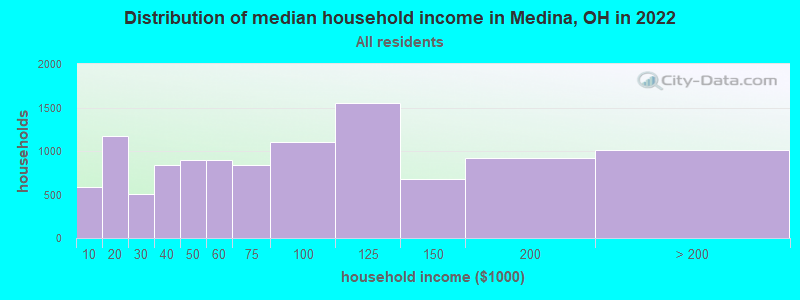
Medina, OH household income distribution 586 Less than $10,0001,175 $10,000 to $19,999509 $20,000 to $29,999843 $30,000 to $39,999894 $40,000 to $49,999901 $50,000 to $59,999839 $60,000 to $74,9991,108 $75,000 to $99,9991,551 $100,000 to $124,999681 $125,000 to $149,999919 $150,000 to $199,9991,013 $200,000 or more
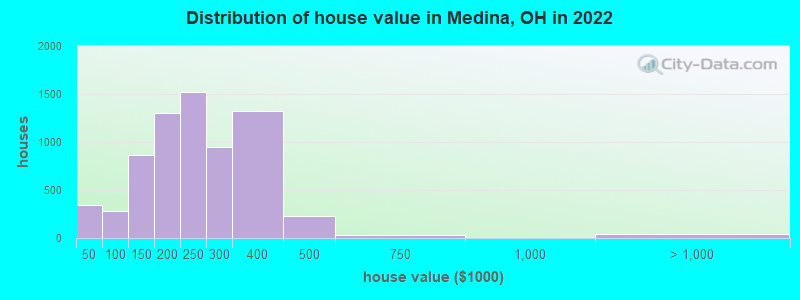
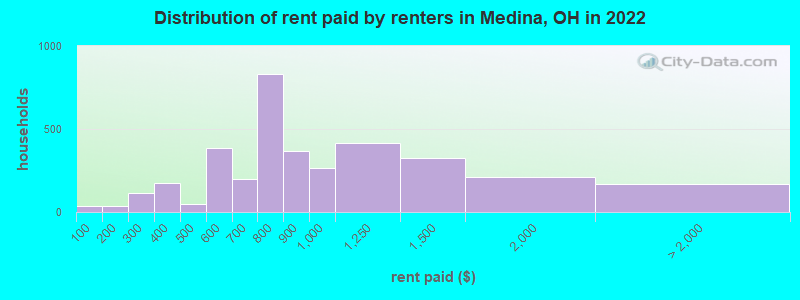
Home value of owner - occupied houses in 2022 in Medina, OH 18 Less than $10,00042 $10,000 to $14,999116 $15,000 to $19,99967 $20,000 to $24,99920 $25,000 to $29,99954 $30,000 to $34,99923 $35,000 to $39,99924 $50,000 to $59,99947 $60,000 to $69,99953 $70,000 to $79,99964 $80,000 to $89,99994 $90,000 to $99,999252 $100,000 to $124,999610 $125,000 to $149,999558 $150,000 to $174,999746 $175,000 to $199,9991,517 $200,000 to $249,999952 $250,000 to $299,9991,328 $300,000 to $399,999226 $400,000 to $499,99935 $500,000 to $749,99939 $2,000,000 or moreRent paid by renters in 2022 in Medina, OH 39 Less than $10036 $150 to $19959 $200 to $24956 $250 to $29960 $300 to $349114 $350 to $39911 $400 to $44935 $450 to $499154 $500 to $549228 $550 to $59939 $600 to $649160 $650 to $699379 $700 to $749451 $750 to $799367 $800 to $899263 $900 to $999413 $1,000 to $1,249324 $1,250 to $1,499213 $1,500 to $1,999104 $2,000 to $2,49917 $3,000 to $3,49946 No cash rent
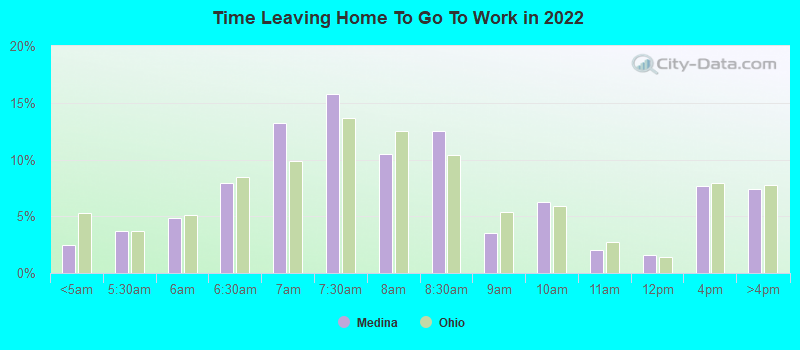
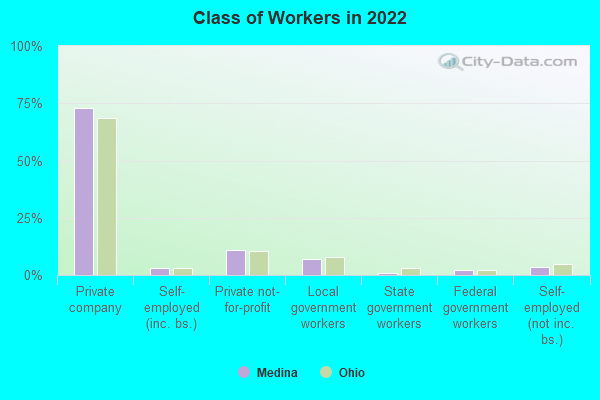
Percentage of workers working in this county: 61.9%Number of people working at home: 1,928 (14.2% of all workers )
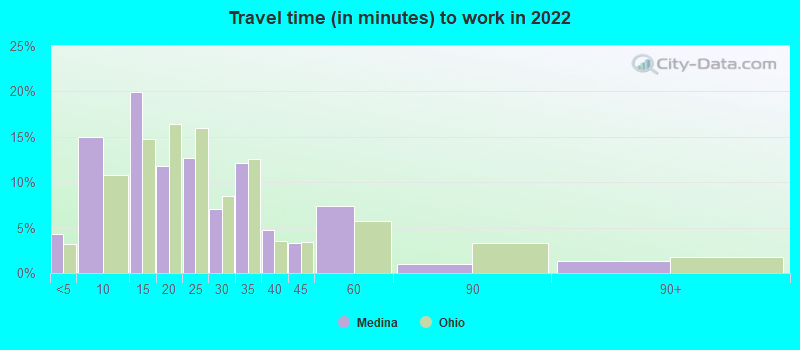
Travel time to work (commute)
Less than 5 minutes: 4405 to 9 minutes: 1,90810 to 14 minutes: 2,19515 to 19 minutes: 1,05620 to 24 minutes: 86025 to 29 minutes: 45430 to 34 minutes: 1,26035 to 39 minutes: 55340 to 44 minutes: 65545 to 59 minutes: 1,39960 to 89 minutes: 74190 or more minutes: 43
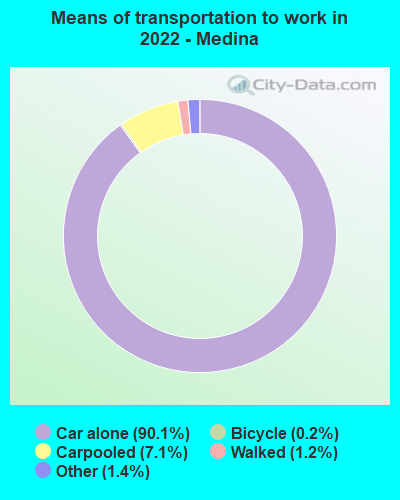
Means of transportation to work:
Drove a car alone: 14,027 (79.2%)Carpooled: 1,182 (6.7%)Taxi: 258 (1.5%)Bicycle: 36 (0.2%)Walked: 189 (1.1%)Worked at home: 1,928 (10.9%)
Unemployment by race in 2022
Unemployment rate for White non-Hispanic residents 6.3% Males3.1% FemalesUnemployment rate for Black residents 5.4% Males31.0% FemalesUnemployment rate for two or more race residents 21.2% Males4.6% FemalesUnemployment rate for Hispanic or Latino residents 4.5% Females
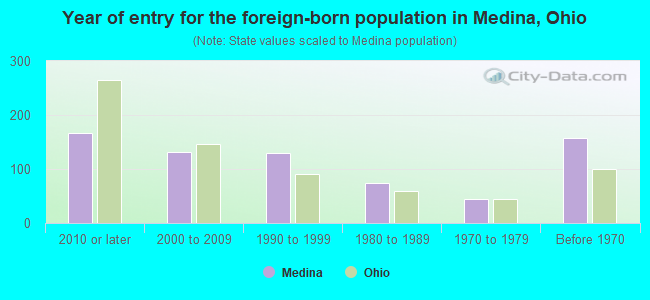
Year of entry for the foreign-born population in Medina, Ohio
167 2010 or later 131 2000 to 2009 130 1990 to 1999 74 1980 to 1989 45 1970 to 1979 158 Before 1970
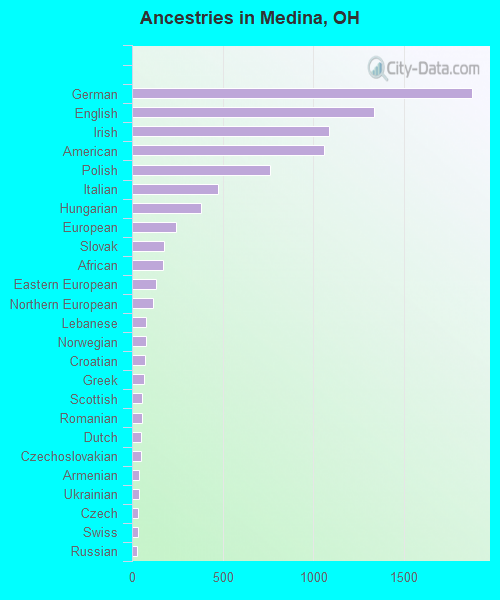
First ancestries reported:
German: 1,876 (17.9%)
English: 1,336 (12.7%)
Irish: 1,086 (10.4%)
American: 1,060 (10.1%)
Polish: 763 (7.3%)
Italian: 475 (4.5%)
Hungarian: 378 (3.6%)
European: 241 (2.3%)
Slovak: 178 (1.7%)
African: 169 (1.6%)
Eastern European: 131 (1.2%)
Northern European: 116 (1.1%)
Lebanese: 80 (0.8%)
Norwegian: 79 (0.8%)
Croatian: 70 (0.7%)
Greek: 68 (0.6%)
Scottish: 56 (0.5%)
Romanian: 53 (0.5%)
Dutch: 51 (0.5%)
Czechoslovakian: 49 (0.5%)
Armenian: 40 (0.4%)
Ukrainian: 40 (0.4%)
Czech: 35 (0.3%)
Swiss: 34 (0.3%)
Russian: 30 (0.3%)
British: 29 (0.3%)
Scotch-Irish: 29 (0.3%)
Celtic: 29 (0.3%)
Canadian: 26 (0.2%)
Pennsylvania German: 25 (0.2%)
Slavic: 20 (0.2%)
French Canadian: 19 (0.2%)
Serbian: 19 (0.2%)
Welsh: 14 (0.1%)
Scandinavian: 12 (0.1%)
Finnish: 10 (0.10%)
Swedish: 10 (0.10%)
Portuguese: 9 (0.09%)
French: 6 (0.06%)
Slovene: 6 (0.06%)
Lithuanian: 5 (0.05%)
Ethiopian: 3 (0.03%)
Arab: 1 (0.01%) Most common places of birth for foreign-born residents (%): Ivory Coast Medina:
12.3% (74)Ohio:
0.3% (1,682)
Canada Medina:
10.9% (66)Ohio:
2.6% (14,988)
Argentina Medina:
8.6% (52)Ohio:
0.3% (1,447)
Ukraine Medina:
7.1% (43)Ohio:
1.7% (9,564)
El Salvador Medina:
7.1% (43)Ohio:
1.4% (7,947)
Philippines Medina:
6.1% (37)Ohio:
3.1% (17,818)
Germany Medina:
5.5% (33)Ohio:
2.2% (12,846)
Croatia Medina:
5.5% (33)Ohio:
0.4% (2,185)
India Medina:
4.6% (28)Ohio:
11.6% (66,525)
Tanzania Medina:
4.6% (28)Ohio:
0.2% (1,305)
Colombia Medina:
4.0% (24)Ohio:
0.8% (4,549)
Mexico Medina:
3.3% (20)Ohio:
7.8% (44,796)
Ecuador Medina:
3.3% (20)Ohio:
0.3% (1,918)
Nicaragua Medina:
2.3% (14)Ohio:
0.2% (1,250)
Venezuela Medina:
2.3% (14)Ohio:
0.7% (3,920)
Romania Medina:
1.7% (10)Ohio:
1.1% (6,346)
Place of birth for U.S.-born residents:
This state: 19,722Other state: 5,557Northeast: 1,994Midwest: 1,606South: 1,396West: 523 90.7% of Medina residents lived in the same house 1 years ago.
Out of people who lived in different houses, 30.8% lived in this county.
Out of people who lived in different counties, 74.2% lived in Ohio.
Medina:
90.7%State average:
87.8%
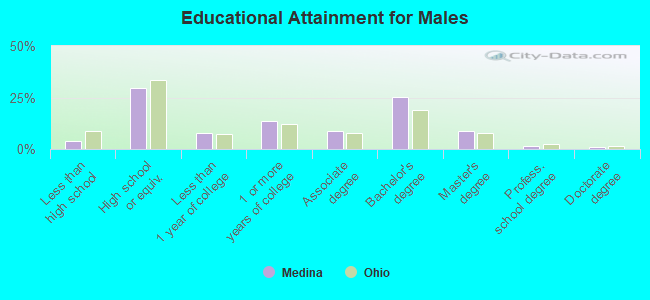
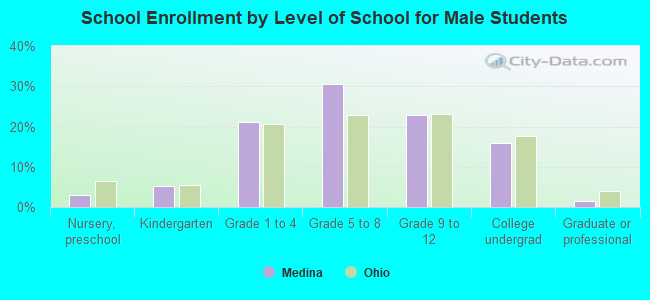
Education attainment for males 25 years and older:
No schooling: 49Nursery to 4th grade: 05th and 6th grade: 07th and 8th grade: 09th grade: 6810th grade: 4111th grade: 7812th grade, no diploma: 112High school graduate (or equivalency): 2,571Less than 1 year of college: 690Some college more than 1 year, no degree: 1,155Associate degree: 740Bachelor's degree: 2,163Master's degree: 759Professional school degree: 127Doctorate degree: 85
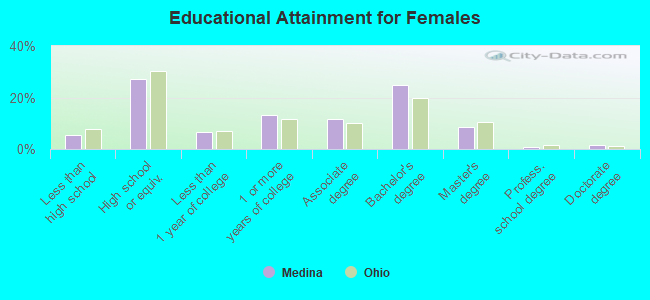
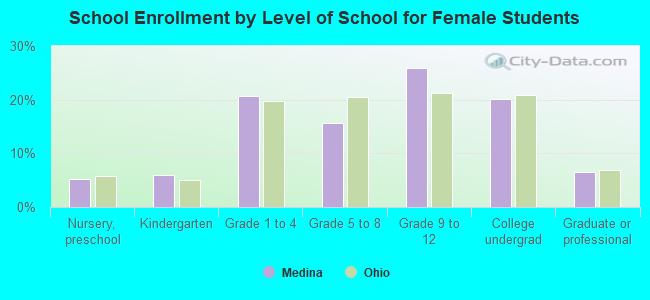
Education attainment for females 25 years and older:
No schooling: 31Nursery to 4th grade: 05th and 6th grade: 07th and 8th grade: 1659th grade: 2110th grade: 3611th grade: 22512th grade, no diploma: 35High school graduate (or equivalency): 2,599Less than 1 year of college: 622Some college more than 1 year, no degree: 1,274Associate degree: 1,134Bachelor's degree: 2,406Master's degree: 820Professional school degree: 87Doctorate degree: 152
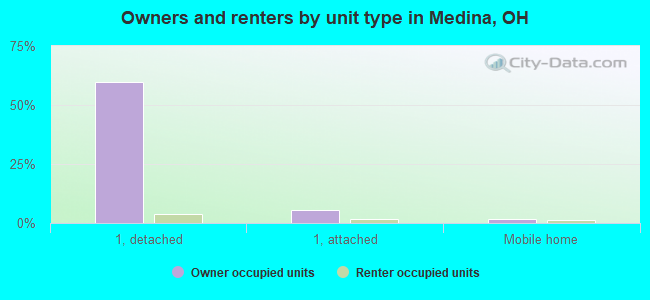
Housing units in structures:
One, detached: 7,168One, attached: 936Two: 3933 or 4: 3135 to 9: 89910 to 19: 51220 to 49: 33350 or more: 390Mobile homes: 342Median worth of mobile homes: $18,752
Housing units lacking complete plumbing facilities in 2022: 0.2%Housing units lacking complete kitchen facilities in 2022: 1.9%House/condo owner moved in on average 11 years ago
Renter moved in on average 2 years ago
Private vs. public school enrollment:
Students in private schools in grades 1 to 8 (elementary and middle school): 370 Students in private schools in grades 9 to 12 (high school): 90 Students in private undergraduate colleges: 390