Mechanicsburg, PA (Pennsylvania) Houses and Residents
| Mechanicsburg: | $227,826 |
| Pennsylvania: | $245,500 |
Total population: 8,969 (All urban)
Houses: 4,474 (4,247 occupied: 2,909 owner occupied, 1,371 renter occupied)
| % of renters here: | 32% |
| State: | 31% |
Housing density: 1,729 houses/condos per square mile
Median price asked for vacant for-sale houses and condos in 2022 in this county: $181,892.
Median contract rent in 2022: $885 (lower quartile is $727, upper quartile is $1,071)
Median rent asked for vacant for-rent units in 2022: $787
Median gross rent in Mechanicsburg, PA in 2022: $1,004
Housing units in Mechanicsburg with a mortgage: 1,890 (401 second mortgage, 0 home equity loan, 342 both second mortgage and home equity loan)
Houses without a mortgage: 137
Median household income for houses/condos with a mortgage: $91,667
Median household income for apartments without a mortgage: $62,141
Median monthly housing costs: $1,131
Compare current foreclosures in Mechanicsburg, PA:
| Photo | Address | Area | Beds / Baths | Price | Details |
|---|---|---|---|---|---|

|
#1
Lancaster Blvd Apt 11
Mechanicsburg, PA 17055
|
1,214 sq. feet
|
2 baths 2 beds |
show details | |

|
#2
Franklin Ave
Mechanicsburg, PA 17050
|
1,520 sq. feet
|
2 baths 3 beds |
show details | |

|
#3
Carlisle Pike
Mechanicsburg, PA 17050
|
2,176 sq. feet
|
1 baths 3 beds |
show details | |

|
#4
Nixon Dr
Mechanicsburg, PA 17055
|
2,020 sq. feet
|
1 baths 3 beds |
show details | |

|
#5
Warwick Cir
Mechanicsburg, PA 17050
|
- sq. feet
|
- baths - beds |
show details | |

|
#6
S Sporting Hill Rd
Mechanicsburg, PA 17050
|
- sq. feet
|
- baths - beds |
show details | |

|
#7
Rye Cir
Mechanicsburg, PA 17055
|
2,006 sq. feet
|
- baths - beds |
show details | |

|
#8
Brook Cir
Mechanicsburg, PA 17050
|
- sq. feet
|
- baths - beds |
show details | |

|
#9
Stonehedge Ln
Mechanicsburg, PA 17055
|
1,540 sq. feet
|
- baths - beds |
show details | |

|
#10
Allenview Dr
Mechanicsburg, PA 17055
|
1,152 sq. feet
|
- baths - beds |
show details |
| Photo | Address | Area | Beds / Baths | Price | Details |
|---|---|---|---|---|---|

|
#11
Garden Dr
Mechanicsburg, PA 17055
|
- sq. feet
|
- baths - beds |
show details | |

|
#12
Cross Creek Dr
Mechanicsburg, PA 17050
|
1,864 sq. feet
|
- baths - beds |
show details | |

|
#13
Ellesmere Ln
Mechanicsburg, PA 17055
|
- sq. feet
|
- baths - beds |
show details | |

|
#14
Nantucket Dr
Mechanicsburg, PA 17050
|
- sq. feet
|
- baths - beds |
show details | |

|
#15
W Keller St
Mechanicsburg, PA 17055
|
- sq. feet
|
- baths - beds |
show details | |

|
#16
Adeline Dr
Mechanicsburg, PA 17050
|
4,911 sq. feet
|
- baths - beds |
show details | |

|
#17
John King Ln
Mechanicsburg, PA 17050
|
- sq. feet
|
- baths - beds |
show details | |

|
#18
Apple Dr
Mechanicsburg, PA 17055
|
1,610 sq. feet
|
- baths - beds |
show details | |

|
#19
Allenview Dr
Mechanicsburg, PA 17055
|
1,152 sq. feet
|
- baths - beds |
show details | |

|
#20
Carmella Dr
Mechanicsburg, PA 17050
|
- sq. feet
|
- baths - beds |
show details |
| Photo | Address | Area | Beds / Baths | Price | Details |
|---|---|---|---|---|---|

|
#21
Apple Cir Apt 188
Mechanicsburg, PA 17055
|
- sq. feet
|
- baths - beds |
show details | |

|
#22
Franklin Ave
Mechanicsburg, PA 17050
|
1,520 sq. feet
|
- baths - beds |
show details | |

|
#23
White Birch Ave
Mechanicsburg, PA 17050
|
1,120 sq. feet
|
- baths - beds |
show details | |

|
#24
Allenview Dr
Mechanicsburg, PA 17055
|
1,360 sq. feet
|
- baths - beds |
show details | |

|
#25
Mountain View Rd
Mechanicsburg, PA 17050
|
1,914 sq. feet
|
- baths - beds |
show details | |

|
#26
Independence Ct
Mechanicsburg, PA 17050
|
- sq. feet
|
- baths - beds |
show details | |

|
#27
Pinnacle Ridge Dr, Apt 204
Mechanicsburg, PA 17055
|
- sq. feet
|
- baths - beds |
show details | |

|
#28
Allenview Dr
Mechanicsburg, PA 17055
|
1,088 sq. feet
|
- baths - beds |
show details | |

|
#29
W Simpson St
Mechanicsburg, PA 17055
|
1,640 sq. feet
|
- baths - beds |
show details | |

|
#30
York Cir
Mechanicsburg, PA 17050
|
1,725 sq. feet
|
- baths - beds |
show details |
| Photo | Address | Area | Beds / Baths | Price | Details |
|---|---|---|---|---|---|

|
#31
Lancaster Blvd
Mechanicsburg, PA 17055
|
714 sq. feet
|
- baths - beds |
show details | |

|
#32
Lancaster Blvd
Mechanicsburg, PA 17055
|
1,460 sq. feet
|
- baths - beds |
show details | |

|
#33
Main St
Mechanicsburg, PA 17055
|
2,459 sq. feet
|
- baths - beds |
show details | |

|
#34
Mallard Ct
Mechanicsburg, PA 17055
|
- sq. feet
|
- baths - beds |
show details | |

|
#35
Hemlock Dr
Mechanicsburg, PA 17055
|
2,170 sq. feet
|
- baths - beds |
show details | |

|
#36
S Market St
Mechanicsburg, PA 17055
|
1,169 sq. feet
|
- baths - beds |
show details | |

|
#37
Mountain View Rd
Mechanicsburg, PA 17050
|
- sq. feet
|
- baths - beds |
show details | |

|
#38
S Market St
Mechanicsburg, PA 17055
|
2,525 sq. feet
|
- baths - beds |
show details | |

|
#39
Melbourne Ln
Mechanicsburg, PA 17055
|
- sq. feet
|
- baths - beds |
show details | |

|
#40
Line Rd
Mechanicsburg, PA 17050
|
- sq. feet
|
- baths - beds |
show details |
| Photo | Address | Area | Beds / Baths | Price | Details |
|---|---|---|---|---|---|

|
#41
Peace Dr
Mechanicsburg, PA 17055
|
2,592 sq. feet
|
- baths - beds |
show details | |

|
#42
E Coover St
Mechanicsburg, PA 17055
|
1,860 sq. feet
|
- baths - beds |
show details | |

|
#43
Admirals Quay Dr
Mechanicsburg, PA 17050
|
- sq. feet
|
- baths - beds |
show details | |

|
#44
Lucinda Ln
Mechanicsburg, PA 17055
|
3,474 sq. feet
|
- baths - beds |
show details | |

|
#45
Berkshire Rd
Mechanicsburg, PA 17055
|
1,456 sq. feet
|
- baths - beds |
show details | |

|
#46
Cedar Ridge Ln
Mechanicsburg, PA 17055
|
1,576 sq. feet
|
- baths - beds |
show details | |

|
#47
State Rd
Mechanicsburg, PA 17050
|
- sq. feet
|
- baths - beds |
show details | |

|
#48
Kim Acres Dr
Mechanicsburg, PA 17055
|
1,792 sq. feet
|
- baths - beds |
show details | |

|
#49
Joshua Rd
Mechanicsburg, PA 17050
|
3,332 sq. feet
|
- baths - beds |
show details | |

|
Check over 1 million property listings on Foreclosure.com!
|
browse all offers | |||

Latest news about housing in Mechanicsburg, PA collected exclusively by city-data.com from local newspapers, TV, and radio stations


Median year apartment built: 1965
Household type by relationship:
Households: 9,665- Male householders: 2,216 (760 living alone), Female householders: 2,082 (695 living alone)
1,661 spouses (1,634 opposite-sex spouses), 274 unmarried partners, (256 opposite-sex unmarried partners), 2,598 children (2,415 natural, 66 adopted, 116 stepchildren), 381 grandchildren, 45 brothers or sisters, 24 parents, 0 foster children, 29 other relatives, 292 non-relatives
- In group quarters: 57
Size of family households: 1,531 2-persons, 515 3-persons, 281 4-persons, 167 5-persons, 51 7-or-more-persons.
Size of nonfamily households: 1,394 1-person, 279 2-persons, 30 3-persons, 52 4-persons.
1,017 married couples with children.
541 single-parent households (151 men, 390 women).
96.9% of residents of Mechanicsburg speak English at home.
0.4% of residents speak Spanish at home (100% speak English very well).
1.3% of residents speak other Indo-European language at home (89% speak English very well, 11% speak English not well).
0.6% of residents speak Asian or Pacific Island language at home (32% speak English very well, 68% speak English well).
Foreign born population: 241 (2.5%)
(92.1% of them are naturalized citizens)
| Here: | 7.2 |
| State: | 6.8 |
| Here: | 4.7 |
| State: | 4.3 |
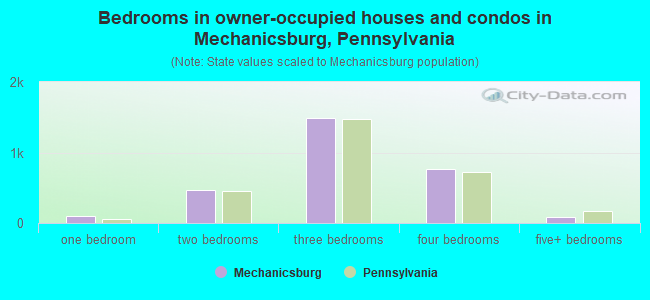
- Bedrooms in owner-occupied houses and condos in Mechanicsburg, Pennsylvania
- 0no bedroom
- 1001 bedroom
- 4652 bedrooms
- 1,4963 bedrooms
- 7594 bedrooms
- 905+ bedrooms
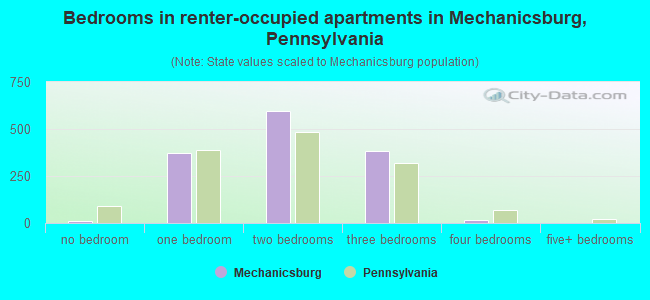
- Bedrooms in renter-occupied apartments in Mechanicsburg, Pennsylvania
- 11no bedroom
- 3711 bedroom
- 5942 bedrooms
- 3823 bedrooms
- 144 bedrooms
- 05+ bedrooms
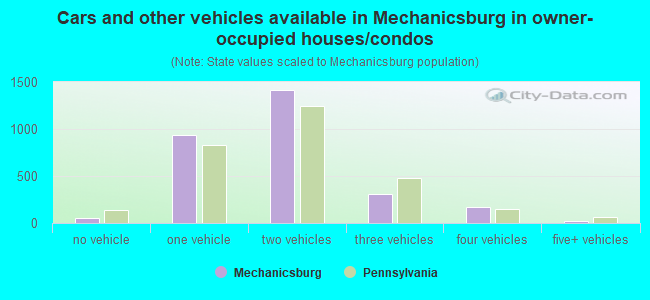
- Cars and other vehicles available in Mechanicsburg in owner-occupied houses/condos
- 51no vehicle
- 9321 vehicle
- 1,4162 vehicles
- 3123 vehicles
- 1754 vehicles
- 245+ vehicles
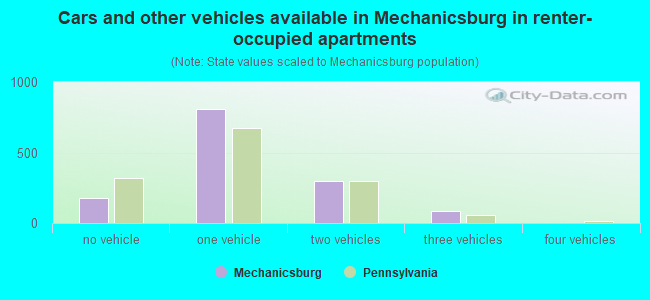
- Cars and other vehicles available in Mechanicsburg in renter-occupied apartments
- 179no vehicle
- 8121 vehicle
- 2962 vehicles
- 853 vehicles
- 04 vehicles
- 05+ vehicles
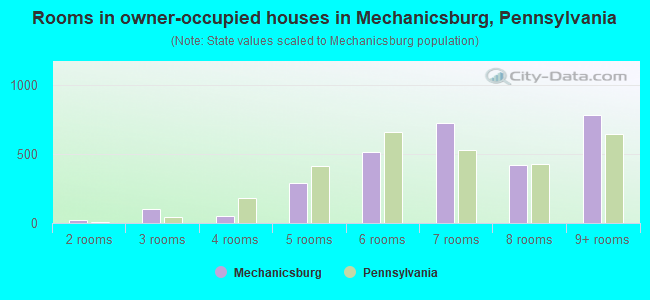
- Rooms in owner-occupied houses in Mechanicsburg, Pennsylvania
- 01 room
- 242 rooms
- 1003 rooms
- 544 rooms
- 2905 rooms
- 5156 rooms
- 7267 rooms
- 4208 rooms
- 7819+ rooms
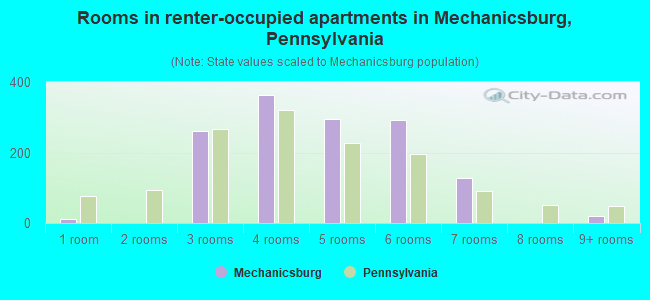
- Rooms in renter-occupied apartments in Mechanicsburg, Pennsylvania
- 111 room
- 02 rooms
- 2613 rooms
- 3644 rooms
- 2965 rooms
- 2936 rooms
- 1277 rooms
- 08 rooms
- 199+ rooms
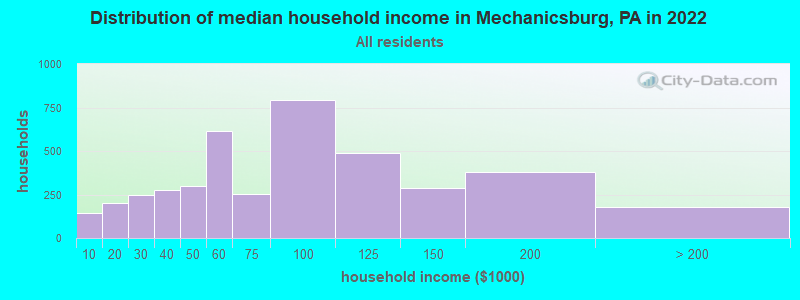
Mechanicsburg, PA household income distribution

- 144Less than $10,000
- 201$10,000 to $19,999
- 249$20,000 to $29,999
- 276$30,000 to $39,999
- 301$40,000 to $49,999
- 617$50,000 to $59,999
- 253$60,000 to $74,999
- 795$75,000 to $99,999
- 487$100,000 to $124,999
- 285$125,000 to $149,999
- 380$150,000 to $199,999
- 177$200,000 or more
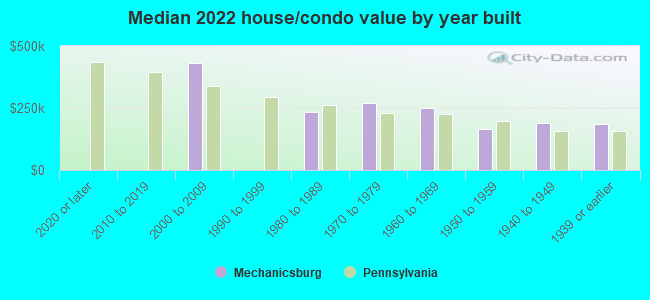
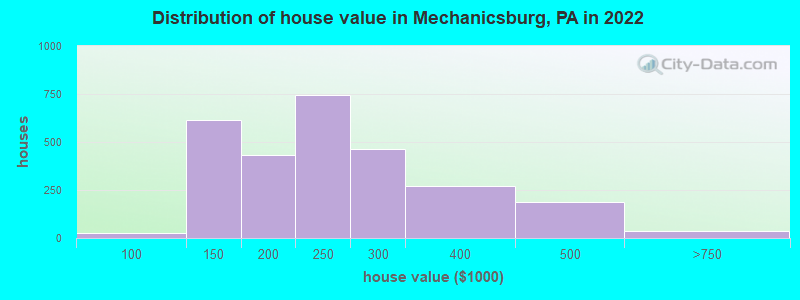
Home value of owner - occupied houses in 2022 in Mechanicsburg, PA
-
- 25$90,000 to $99,999
- 362$100,000 to $124,999
- 252$125,000 to $149,999
- 211$150,000 to $174,999
- 219$175,000 to $199,999
- 743$200,000 to $249,999
- 465$250,000 to $299,999
- 272$300,000 to $399,999
- 189$400,000 to $499,999
- 36$500,000 to $749,999
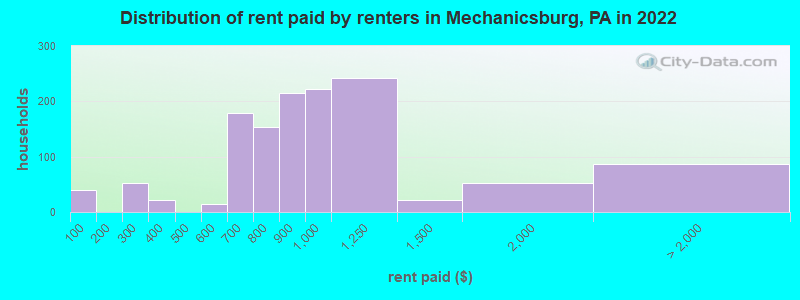
Rent paid by renters in 2022 in Mechanicsburg, PA
-
- 38Less than $100
- 51$200 to $249
- 21$300 to $349
- 13$550 to $599
- 30$600 to $649
- 149$650 to $699
- 53$700 to $749
- 99$750 to $799
- 215$800 to $899
- 221$900 to $999
- 241$1,000 to $1,249
- 20$1,250 to $1,499
- 52$1,500 to $1,999
- 7$2,000 to $2,499
- 78No cash rent
Percentage of workers working in this county: 79.4%
Number of people working at home: 1,014 (19.1% of all workers)
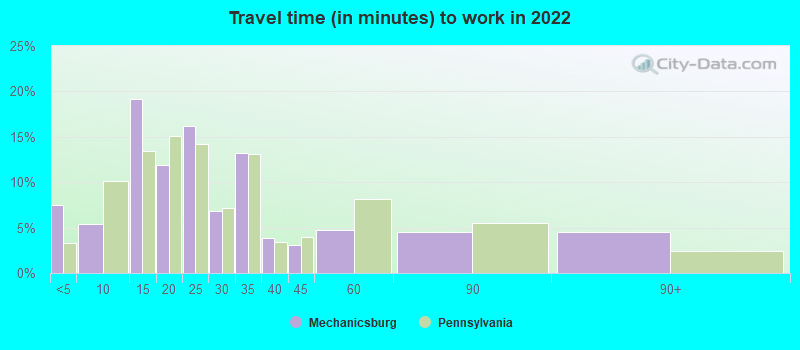
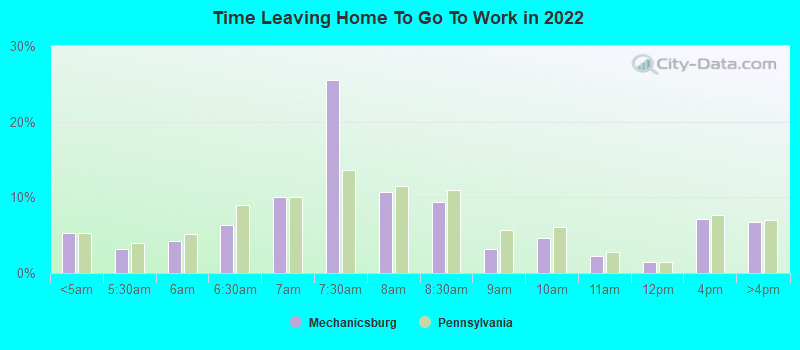
Travel time to work (commute)
- Less than 5 minutes: 134
- 5 to 9 minutes: 372
- 10 to 14 minutes: 971
- 15 to 19 minutes: 891
- 20 to 24 minutes: 589
- 25 to 29 minutes: 249
- 30 to 34 minutes: 387
- 35 to 39 minutes: 61
- 40 to 44 minutes: 49
- 45 to 59 minutes: 406
- 60 to 89 minutes: 104
- 90 or more minutes: 115
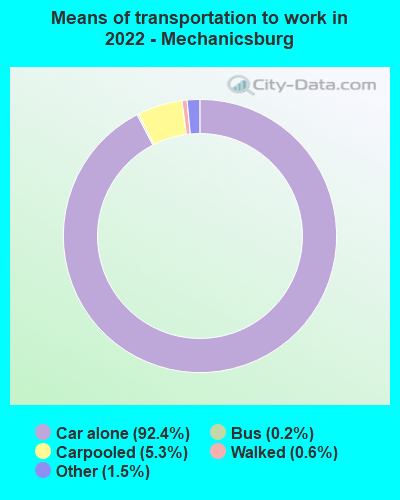
Means of transportation to work:
- Drove a car alone: 5,016 (77.1%)
- Carpooled: 275 (4.2%)
- Bus: 9 (0.1%)
- Taxi: 110 (1.7%)
- Bicycle: 2 (0.0%)
- Walked: 37 (0.6%)
- Worked at home: 1,014 (15.6%)
- Unemployment by race in 2022
- Unemployment rate for White non-Hispanic residents
- 2.4%Males
- Unemployment rate for Asian residents
- 40.2%Males
- Unemployment rate for Hispanic or Latino residents
- 50.4%Females
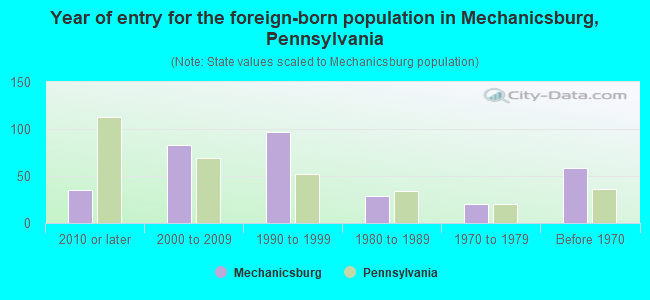
- Year of entry for the foreign-born population in Mechanicsburg, Pennsylvania
- 352010 or later
- 832000 to 2009
- 971990 to 1999
- 291980 to 1989
- 201970 to 1979
- 59Before 1970
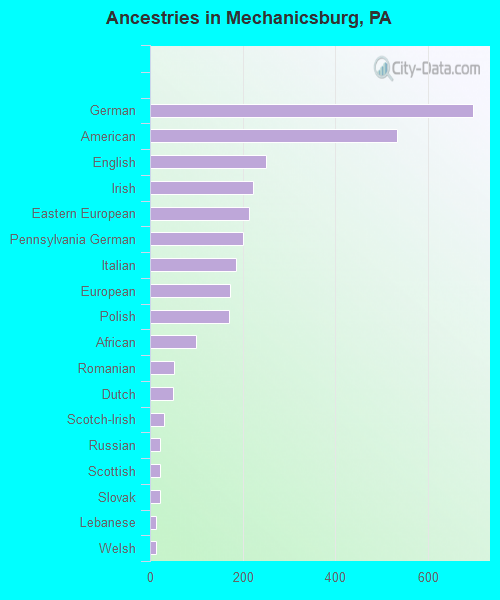
First ancestries reported:
- German: 697 (19.0%)
- American: 534 (14.5%)
- English: 251 (6.8%)
- Irish: 222 (6.0%)
- Eastern European: 214 (5.8%)
- Pennsylvania German: 200 (5.4%)
- Italian: 185 (5.0%)
- European: 172 (4.7%)
- Polish: 170 (4.6%)
- African: 99 (2.7%)
- Romanian: 52 (1.4%)
- Dutch: 49 (1.3%)
- Scotch-Irish: 31 (0.8%)
- Russian: 21 (0.6%)
- Scottish: 21 (0.6%)
- Slovak: 21 (0.6%)
- Lebanese: 14 (0.4%)
- Welsh: 14 (0.4%)
Most common places of birth for foreign-born residents (%):
| Mechanicsburg: | 31.5% (70) |
| Pennsylvania: | 0.3% (2,395) |
| Mechanicsburg: | 17.6% (39) |
| Pennsylvania: | 2.9% (27,433) |
| Mechanicsburg: | 11.7% (26) |
| Pennsylvania: | 0.6% (6,097) |
| Mechanicsburg: | 10.8% (24) |
| Pennsylvania: | 0.9% (8,772) |
| Mechanicsburg: | 10.8% (24) |
| Pennsylvania: | 1.6% (15,272) |
| Mechanicsburg: | 9.0% (20) |
| Pennsylvania: | 0.1% (738) |
| Mechanicsburg: | 8.6% (19) |
| Pennsylvania: | 1.8% (17,032) |
Place of birth for U.S.-born residents:
- This state: 7,430
- Other state: 1,887
- Northeast: 748
- Midwest: 164
- South: 900
- West: 66
91.5% of Mechanicsburg residents lived in the same house 1 years ago.
Out of people who lived in different houses, 37.9% lived in this county.
Out of people who lived in different counties, 75.1% lived in Pennsylvania.
| Mechanicsburg: | 91.5% |
| State average: | 89.3% |
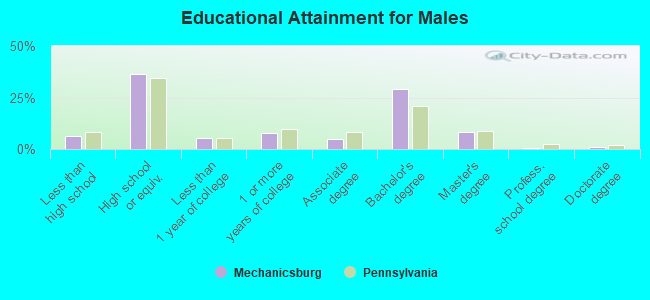
Education attainment for males 25 years and older:
- No schooling: 16
- Nursery to 4th grade: 0
- 5th and 6th grade: 0
- 7th and 8th grade: 0
- 9th grade: 50
- 10th grade: 65
- 11th grade: 9
- 12th grade, no diploma: 78
- High school graduate (or equivalency): 1,299
- Less than 1 year of college: 191
- Some college more than 1 year, no degree: 284
- Associate degree: 180
- Bachelor's degree: 1,041
- Master's degree: 294
- Professional school degree: 25
- Doctorate degree: 27
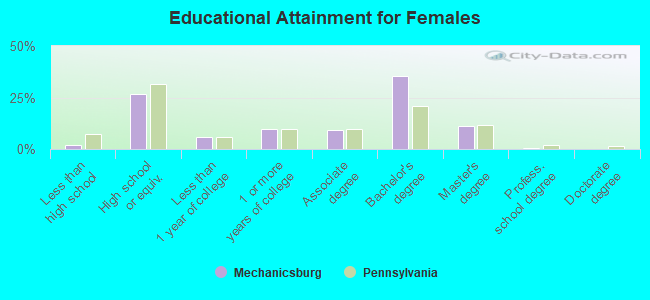
Education attainment for females 25 years and older:
- No schooling: 0
- Nursery to 4th grade: 0
- 5th and 6th grade: 0
- 7th and 8th grade: 0
- 9th grade: 12
- 10th grade: 20
- 11th grade: 28
- 12th grade, no diploma: 12
- High school graduate (or equivalency): 900
- Less than 1 year of college: 202
- Some college more than 1 year, no degree: 327
- Associate degree: 307
- Bachelor's degree: 1,205
- Master's degree: 374
- Professional school degree: 12
- Doctorate degree: 0


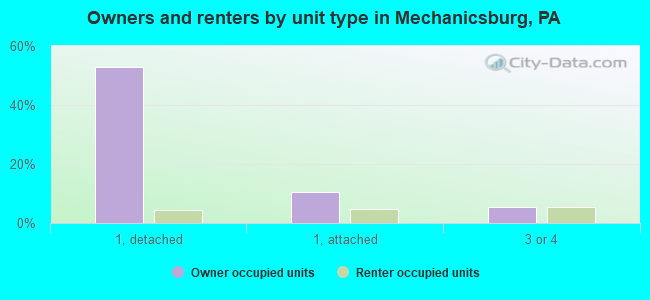
Housing units in structures:
- One, detached: 2,513
- One, attached: 706
- Two: 426
- 3 or 4: 429
- 5 to 9: 163
- 10 to 19: 74
- 20 to 49: 82
- 50 or more: 60
- Boats, RVs, vans, etc.: 16
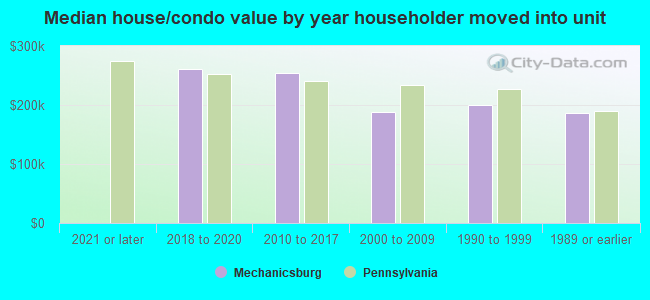
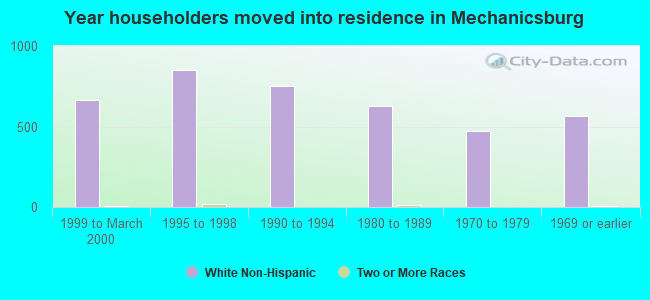
House/condo owner moved in on average 14 years ago
Renter moved in on average 6 years ago
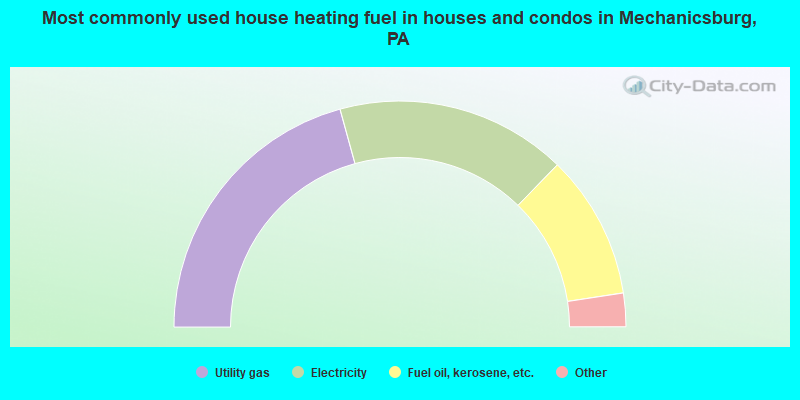
- 41.5%Utility gas
- 33.1%Electricity
- 20.7%Fuel oil, kerosene, etc.
- 3.0%Wood
- 1.1%Solar energy
- 0.7%Bottled, tank, or LP gas
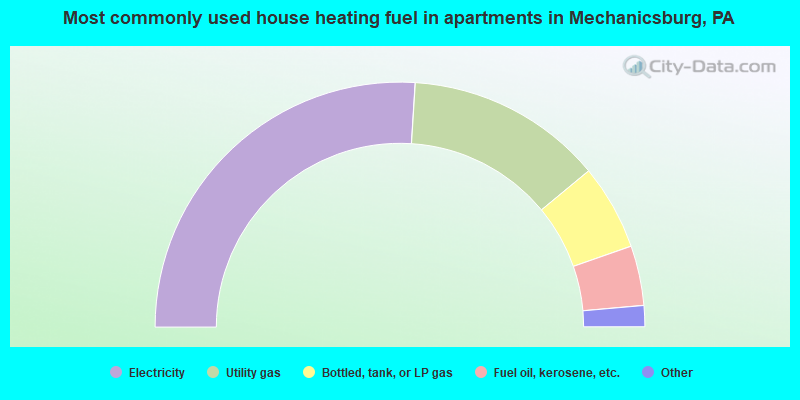
- 52.0%Electricity
- 26.0%Utility gas
- 11.3%Bottled, tank, or LP gas
- 7.9%Fuel oil, kerosene, etc.
- 1.9%Other fuel
- 0.8%No fuel used
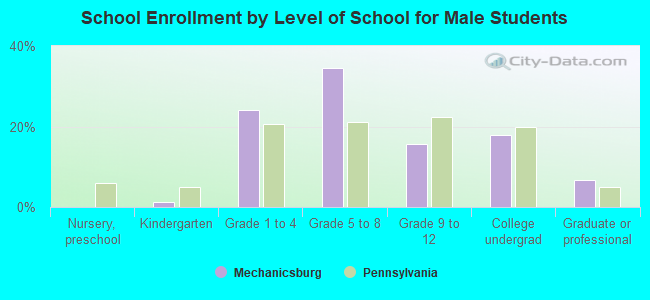
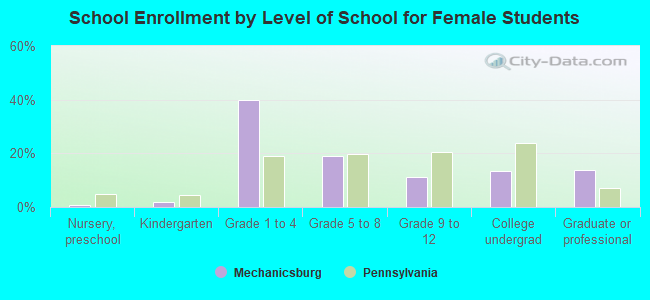
Private vs. public school enrollment:
| Here: | 5.6% |
| Pennsylvania: | 15.7% |
| Here: | 11.1% |
| Pennsylvania: | 13.4% |
| Here: | 24.4% |
| Pennsylvania: | 39.8% |