Massillon, OH (Ohio) Houses and Residents
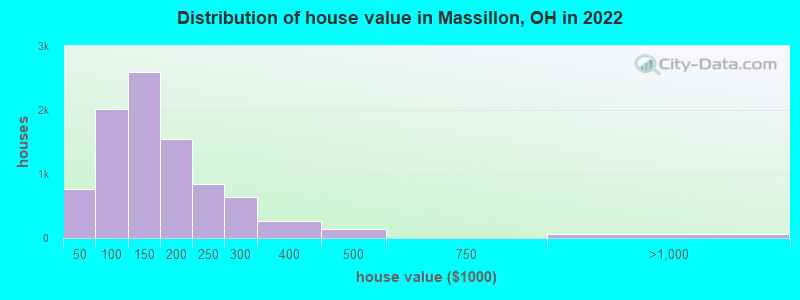
Estimated median house or condo value in 2022: $133,434 (it was $80,900 in 2000 )
Massillon:
$133,434Ohio:
$204,100
Lower value quartile - upper value quartile: $93,305 - $191,944Mean price in 2022: Detached houses: $172,361 Here:
$172,361State:
$254,366
Townhouses or other attached units: $225,744 Here:
$225,744State:
$225,733
In 2-unit structures: $138,627 Here:
$138,627State:
$144,384
In 3-to-4-unit structures: $155,404 Here:
$155,404State:
$203,002
Mobile homes: $18,400 Here:
$18,400State:
$62,719
Total population: 32,274 (Urban population: 31,289, Rural population: 95 (all nonfarm) )
Houses: 15,325 (14,051 occupied: 8,673 owner occupied, 5,335 renter occupied )
% of renters here:
38%State:
33%
Housing density: 915 houses/condos per square mile
Median price asked for vacant for-sale houses and condos in 2022: $133,397.
Median contract rent in 2022: $642 (lower quartile is $460, upper quartile is $776)
Median rent asked for vacant for-rent units in 2022: $523
Median gross rent in Massillon, OH in 2022: $780
Housing units in Massillon with a mortgage: 5,328 (553 second mortgage, 13 home equity loan, 447 both second mortgage and home equity loan )Houses without a mortgage: 365
Median household income for houses/condos with a mortgage: $76,126
Median household income for apartments without a mortgage: $54,355
Median monthly housing costs: $778
Data:
Median house or condo value ($)
Median house or condo value ($ change since 2000)
Median house or condo value ($) - White
Median house or condo value ($) - Black or African American
Median house or condo value ($) - Asian
Median house or condo value ($) - Hispanic or Latino
Median house or condo value ($) - American Indian and Alaska Native
Median house or condo value ($) - Multirace
Median house or condo value ($) - Other Race
Median price asked for mobile homes ($)
Household density (households per square mile)
Mean house or condo value by units in structure - 1, detached ($)
Mean house or condo value by units in structure - 1, attached ($)
Mean house or condo value by units in structure - 2 ($)
Mean house or condo value by units in structure by units in structure - 3 or 4 ($)
Mean house or condo value by units in structure - 5 or more ($)
Mean house or condo value by units in structure - Boat, RV, van, etc. ($)
Mean house or condo value by units in structure - Mobile home ($)
Median contract rent ($)
Median contract rent - Lower quartile ($)
Median contract rent - Upper quartile ($)
Median gross rent ($)
Urban houses (%)
Rural houses (%)
Houses occupied (%)
Houses occupied (% change since 2000)
Houses owner occupied (%)
Houses owner occupied (% change since 2000)
Houses renter occupied (%)
Houses renter occupied (% change since 2000)
Vacant housing units - For rent (%)
Vacant housing units - For rent (% change since 2000)
Vacant housing units - For sale only (%)
Vacant housing units - For sale only (% change since 2000)
Vacant housing units - Rented or sold, not occupied (%)
Vacant housing units - Rented or sold, not occupied (% change since 2000)
Vacant housing units - For seasonal, recreational, or occasional use (%)
Vacant housing units - For seasonal, recreational, or occasional use (% change since 2000)
Vacant housing units - For migrant workers (%)
Vacant housing units - For migrant workers (% change since 2000)
Vacant housing units - Other vacant (%)
Vacant housing units - Other vacant (% change since 2000)
Median monthly housing costs ($)
Median household income for houses/condos with a mortgage ($)
Median household income for houses/condos without a mortgage ($)
Median household income ($)
Median household income ($) - White
Median household income ($) - Black or African American
Median household income ($) - Asian
Median household income ($) - Hispanic or Latino
Median household income ($) - American Indian and Alaska Native
Median household income ($) - Multirace
Median household income ($) - Other Race
Mortgage status - with mortgage (%)
Mortgage status - with second mortgage (%)
Mortgage status - with home equity loan (%)
Mortgage status - with both second mortgage and home equity loan (%)
Mortgage status - without a mortgage (%)
Median year house/condo built
Median year apartment built
Household type by relationship - Male householder living alone (%)
Household type by relationship - Male householder not living alone (%)
Household type by relationship - Female householder living alone (%)
Household type by relationship - Female householder not living alone (%)
Household type by relationship - Opposite-Sex spouse (%)
Household type by relationship - Same-Sex spouse (%)
Household type by relationship - Opposite-Sex unmarried partner (%)
Household type by relationship - Same-Sex unmarried partner (%)
Household type by relationship - In group quarters (%)
Size of family households - 2-person household (%)
Size of family households - 3-person household (%)
Size of family households - 4-person household (%)
Size of family households - 5-person household (%)
Size of family households - 6-person household (%)
Size of family households - 7-or-more-person household (%)
Size of nonfamily households - 1-person household (%)
Size of nonfamily households - 2-person household (%)
Size of nonfamily households - 3-person household (%)
Size of nonfamily households - 4-person household (%)
Size of nonfamily households - 5-person household (%)
Size of nonfamily households - 6-person household (%)
Size of nonfamily households - 7-or-moreperson household (%)
Year house built - Built 2010 or later (%)
Year house built - Built 2000 to 2009 (%)
Year house built - Built 1990 to 1999 (%)
Year house built - Built 1980 to 1989 (%)
Year house built - Built 1970 to 1979 (%)
Year house built - Built 1960 to 1969 (%)
Year house built - Built 1950 to 1959 (%)
Year house built - Built 1940 to 1949 (%)
Year house built - Built 1939 or earlier (%)
Median number of rooms in houses and condos
Median number of rooms in apartments
Median number of bedrooms in owner occupied houses
Mean number of bedrooms in owner occupied houses
Median number of bedrooms in renter occupied houses
Mean number of bedrooms in renter occupied houses
Median number of vehichles in owner occupied houses
Mean number of vehichles in owner occupied houses
Median number of vehichles in renter occupied houses
Mean number of vehichles in renter occupied houses
Rooms in owner-occupied houses - 1 room (%)
Rooms in owner-occupied houses - 2 rooms (%)
Rooms in owner-occupied houses - 3 rooms (%)
Rooms in owner-occupied houses - 4 rooms (%)
Rooms in owner-occupied houses - 5 rooms (%)
Rooms in owner-occupied houses - 6 rooms (%)
Rooms in owner-occupied houses - 7 rooms (%)
Rooms in owner-occupied houses - 8 rooms (%)
Rooms in owner-occupied houses - 9+ rooms (%)
Rooms in renter-occupied houses - 1 room (%)
Rooms in renter-occupied houses - 2 rooms (%)
Rooms in renter-occupied houses - 3 rooms (%)
Rooms in renter-occupied houses - 4 rooms (%)
Rooms in renter-occupied houses - 5 rooms (%)
Rooms in renter-occupied houses - 6 rooms (%)
Rooms in renter-occupied houses - 7 rooms (%)
Rooms in renter-occupied houses - 8 rooms (%)
Rooms in renter-occupied houses - 9+ rooms (%)
Bedrooms in owner-occupied houses - no bedrooms (%)
Bedrooms in owner-occupied houses - 1 bedroom (%)
Bedrooms in owner-occupied houses - 2 bedrooms (%)
Bedrooms in owner-occupied houses - 3 bedrooms (%)
Bedrooms in owner-occupied houses - 4 bedrooms (%)
Bedrooms in owner-occupied houses - 5+ bedrooms (%)
Bedrooms in renter-occupied houses - no bedrooms (%)
Bedrooms in renter-occupied houses - 1 bedroom (%)
Bedrooms in renter-occupied houses - 2 bedrooms (%)
Bedrooms in renter-occupied houses - 3 bedrooms (%)
Bedrooms in renter-occupied houses - 4 bedrooms (%)
Bedrooms in renter-occupied houses - 5+ bedrooms (%)
Vehicles available in owner-occupied houses - no vehicle available (%)
Vehicles available in owner-occupied houses - 1 vehicle available(%)
Vehicles available in owner-occupied houses - 2 Vehicles available (%)
Vehicles available in owner-occupied houses - 3 Vehicles available (%)
Vehicles available in owner-occupied houses - 4 Vehicles available (%)
Vehicles available in owner-occupied houses - 5+ Vehicles available (%)
Vehicles available in renter-occupied houses - no vehicle available (%)
Vehicles available in renter-occupied houses - 1 vehicle available (%)
Vehicles available in renter-occupied houses - 2 Vehicles available (%)
Vehicles available in renter-occupied houses - 3 Vehicles available (%)
Vehicles available in renter-occupied houses - 4 Vehicles available (%)
Vehicles available in renter-occupied houses - 5+ Vehicles available (%)
Housing units in structures - 1, detached (%)
Housing units in structures - 1, attached (%)
Housing units in structures - 2 (%)
Housing units in structures - 3 or 4 (%)
Housing units in structures - 5 to 9 (%)
Housing units in structures - 10 to 19 (%)
Housing units in structures - 20 to 49 (%)
Housing units in structures - 50 or more (%)
Housing units in structures - Mobile home (%)
Housing units in structures - Boat, RV, van, etc. (%)
Housing units in structures - Owners - 1, detached (%)
Housing units in structures - Owners - 1, attached (%)
Housing units in structures - Owners - 2 (%)
Housing units in structures - Owners - 3 or 4 (%)
Housing units in structures - Owners - 5 to 9 (%)
Housing units in structures - Owners - 10 to 19 (%)
Housing units in structures - Owners - 20 to 49 (%)
Housing units in structures - Owners - 50 or more (%)
Housing units in structures - Owners - Mobile home (%)
Housing units in structures - Owners - Boat, RV, van, etc. (%)
Housing units in structures - Renters - 1, detached (%)
Housing units in structures - Renters - 1, attached (%)
Housing units in structures - Renters - 2 (%)
Housing units in structures - Renters - 3 or 4 (%)
Housing units in structures - Renters - 5 to 9 (%)
Housing units in structures - Renters - 10 to 19 (%)
Housing units in structures - Renters - 20 to 49 (%)
Housing units in structures - Renters - 50 or more (%)
Housing units in structures - Renters - Mobile home (%)
Housing units in structures - Renters - Boat, RV, van, etc. (%)
House/condo owner moved in on average (years ago)
Renter moved in on average (years ago)
Year householder moved into unit - Moved in 1999 to March 2000 (%)
Year householder moved into unit - Moved in 1999 to March 2000 (%) - White
Year householder moved into unit - Moved in 1999 to March 2000 (%) - Black or African American
Year householder moved into unit - Moved in 1999 to March 2000 (%) - Asian
Year householder moved into unit - Moved in 1999 to March 2000 (%) - Hispanic or Latino
Year householder moved into unit - Moved in 1999 to March 2000 (%) - American Indian and Alaska Native
Year householder moved into unit - Moved in 1999 to March 2000 (%) - Multirace
Year householder moved into unit - Moved in 1999 to March 2000 (%) - Other Race
Year householder moved into unit - Moved in 1995 to 1998 (%)
Year householder moved into unit - Moved in 1995 to 1998 (%) - White
Year householder moved into unit - Moved in 1995 to 1998 (%) - Black or African American
Year householder moved into unit - Moved in 1995 to 1998 (%) - Asian
Year householder moved into unit - Moved in 1995 to 1998 (%) - Hispanic or Latino
Year householder moved into unit - Moved in 1995 to 1998 (%) - American Indian and Alaska Native
Year householder moved into unit - Moved in 1995 to 1998 (%) - Multirace
Year householder moved into unit - Moved in 1995 to 1998 (%) - Other Race
Year householder moved into unit - Moved in 1990 to 1994 (%)
Year householder moved into unit - Moved in 1990 to 1994 (%) - White
Year householder moved into unit - Moved in 1990 to 1994 (%) - Black or African American
Year householder moved into unit - Moved in 1990 to 1994 (%) - Asian
Year householder moved into unit - Moved in 1990 to 1994 (%) - Hispanic or Latino
Year householder moved into unit - Moved in 1990 to 1994 (%) - American Indian and Alaska Native
Year householder moved into unit - Moved in 1990 to 1994 (%) - Multirace
Year householder moved into unit - Moved in 1990 to 1994 (%) - Other Race
Year householder moved into unit - Moved in 1980 to 1989 (%)
Year householder moved into unit - Moved in 1980 to 1989 (%) - White
Year householder moved into unit - Moved in 1980 to 1989 (%) - Black or African American
Year householder moved into unit - Moved in 1980 to 1989 (%) - Asian
Year householder moved into unit - Moved in 1980 to 1989 (%) - Hispanic or Latino
Year householder moved into unit - Moved in 1980 to 1989 (%) - American Indian and Alaska Native
Year householder moved into unit - Moved in 1980 to 1989 (%) - Multirace
Year householder moved into unit - Moved in 1980 to 1989 (%) - Other Race
Year householder moved into unit - Moved in 1970 to 1979 (%)
Year householder moved into unit - Moved in 1970 to 1979 (%) - White
Year householder moved into unit - Moved in 1970 to 1979 (%) - Black or African American
Year householder moved into unit - Moved in 1970 to 1979 (%) - Asian
Year householder moved into unit - Moved in 1970 to 1979 (%) - Hispanic or Latino
Year householder moved into unit - Moved in 1970 to 1979 (%) - American Indian and Alaska Native
Year householder moved into unit - Moved in 1970 to 1979 (%) - Multirace
Year householder moved into unit - Moved in 1970 to 1979 (%) - Other Race
Year householder moved into unit - Moved in 1969 or earlier (%)
Year householder moved into unit - Moved in 1969 or earlier (%) - White
Year householder moved into unit - Moved in 1969 or earlier (%) - Black or African American
Year householder moved into unit - Moved in 1969 or earlier (%) - Asian
Year householder moved into unit - Moved in 1969 or earlier (%) - Hispanic or Latino
Year householder moved into unit - Moved in 1969 or earlier (%) - American Indian and Alaska Native
Year householder moved into unit - Moved in 1969 or earlier (%) - Multirace
Year householder moved into unit - Moved in 1969 or earlier (%) - Other Race
Housing units lacking complete plumbing facilities (%)
Housing units lacking complete kitchen facilities (%)
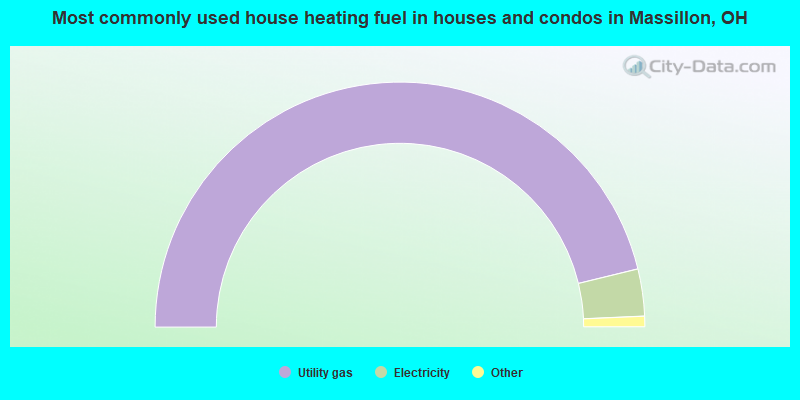
House heating fuel used in houses and condos - Utility gas (%)
House heating fuel used in houses and condos - Bottled, tank, or LP gas (%)
House heating fuel used in houses and condos - Electricity (%)
House heating fuel used in houses and condos - Fuel oil, kerosene, etc. (%)
House heating fuel used in houses and condos - Coal or coke (%)
House heating fuel used in houses and condos - Wood (%)
House heating fuel used in houses and condos - Solar energy (%)
House heating fuel used in houses and condos - Other fuel (%)
House heating fuel used in houses and condos - No fuel used (%)
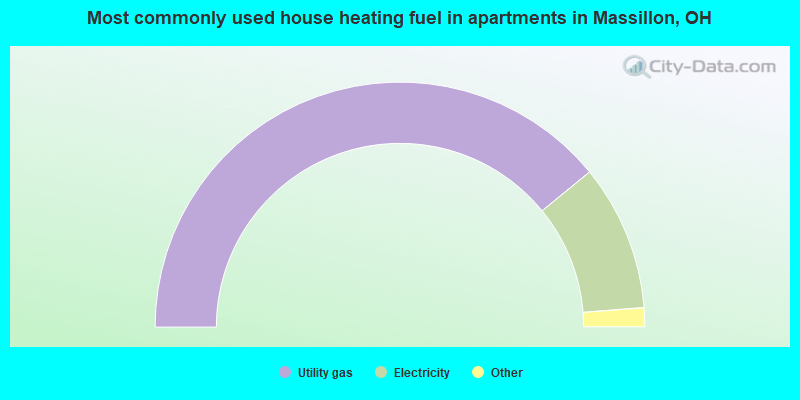
House heating fuel used in apartments - Utility gas (%)
House heating fuel used in apartments - Bottled, tank, or LP gas (%)
House heating fuel used in apartments - Electricity (%)
House heating fuel used in apartments - Fuel oil, kerosene, etc. (%)
House heating fuel used in apartments - Coal or coke (%)
House heating fuel used in apartments - Wood (%)
House heating fuel used in apartments - Solar energy (%)
House heating fuel used in apartments - Other fuel (%)
House heating fuel used in apartments - No fuel used (%)
Latest news about housing in Massillon, OH collected exclusively by city-data.com from local newspapers, TV, and radio stations
Median year house/condo built: 1956Median year apartment built: 1955Household type by relationship:
Households: 32,046
Male householders: 6,669 (2,212 living alone ), Female householders: 7,247 (2,237 living alone )5,384 spouses (5,367 opposite-sex spouses ), 1,569 unmarried partners , (1,524 opposite-sex unmarried partners ), 8,164 children (7,515 natural , 136 adopted , 511 stepchildren ), 616 grandchildren , 290 brothers or sisters , 372 parents , 8 foster children , 171 other relatives , 850 non-relatives In group quarters: 701
Size of family households: 4,129 2-persons , 1,770 3-persons , 1,483 4-persons , 635 5-persons , 180 6-persons , 82 7-or-more-persons .
Size of nonfamily households: 4,498 1-person , 1,094 2-persons , 103 3-persons .
2,971 married couples with children. single-parent households (976 men , 1,604 women ).
97.0% of residents of Massillon speak English at home. of residents speak Spanish at home (62% speak English very well , 21% speak English well , 17% speak English not well ).of residents speak other Indo-European language at home (85% speak English very well , 15% speak English well ).of residents speak Asian or Pacific Island language at home (57% speak English very well , 24% speak English well , 19% speak English not well ).of residents speak other language at home (80% speak English very well , 20% speak English well ).
Foreign born population: 432 (1.3%)of them are naturalized citizens )
Median number of rooms in houses and condos:
Median number of rooms in apartments
Owner-occupied Renter-occupied
Rooms in owner-occupied houses in Massillon, Ohio
6 1 room 0 2 rooms 88 3 rooms 488 4 rooms 1,499 5 rooms 2,397 6 rooms 1,741 7 rooms 1,214 8 rooms 1,240 9+ rooms
Rooms in renter-occupied apartments in Massillon, Ohio
126 1 room 89 2 rooms 776 3 rooms 1,561 4 rooms 1,264 5 rooms 1,031 6 rooms 336 7 rooms 119 8 rooms 33 9+ rooms
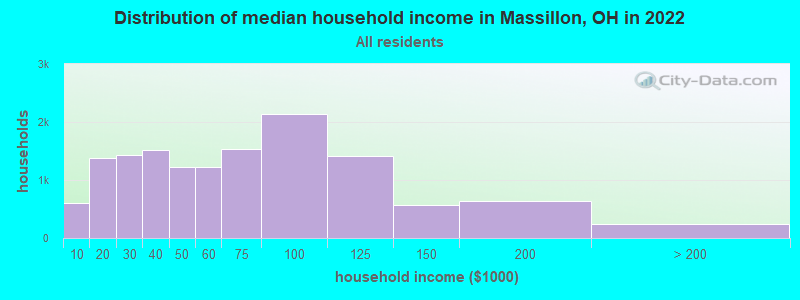
Massillon, OH household income distribution 601 Less than $10,0001,386 $10,000 to $19,9991,438 $20,000 to $29,9991,514 $30,000 to $39,9991,230 $40,000 to $49,9991,229 $50,000 to $59,9991,530 $60,000 to $74,9992,130 $75,000 to $99,9991,410 $100,000 to $124,999570 $125,000 to $149,999644 $150,000 to $199,999246 $200,000 or more
Home value of owner - occupied houses in 2022 in Massillon, OH 69 Less than $10,000174 $10,000 to $14,99924 $15,000 to $19,99947 $20,000 to $24,9997 $25,000 to $29,999183 $30,000 to $34,99956 $35,000 to $39,999196 $40,000 to $49,999171 $50,000 to $59,999358 $60,000 to $69,999207 $70,000 to $79,999749 $80,000 to $89,999331 $90,000 to $99,9991,530 $100,000 to $124,9991,061 $125,000 to $149,9991,025 $150,000 to $174,999529 $175,000 to $199,999842 $200,000 to $249,999633 $250,000 to $299,999265 $300,000 to $399,999136 $400,000 to $499,99922 $750,000 to $999,99921 $1,500,000 to $1,999,99923 $2,000,000 or moreRent paid by renters in 2022 in Massillon, OH 44 Less than $10013 $100 to $14927 $150 to $199131 $200 to $249191 $250 to $299255 $300 to $349206 $350 to $399379 $400 to $449306 $450 to $499567 $500 to $549229 $550 to $599339 $600 to $649808 $650 to $699266 $700 to $749475 $750 to $799559 $800 to $899135 $900 to $999229 $1,000 to $1,24947 $1,250 to $1,4998 $1,500 to $1,999165 No cash rent
Percentage of workers working in this county: 79.9%Number of people working at home: 1,474 (9.2% of all workers )
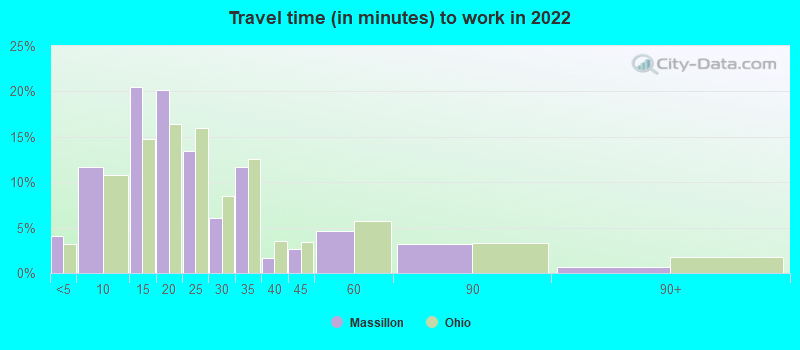
Travel time to work (commute)
Less than 5 minutes: 4985 to 9 minutes: 1,70210 to 14 minutes: 2,58315 to 19 minutes: 2,76320 to 24 minutes: 1,94525 to 29 minutes: 78830 to 34 minutes: 1,70535 to 39 minutes: 61240 to 44 minutes: 46145 to 59 minutes: 70460 to 89 minutes: 61690 or more minutes: 190
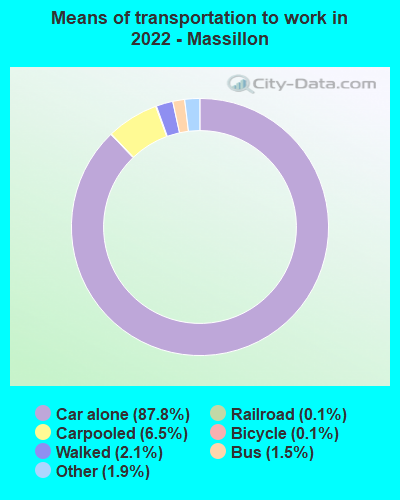
Means of transportation to work:
Drove a car alone: 14,582 (79.6%)Carpooled: 1,158 (6.3%)Bus : 148 (0.8%)Light rail, streetcar or trolley : 17 (0.1%)Taxi: 537 (2.9%)Bicycle: 24 (0.1%)Walked: 273 (1.5%)Worked at home: 1,474 (8.0%)
Unemployment by race in 2022
Unemployment rate for White non-Hispanic residents 2.5% Males2.6% FemalesUnemployment rate for Black residents 6.3% MalesUnemployment rate for two or more race residents 0.9% Males4.7% Females
Year of entry for the foreign-born population in Massillon, Ohio
264 2010 or later 29 2000 to 2009 72 1990 to 1999 4 1980 to 1989 72 1970 to 1979 233 Before 1970
First ancestries reported:
German: 3,484 (25.5%)
American: 1,500 (11.0%)
Irish: 1,146 (8.4%)
English: 908 (6.6%)
Italian: 798 (5.8%)
African: 535 (3.9%)
European: 332 (2.4%)
Slovak: 238 (1.7%)
Greek: 188 (1.4%)
Hungarian: 180 (1.3%)
Polish: 136 (1.0%)
Scottish: 134 (1.0%)
Scotch-Irish: 131 (1.0%)
Portuguese: 117 (0.9%)
Czechoslovakian: 88 (0.6%)
Pennsylvania German: 75 (0.5%)
Dutch: 63 (0.5%)
Welsh: 62 (0.5%)
Romanian: 62 (0.5%)
British: 61 (0.4%)
Serbian: 57 (0.4%)
Swiss: 52 (0.4%)
Eastern European: 47 (0.3%)
Lebanese: 43 (0.3%)
Bulgarian: 31 (0.2%)
Ukrainian: 31 (0.2%)
French: 29 (0.2%)
Croatian: 25 (0.2%)
Jamaican: 25 (0.2%)
Arab: 24 (0.2%)
Scandinavian: 20 (0.1%)
Canadian: 18 (0.1%)
French Canadian: 15 (0.1%)
Northern European: 14 (0.1%)
Swedish: 14 (0.1%)
Slovene: 13 (0.10%)
Danish: 12 (0.09%)
Czech: 11 (0.08%)
Nigerian: 11 (0.08%)
Norwegian: 7 (0.05%)
Austrian: 5 (0.04%)
Cape Verdean: 5 (0.04%) Most common places of birth for foreign-born residents (%): China, excluding Hong Kong and Taiwan Massillon:
20.2% (95)Ohio:
6.2% (35,703)
England Massillon:
14.3% (67)Ohio:
1.0% (5,979)
Mexico Massillon:
13.4% (63)Ohio:
7.8% (44,796)
Argentina Massillon:
7.7% (36)Ohio:
0.3% (1,447)
Italy Massillon:
5.5% (26)Ohio:
1.2% (6,679)
Philippines Massillon:
3.6% (17)Ohio:
3.1% (17,818)
Portugal Massillon:
3.2% (15)Ohio:
0.1% (408)
Japan Massillon:
3.0% (14)Ohio:
1.4% (8,101)
Germany Massillon:
2.8% (13)Ohio:
2.2% (12,846)
Kuwait Massillon:
2.6% (12)Ohio:
0.2% (1,210)
United Kingdom, excluding England and Scotland Massillon:
2.6% (12)Ohio:
0.9% (5,422)
Venezuela Massillon:
2.6% (12)Ohio:
0.7% (3,920)
Asia, n.e.c. Massillon:
2.3% (11)Ohio:
0.5% (2,826)
Canada Massillon:
1.9% (9)Ohio:
2.6% (14,988)
Lebanon Massillon:
1.7% (8)Ohio:
0.7% (3,862)
France Massillon:
1.7% (8)Ohio:
0.6% (3,223)
Cuba Massillon:
1.7% (8)Ohio:
0.4% (2,031)
Place of birth for U.S.-born residents:
This state: 27,040Other state: 4,378Northeast: 1,000Midwest: 525South: 2,326West: 572 92.2% of Massillon residents lived in the same house 1 years ago.
Out of people who lived in different houses, 42.4% lived in this county.
Out of people who lived in different counties, 75.6% lived in Ohio.
Massillon:
92.2%State average:
87.8%
Education attainment for males 25 years and older:
No schooling: 53Nursery to 4th grade: 45th and 6th grade: 177th and 8th grade: 889th grade: 21510th grade: 13011th grade: 22412th grade, no diploma: 445High school graduate (or equivalency): 4,621Less than 1 year of college: 1,500Some college more than 1 year, no degree: 1,508Associate degree: 848Bachelor's degree: 1,129Master's degree: 407Professional school degree: 71Doctorate degree: 55
Education attainment for females 25 years and older:
No schooling: 64Nursery to 4th grade: 385th and 6th grade: 07th and 8th grade: 869th grade: 5710th grade: 13311th grade: 11512th grade, no diploma: 209High school graduate (or equivalency): 5,293Less than 1 year of college: 849Some college more than 1 year, no degree: 1,262Associate degree: 1,503Bachelor's degree: 1,485Master's degree: 670Professional school degree: 77Doctorate degree: 20
Housing units in structures:
One, detached: 11,132One, attached: 488Two: 1,1353 or 4: 6615 to 9: 70010 to 19: 30220 to 49: 4150 or more: 505Mobile homes: 356Housing units lacking complete plumbing facilities in 2022: 0.9%Housing units lacking complete kitchen facilities in 2022: 2.5%House/condo owner moved in on average 12 years ago
Renter moved in on average 5 years ago
Private vs. public school enrollment:
Students in private schools in grades 1 to 8 (elementary and middle school): 302 Students in private schools in grades 9 to 12 (high school): 125 Students in private undergraduate colleges: 107