Margate City, NJ (New Jersey) Houses and Residents
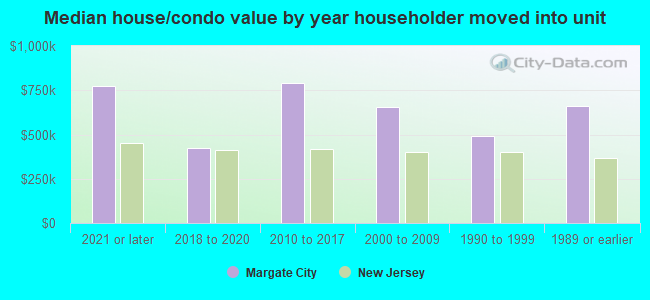
| Margate City: | $651,127 |
| New Jersey: | $428,900 |
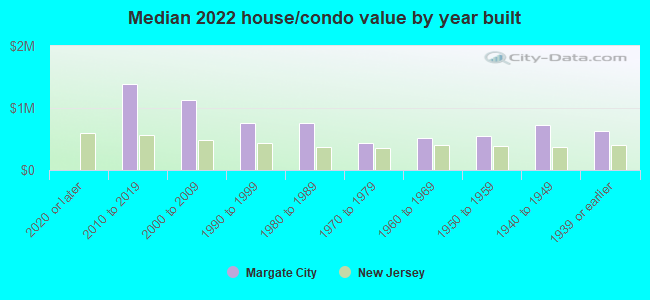
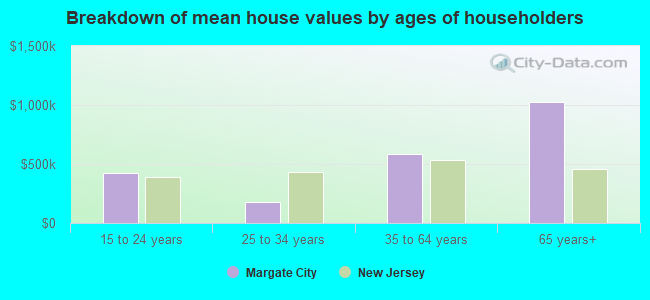
Mean price in 2022:
Detached houses: $920,964
Here: $920,964 State: $537,591 Townhouses or other attached units: $636,152
Here: $636,152 State: $381,113 In 2-unit structures: $934,930
Here: $934,930 State: $444,476 In 3-to-4-unit structures: $587,992
Here: $587,992 State: $457,463 In 5-or-more-unit structures: $355,508
Here: $355,508 State: $368,745
Total population: 6,333 (All urban)
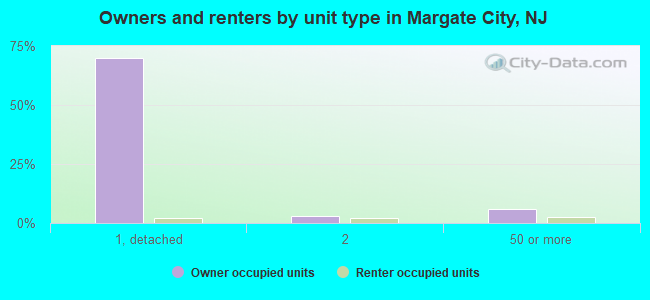
Houses: 6,865 (2,591 occupied: 2,326 owner occupied, 265 renter occupied)
| % of renters here: | 10% |
| State: | 35% |
Housing density: 4,881 houses/condos per square mile
Median price asked for vacant for-sale houses and condos in 2022: $820,125.
Median contract rent in 2022: $1,136 (lower quartile is $345, upper quartile is $1,639)
Median rent asked for vacant for-rent units in 2022: $950
Median gross rent in Margate City, NJ in 2022: $1,333
Housing units in Margate City with a mortgage: 1,122 (64 second mortgage, 0 home equity loan, 58 both second mortgage and home equity loan)
Houses without a mortgage: 54
Median household income for houses/condos with a mortgage: $150,603
Median household income for apartments without a mortgage: $99,568
Median monthly housing costs: $1,725
Compare current foreclosures near Margate City, NJ:
| Photo | Address | Area | Beds / Baths | Price | Details |
|---|---|---|---|---|---|

|
#1
Lagoon Dr
Margate City, NJ 08402
|
4,270 sq. feet
|
- baths - beds |
show details | |

|
#2
Bayside Ct
Margate City, NJ 08402
|
2,482 sq. feet
|
- baths - beds |
show details | |

|
#3
Pacific Ave
Margate City, NJ 08402
|
388 sq. feet
|
- baths - beds |
show details | |

|
#4
Amherst Ave
Margate City, NJ 08402
|
3,094 sq. feet
|
- baths - beds |
show details | |

|
#5
Atlantic Ave Apt B-11
Margate City, NJ 08402
|
- sq. feet
|
- baths - beds |
show details | |

|
#6
N Fredericksburg Ave
Margate City, NJ 08402
|
- sq. feet
|
- baths - beds |
show details | |

|
#7
Atlantic Ave Apt B-11
Margate City, NJ 08402
|
- sq. feet
|
- baths - beds |
show details | |

|
#8
So Washington Ave, # 4
Margate City, NJ 08402
|
- sq. feet
|
- baths - beds |
show details | |

|
#9
N Federicksburg Ave
Margate City, NJ 08402
|
- sq. feet
|
- baths - beds |
show details | |

|
#10
Pacific Ave Apt 18
Margate City, NJ 08402
|
- sq. feet
|
- baths - beds |
show details |
| Photo | Address | Area | Beds / Baths | Price | Details |
|---|---|---|---|---|---|

|
#11
Pacific Ave Apt 18
Margate City, NJ 08402
|
- sq. feet
|
- baths - beds |
show details | |

|
#12
Bayside Ct
Margate City, NJ 08402
|
2,482 sq. feet
|
- baths - beds |
show details | |

|
#13
N Connecticut Ave
Atlantic City, NJ 08401
|
1,200 sq. feet
|
1 baths 3 beds |
$139,900
|
show details |

|
#14
Route 50
Woodbine, NJ 08270
|
2,160 sq. feet
|
3 baths 3 beds |
$425,000
|
show details |

|
#15
Ventnor Ave
Margate City, NJ 08402
|
- sq. feet
|
- baths - beds |
show details | |

|
#16
Lagoon Dr
Margate City, NJ 08402
|
- sq. feet
|
- baths - beds |
show details | |

|
#17
N Vendome Ave
Margate City, NJ 08402
|
- sq. feet
|
- baths - beds |
show details | |

|
#18
Amherst Ave
Margate City, NJ 08402
|
- sq. feet
|
- baths - beds |
show details | |

|
#19
Birch Grove Rd
Northfield, NJ 08225
|
- sq. feet
|
1 baths 3 beds |
$249,900
|
show details |

|
#20
N Ohio Ave
Atlantic City, NJ 08401
|
3,320 sq. feet
|
4 baths 6 beds |
show details |
| Photo | Address | Area | Beds / Baths | Price | Details |
|---|---|---|---|---|---|

|
#21
E Mourning Dove Way
Absecon, NJ 08205
|
2,324 sq. feet
|
2 baths 4 beds |
show details | |

|
#22
Route Us 9 S
Ocean View, NJ 08230
|
2,112 sq. feet
|
3 baths 4 beds |
show details | |

|
#23
Bayberry Ct
Mays Landing, NJ 08330
|
894 sq. feet
|
1 baths 2 beds |
show details | |

|
#24
Ocean Ave
Mays Landing, NJ 08330
|
1,620 sq. feet
|
2 baths 3 beds |
show details | |

|
#25
Route 50
Ocean View, NJ 08230
|
1,008 sq. feet
|
1 baths 3 beds |
show details | |

|
#26
Blake Dr
Mays Landing, NJ 08330
|
1,152 sq. feet
|
2 baths 2 beds |
show details | |

|
#27
Florida Ave
Egg Harbor Township, NJ 08234
|
1,008 sq. feet
|
1 baths 3 beds |
show details | |

|
#28
Robert Best Rd
Egg Harbor Township, NJ 08234
|
1,508 sq. feet
|
2 baths 3 beds |
show details | |

|
#29
Osbourn Ct
Tuckerton, NJ 08087
|
1,992 sq. feet
|
3 baths 4 beds |
show details | |

|
#30
Drexel Ave
Atlantic City, NJ 08401
|
- sq. feet
|
- baths - beds |
$6,900
|
show details |
| Photo | Address | Area | Beds / Baths | Price | Details |
|---|---|---|---|---|---|

|
#31
Poplar Ave
Absecon, NJ 08205
|
2,212 sq. feet
|
2 baths 4 beds |
show details | |

|
#32
Treetop Ln
Egg Harbor Township, NJ 08234
|
2,616 sq. feet
|
3 baths 4 beds |
show details | |

|
#33
Brown Ave
Egg Harbor Township, NJ 08234
|
- sq. feet
|
- baths - beds |
$67,900
|
show details |

|
#34
Chicago Ave
Egg Harbor City, NJ 08215
|
1,185 sq. feet
|
2 baths 3 beds |
show details | |

|
#35
W Adams Ave
Pleasantville, NJ 08232
|
1,314 sq. feet
|
1 baths 3 beds |
show details | |

|
#36
N 4th St
Pleasantville, NJ 08232
|
1,128 sq. feet
|
1 baths 2 beds |
show details | |

|
#37
Southwinds Dr
Tuckerton, NJ 08087
|
1,180 sq. feet
|
3 baths 2 beds |
show details | |

|
#38
N Aberdeen Pl
Atlantic City, NJ 08401
|
2,164 sq. feet
|
3 baths - beds |
show details | |

|
#39
Fairwa 1625
Absecon, NJ 08205
|
1,173 sq. feet
|
- baths - beds |
show details | |

|
#40
Ocean Heights Ave
Mays Landing, NJ 08330
|
- sq. feet
|
2 baths 4 beds |
show details |
| Photo | Address | Area | Beds / Baths | Price | Details |
|---|---|---|---|---|---|

|
#41
Ashland Ave
Egg Harbor Township, NJ 08234
|
1,428 sq. feet
|
- baths - beds |
show details | |

|
#42
Arbutus Ave
Absecon, NJ 08205
|
1,458 sq. feet
|
- baths - beds |
show details | |

|
#43
English Creek Ave
Egg Harbor Township, NJ 08234
|
2,048 sq. feet
|
- baths - beds |
show details | |

|
#44
St Martins Pl
Marmora, NJ 08223
|
1,240 sq. feet
|
- baths - beds |
show details | |

|
#45
Rutter Ave
Egg Harbor Township, NJ 08234
|
1,198 sq. feet
|
- baths - beds |
show details | |

|
#46
E Brook Ln
Absecon, NJ 08205
|
1,308 sq. feet
|
- baths - beds |
show details | |

|
#47
Marlborough Ave
Absecon, NJ 08201
|
1,909 sq. feet
|
- baths - beds |
show details | |

|
#48
Folsom Ave
Egg Harbor Township, NJ 08234
|
1,014 sq. feet
|
- baths - beds |
show details | |

|
#49
Thorobred Rd
Egg Harbor Township, NJ 08234
|
3,260 sq. feet
|
- baths - beds |
show details | |

|
Check over 1 million property listings on Foreclosure.com!
|
browse all offers | |||


 | NJ Real Estate Market. (124 replies) |
| What types of things can you do in Atlantic City? (13 replies) |
| South Jersey from a Main Line Perspective (21 replies) |
| Atlantic county teacher salaries-advice needed (7 replies) |

Median year apartment built: 1963
Household type by relationship:
Households: 5,356- Male householders: 1,305 (341 living alone), Female householders: 1,291 (505 living alone)
1,338 spouses (1,321 opposite-sex spouses), 76 unmarried partners, (76 opposite-sex unmarried partners), 1,219 children (1,163 natural, 23 adopted, 33 stepchildren), 15 grandchildren, 31 brothers or sisters, 36 parents, 0 foster children, 0 other relatives, 38 non-relatives
- In group quarters: 5
Size of family households: 1,138 2-persons, 276 3-persons, 189 4-persons, 105 5-persons.
Size of nonfamily households: 820 1-person, 67 2-persons.
678 married couples with children.
102 single-parent households (15 men, 87 women).
93.6% of residents of Margate City speak English at home.
1.9% of residents speak Spanish at home (43% speak English very well, 51% speak English well, 6% speak English not well).
3.2% of residents speak other Indo-European language at home (99% speak English very well, 1% speak English not well).
2.6% of residents speak Asian or Pacific Island language at home (40% speak English very well, 50% speak English well, 10% speak English not well).
1.2% of residents speak other language at home (100% speak English very well).
Foreign born population: 305 (5.7%)
(87.9% of them are naturalized citizens)
| Here: | 7.0 |
| State: | 6.8 |
| Here: | 3.4 |
| State: | 3.9 |
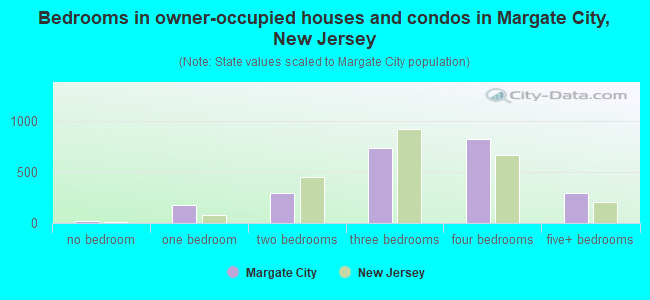
- Bedrooms in owner-occupied houses and condos in Margate City, New Jersey
- 16no bedroom
- 1741 bedroom
- 2932 bedrooms
- 7313 bedrooms
- 8234 bedrooms
- 2905+ bedrooms
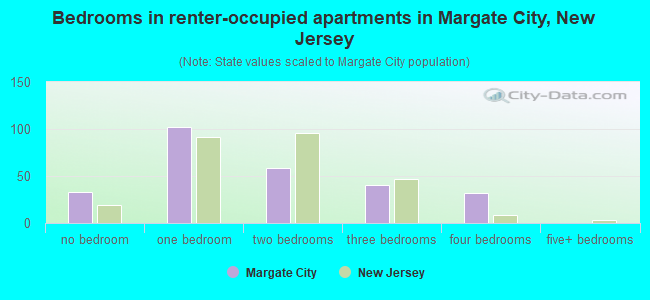
- Bedrooms in renter-occupied apartments in Margate City, New Jersey
- 33no bedroom
- 1021 bedroom
- 582 bedrooms
- 403 bedrooms
- 324 bedrooms
- 05+ bedrooms
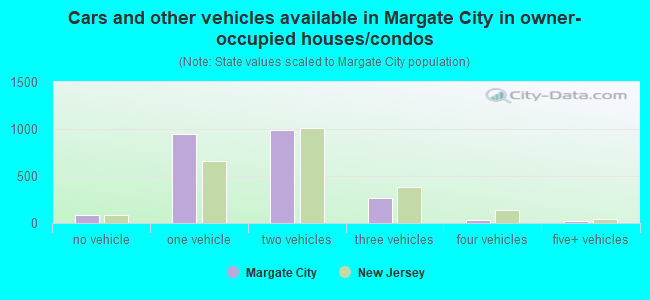
- Cars and other vehicles available in Margate City in owner-occupied houses/condos
- 81no vehicle
- 9501 vehicle
- 9862 vehicles
- 2633 vehicles
- 294 vehicles
- 175+ vehicles
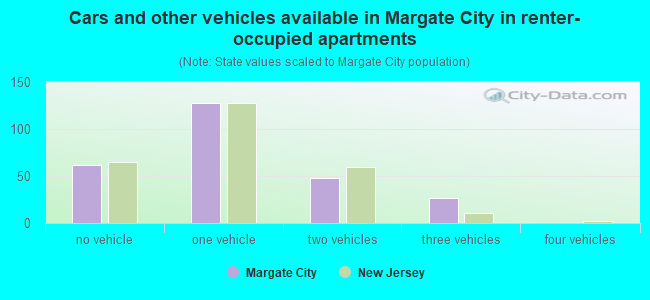
- Cars and other vehicles available in Margate City in renter-occupied apartments
- 62no vehicle
- 1281 vehicle
- 482 vehicles
- 273 vehicles
- 04 vehicles
- 05+ vehicles
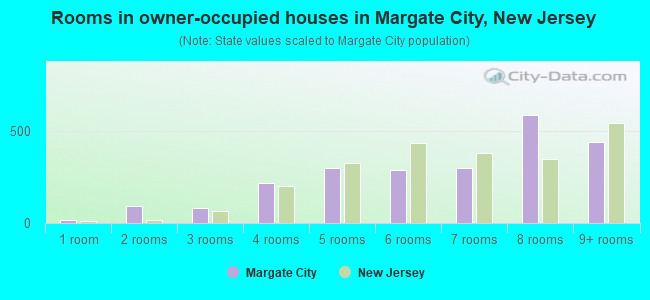
- Rooms in owner-occupied houses in Margate City, New Jersey
- 161 room
- 922 rooms
- 833 rooms
- 2164 rooms
- 3025 rooms
- 2876 rooms
- 3027 rooms
- 5898 rooms
- 4399+ rooms
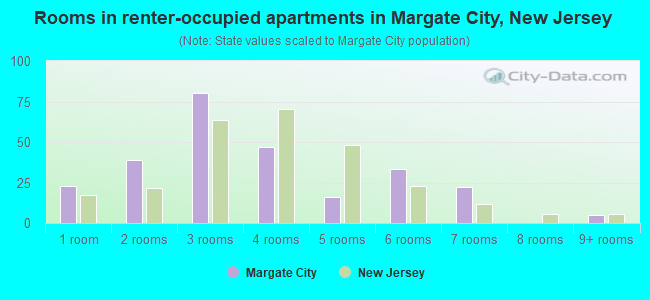
- Rooms in renter-occupied apartments in Margate City, New Jersey
- 231 room
- 392 rooms
- 803 rooms
- 474 rooms
- 165 rooms
- 336 rooms
- 227 rooms
- 08 rooms
- 59+ rooms
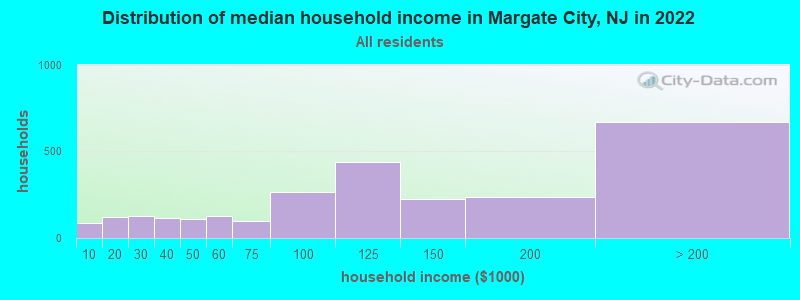
Margate City, NJ household income distribution

- 86Less than $10,000
- 121$10,000 to $19,999
- 128$20,000 to $29,999
- 113$30,000 to $39,999
- 107$40,000 to $49,999
- 128$50,000 to $59,999
- 99$60,000 to $74,999
- 263$75,000 to $99,999
- 437$100,000 to $124,999
- 225$125,000 to $149,999
- 238$150,000 to $199,999
- 669$200,000 or more
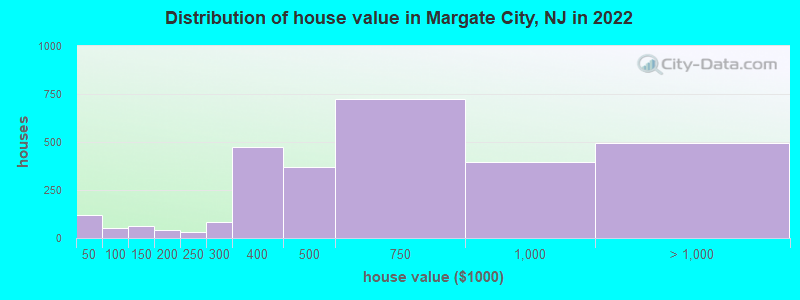
Home value of owner - occupied houses in 2022 in Margate City, NJ
-
- 61Less than $10,000
- 4$10,000 to $14,999
- 32$30,000 to $34,999
- 7$35,000 to $39,999
- 14$40,000 to $49,999
- 35$80,000 to $89,999
- 56$100,000 to $124,999
- 5$125,000 to $149,999
- 22$150,000 to $174,999
- 18$175,000 to $199,999
- 32$200,000 to $249,999
- 82$250,000 to $299,999
- 472$300,000 to $399,999
- 371$400,000 to $499,999
- 725$500,000 to $749,999
- 396$750,000 to $999,999
- 305$1,000,000 to $1,499,999
- 94$1,500,000 to $1,999,999
- 93$2,000,000 or more
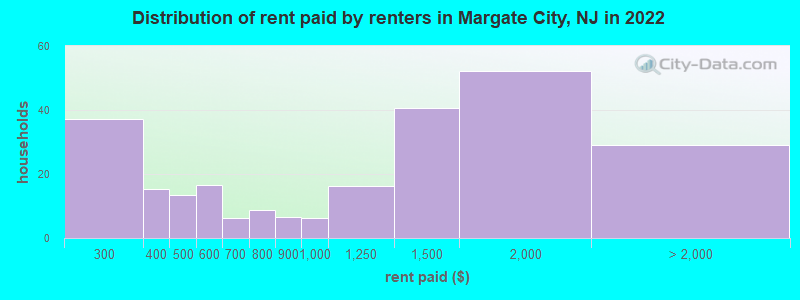
Rent paid by renters in 2022 in Margate City, NJ
-
- 29$200 to $249
- 7$250 to $299
- 15$300 to $349
- 13$450 to $499
- 16$500 to $549
- 6$650 to $699
- 8$750 to $799
- 6$800 to $899
- 6$900 to $999
- 16$1,000 to $1,249
- 40$1,250 to $1,499
- 52$1,500 to $1,999
- 19$2,000 to $2,499
- 4$3,500 or more
- 4No cash rent
Percentage of workers working in this county: 65.7%
Number of people working at home: 508 (20.3% of all workers)
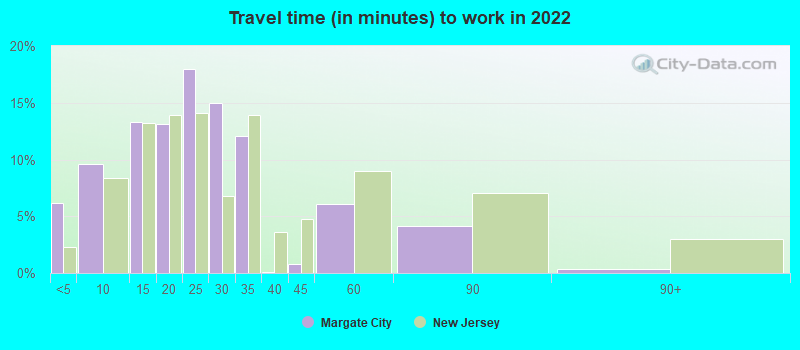
Travel time to work (commute)
- Less than 5 minutes: 74
- 5 to 9 minutes: 130
- 10 to 14 minutes: 579
- 15 to 19 minutes: 272
- 20 to 24 minutes: 230
- 25 to 29 minutes: 94
- 30 to 34 minutes: 177
- 35 to 39 minutes: 120
- 40 to 44 minutes: 45
- 45 to 59 minutes: 70
- 60 to 89 minutes: 184
- 90 or more minutes: 94
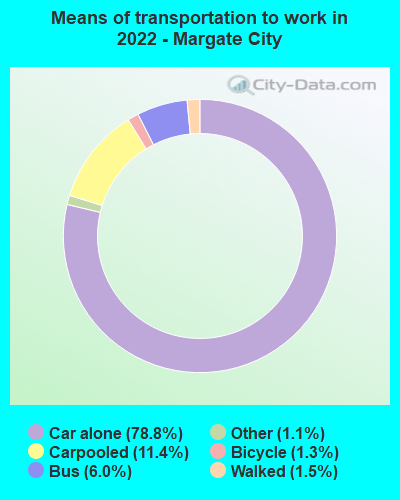
Means of transportation to work:
- Drove a car alone: 1,597 (63.7%)
- Carpooled: 261 (10.4%)
- Bus: 110 (4.4%)
- Taxi: 24 (1.0%)
- Bicycle: 25 (1.0%)
- Walked: 33 (1.3%)
- Worked at home: 508 (20.3%)
- Unemployment by race in 2022
- Unemployment rate for White non-Hispanic residents
- 2.8%Males
- 1.5%Females
- Unemployment rate for other race residents
- 60.6%Females
- Unemployment rate for two or more race residents
- 9.3%Females
- Unemployment rate for Hispanic or Latino residents
- 26.7%Females
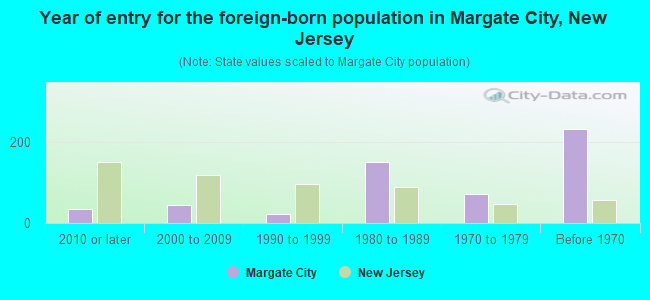
- Year of entry for the foreign-born population in Margate City, New Jersey
- 352010 or later
- 452000 to 2009
- 231990 to 1999
- 1521980 to 1989
- 721970 to 1979
- 233Before 1970
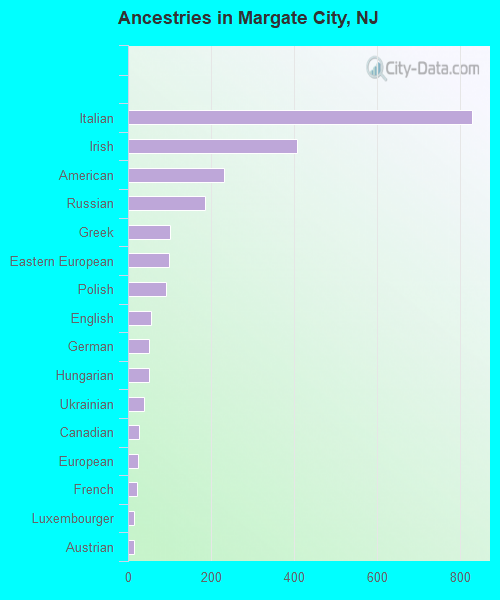
First ancestries reported:
- Italian: 828 (28.4%)
- Irish: 406 (13.9%)
- American: 232 (8.0%)
- Russian: 185 (6.3%)
- Greek: 100 (3.4%)
- Eastern European: 98 (3.4%)
- Polish: 91 (3.1%)
- English: 55 (1.9%)
- German: 51 (1.7%)
- Hungarian: 51 (1.7%)
- Ukrainian: 38 (1.3%)
- Canadian: 26 (0.9%)
- European: 23 (0.8%)
- French: 21 (0.7%)
- Luxembourger: 15 (0.5%)
- Austrian: 14 (0.5%)
- Armenian: 7 (0.2%)
- Scotch-Irish: 7 (0.2%)
- Scottish: 6 (0.2%)
- Swiss: 5 (0.2%)
- Serbian: 4 (0.1%)
- Dutch: 2 (0.07%)
Most common places of birth for foreign-born residents (%):
| Margate City: | 17.3% (58) |
| New Jersey: | 4.0% (85,934) |
| Margate City: | 12.5% (42) |
| New Jersey: | 0.8% (16,778) |
| Margate City: | 9.6% (32) |
| New Jersey: | 4.2% (90,817) |
| Margate City: | 6.6% (22) |
| New Jersey: | 1.5% (33,198) |
| Margate City: | 6.6% (22) |
| New Jersey: | 9.7% (209,055) |
| Margate City: | 6.6% (22) |
| New Jersey: | 2.7% (58,563) |
| Margate City: | 4.8% (16) |
| New Jersey: | 0.2% (4,659) |
| Margate City: | 4.8% (16) |
| New Jersey: | 0.8% (17,217) |
| Margate City: | 4.2% (14) |
| New Jersey: | 3.7% (78,969) |
| Margate City: | 3.3% (11) |
| New Jersey: | 0.3% (7,501) |
| Margate City: | 2.7% (9) |
| New Jersey: | 1.6% (33,678) |
| Margate City: | 2.4% (8) |
| New Jersey: | 0.5% (10,975) |
| Margate City: | 2.4% (8) |
| New Jersey: | 0.2% (4,324) |
| Margate City: | 2.4% (8) |
| New Jersey: | 0.3% (6,033) |
| Margate City: | 2.4% (8) |
| New Jersey: | 0.9% (20,371) |
| Margate City: | 2.1% (7) |
| New Jersey: | 1.3% (27,580) |
| Margate City: | 1.8% (6) |
| New Jersey: | 0.5% (10,886) |
Place of birth for U.S.-born residents:
- This state: 2,173
- Other state: 2,805
- Northeast: 2,472
- Midwest: 32
- South: 139
- West: 31
91.4% of Margate City residents lived in the same house 1 years ago.
Out of people who lived in different houses, 35.0% lived in this county.
Out of people who lived in different counties, 33.3% lived in New Jersey.
| Margate City: | 91.4% |
| State average: | 90.4% |
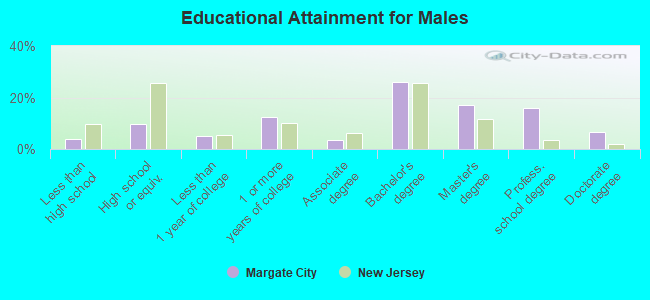
Education attainment for males 25 years and older:
- No schooling: 6
- Nursery to 4th grade: 0
- 5th and 6th grade: 24
- 7th and 8th grade: 0
- 9th grade: 0
- 10th grade: 3
- 11th grade: 30
- 12th grade, no diploma: 15
- High school graduate (or equivalency): 188
- Less than 1 year of college: 98
- Some college more than 1 year, no degree: 243
- Associate degree: 65
- Bachelor's degree: 512
- Master's degree: 334
- Professional school degree: 310
- Doctorate degree: 133
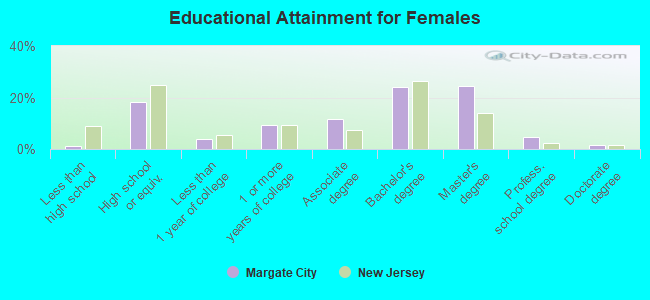
Education attainment for females 25 years and older:
- No schooling: 0
- Nursery to 4th grade: 0
- 5th and 6th grade: 0
- 7th and 8th grade: 3
- 9th grade: 0
- 10th grade: 15
- 11th grade: 1
- 12th grade, no diploma: 13
- High school graduate (or equivalency): 437
- Less than 1 year of college: 96
- Some college more than 1 year, no degree: 224
- Associate degree: 280
- Bachelor's degree: 576
- Master's degree: 578
- Professional school degree: 114
- Doctorate degree: 41


Housing units in structures:
- One, detached: 4,102
- One, attached: 394
- Two: 532
- 3 or 4: 163
- 5 to 9: 111
- 10 to 19: 251
- 20 to 49: 253
- 50 or more: 1,055
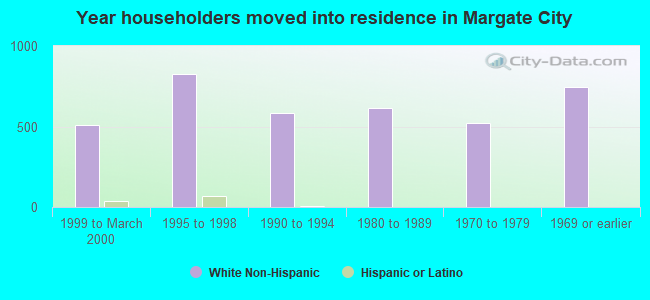
House/condo owner moved in on average 12 years ago
Renter moved in on average 7 years ago
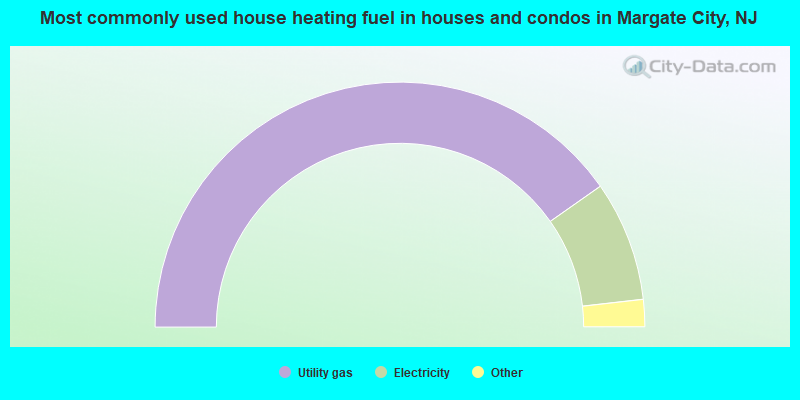
- 80.6%Utility gas
- 15.9%Electricity
- 1.3%No fuel used
- 1.2%Fuel oil, kerosene, etc.
- 0.8%Bottled, tank, or LP gas
- 0.3%Other fuel
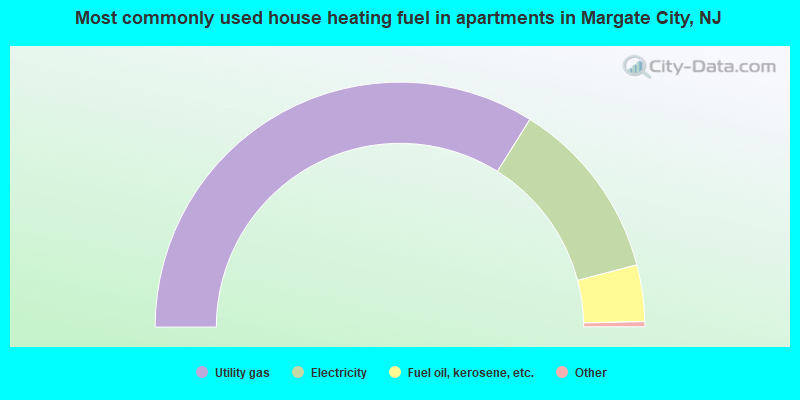
- 68.3%Utility gas
- 24.2%Electricity
- 7.5%Fuel oil, kerosene, etc.
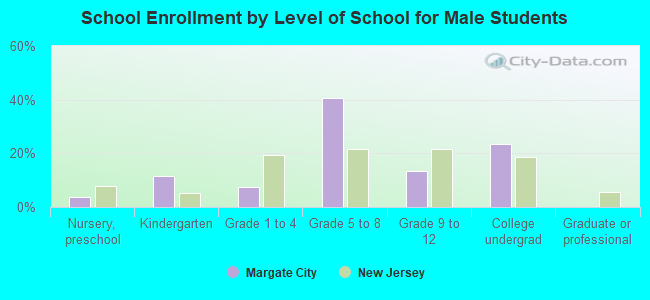
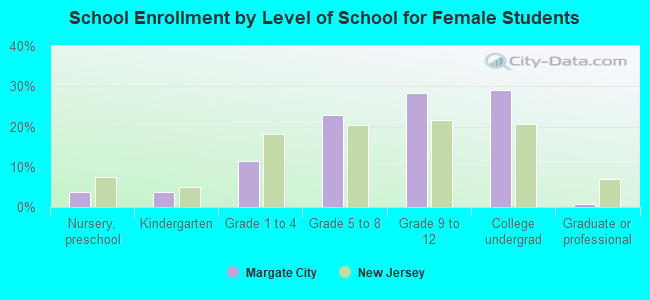
Private vs. public school enrollment:
| Here: | 15.2% |
| New Jersey: | 12.3% |
| Here: | 33.6% |
| New Jersey: | 13.1% |
| Here: | 32.6% |
| New Jersey: | 33.2% |