Marblehead, MA (Massachusetts) Houses and Residents
| Marblehead: | $931,906 |
| Massachusetts: | $534,700 |
Mean price in 2022:
Detached houses: $1,341,780
Here: $1,341,780 State: $651,570 Townhouses or other attached units: $736,397
Here: $736,397 State: $617,749 In 2-unit structures: $692,110
Here: $692,110 State: $594,808 In 3-to-4-unit structures: $682,256
Here: $682,256 State: $601,912 In 5-or-more-unit structures: $419,005
Here: $419,005 State: $555,768
Total population: 19,808 (All urban)
Houses: 8,880 (8,252 occupied: 6,741 owner occupied, 1,534 renter occupied)
| % of renters here: | 19% |
| State: | 38% |
Housing density: 1,961 houses/condos per square mile
Median price asked for vacant for-sale houses and condos in 2022: $14,253,650.
Median contract rent in 2022: $1,682 (lower quartile is $1,226, upper quartile is over $2,000)
Median rent asked for vacant for-rent units in 2022: $2,923
Median gross rent in Marblehead, MA in 2022: $1,875
Housing units in Marblehead with a mortgage: 4,605 (1,088 second mortgage, 13 home equity loan, 1,053 both second mortgage and home equity loan)
Houses without a mortgage: 215
Median household income for houses/condos with a mortgage: $211,946
Median household income for apartments without a mortgage: $113,813
Median monthly housing costs: $2,667
Compare current foreclosures near Marblehead, MA:
| Photo | Address | Area | Beds / Baths | Price | Details |
|---|---|---|---|---|---|

|
#1
Green St # B
Marblehead, MA 01945
|
1,461 sq. feet
|
2 baths 2 beds |
show details | |

|
#2
Pickwick Rd
Marblehead, MA 01945
|
1,720 sq. feet
|
3 baths 4 beds |
show details | |

|
#3
W Shore Dr
Marblehead, MA 01945
|
3,072 sq. feet
|
3 baths 5 beds |
show details | |

|
#4
Warwick Ter
Marblehead, MA 01945
|
2,291 sq. feet
|
2 baths 3 beds |
show details | |

|
#5
Ruby Ave
Marblehead, MA 01945
|
2,644 sq. feet
|
2 baths 10 beds |
show details | |

|
#6
Frost Ln
Marblehead, MA 01945
|
1,261 sq. feet
|
1 baths 2 beds |
show details | |

|
#7
Auburndale Rd
Marblehead, MA 01945
|
2,536 sq. feet
|
2 baths 3 beds |
show details | |

|
#8
Naugus Ave
Marblehead, MA 01945
|
1,716 sq. feet
|
1 baths 3 beds |
show details | |

|
#9
Lindsey St
Marblehead, MA 01945
|
1,426 sq. feet
|
1 baths 3 beds |
show details | |

|
#10
Broughton Rd
Marblehead, MA 01945
|
- sq. feet
|
- baths - beds |
show details |
| Photo | Address | Area | Beds / Baths | Price | Details |
|---|---|---|---|---|---|

|
#11
Green St Apt 1
Marblehead, MA 01945
|
- sq. feet
|
- baths - beds |
show details | |

|
#12
Stevens Ave
Middleton, MA 01949
|
1,396 sq. feet
|
2 baths 3 beds |
$535,600
|
show details |

|
#13
Church St
Boston, MA 02122
|
3,663 sq. feet
|
3 baths 6 beds |
show details | |

|
#14
Maple Ave
Nahant, MA 01908
|
5,184 sq. feet
|
4 baths 6 beds |
show details | |

|
#15
Lawrence Rd Apt 22
Rowley, MA 01969
|
720 sq. feet
|
1 baths 1 beds |
show details | |

|
#16
Pearson Ave
Somerville, MA 02144
|
3,104 sq. feet
|
3 baths 4 beds |
show details | |

|
#17
Belmont Ave
Lynn, MA 01905
|
868 sq. feet
|
2 baths 3 beds |
show details | |

|
#18
Burget Ave
Medford, MA 02155
|
1,299 sq. feet
|
2 baths 3 beds |
show details | |

|
#19
Holyoke St
Lynn, MA 01905
|
1,484 sq. feet
|
2 baths 3 beds |
show details | |

|
#20
Belmont Ave
Lynn, MA 01905
|
1,025 sq. feet
|
1 baths 2 beds |
show details |
| Photo | Address | Area | Beds / Baths | Price | Details |
|---|---|---|---|---|---|

|
#21
Hicks Ave Apt 12
Medford, MA 02155
|
1,749 sq. feet
|
2 baths 3 beds |
show details | |

|
#22
W Cedar St Apt 2
Boston, MA 02114
|
740 sq. feet
|
1 baths 2 beds |
show details | |

|
#23
Lowell Rd
North Reading, MA 01864
|
858 sq. feet
|
1 baths 1 beds |
show details | |

|
#24
Margin Street
Lynn, MA 01905
|
1,240 sq. feet
|
2 baths 2 beds |
show details | |

|
#25
Nectar Pl
Nahant, MA 01908
|
7,671 sq. feet
|
5 baths 4 beds |
show details | |

|
#26
E 6th St # 1
Boston, MA 02127
|
1,443 sq. feet
|
2 baths 1 beds |
show details | |

|
#27
Haskell St
Gloucester, MA 01930
|
1,655 sq. feet
|
2 baths 3 beds |
show details | |

|
#28
Laurel Hollow Rd
Boxford, MA 01921
|
5,207 sq. feet
|
5 baths 4 beds |
show details | |

|
#29
Saville St
Saugus, MA 01906
|
1,977 sq. feet
|
3 baths 3 beds |
show details | |

|
#30
Fountain St
Medford, MA 02155
|
1,476 sq. feet
|
1 baths 3 beds |
show details |
| Photo | Address | Area | Beds / Baths | Price | Details |
|---|---|---|---|---|---|

|
#31
Mystic Valley Pkwy Apt 101
Medford, MA 02155
|
1,229 sq. feet
|
2 baths 2 beds |
show details | |

|
#32
Laurel St
Somerville, MA 02143
|
4,078 sq. feet
|
6 baths 9 beds |
show details | |

|
#33
Constitution Ln
Danvers, MA 01923
|
1,098 sq. feet
|
3 baths 2 beds |
show details | |

|
#34
Christopher Dr
Nahant, MA 01908
|
2,393 sq. feet
|
3 baths 3 beds |
show details | |

|
#35
Jerome St
Medford, MA 02155
|
1,448 sq. feet
|
3 baths 3 beds |
show details | |

|
#36
Hillside Rd
Hull, MA 02045
|
1,664 sq. feet
|
2 baths 4 beds |
show details | |

|
#37
Sagamore Ter
Hull, MA 02045
|
1,358 sq. feet
|
2 baths 3 beds |
show details | |

|
#38
Mcdewell Ave
Danvers, MA 01923
|
673 sq. feet
|
1 baths 2 beds |
show details | |

|
#39
W Newton St Apt 3
Boston, MA 02116
|
639 sq. feet
|
1 baths 1 beds |
show details | |

|
#40
2nd St
Hull, MA 02045
|
1,624 sq. feet
|
1 baths 4 beds |
show details |
| Photo | Address | Area | Beds / Baths | Price | Details |
|---|---|---|---|---|---|

|
#41
Broadway Apt 2
Lynn, MA 01904
|
710 sq. feet
|
1 baths 2 beds |
show details | |

|
#42
Rogers Ave
Lynn, MA 01902
|
3,677 sq. feet
|
3 baths 9 beds |
show details | |

|
#43
Locust St Apt 703
Lynn, MA 01904
|
1,031 sq. feet
|
2 baths 2 beds |
show details | |

|
#44
Medford St
Beverly, MA 01915
|
1,230 sq. feet
|
1 baths 3 beds |
show details | |

|
#45
Birch St
Danvers, MA 01923
|
2,516 sq. feet
|
3 baths 3 beds |
show details | |

|
#46
Williams Ct
Woburn, MA 01801
|
1,898 sq. feet
|
2 baths 5 beds |
show details | |

|
#47
Chestnut St
Woburn, MA 01801
|
2,022 sq. feet
|
2 baths 3 beds |
show details | |

|
#48
E St # 19s
Boston, MA 02127
|
1,350 sq. feet
|
2 baths 2 beds |
show details | |

|
#49
West St
Wilmington, MA 01887
|
1,448 sq. feet
|
2 baths 3 beds |
show details | |

|
Check over 1 million property listings on Foreclosure.com!
|
browse all offers | |||

Latest news about housing in Marblehead, MA collected exclusively by city-data.com from local newspapers, TV, and radio stations

 | Post homes in MA that people like (55 replies) |
| How Much Massachusetts Households Make Per Year: Census Data (37 replies) |
| Anyone Here Buying Real Estate During the Covid-19 Crisis? (207 replies) |
| Questions about Gloucester/Marblehead (13 replies) |
| Population slightly down in MA 2022 (362 replies) |
| towns that offer the most jobs per dollar of house (58 replies) |

Median year apartment built: 1939
Household type by relationship:
Households: 20,366- Male householders: 3,633 (626 living alone), Female householders: 4,544 (1,334 living alone)
5,087 spouses (5,075 opposite-sex spouses), 230 unmarried partners, (221 opposite-sex unmarried partners), 6,145 children (5,994 natural, 55 adopted, 95 stepchildren), 25 grandchildren, 212 brothers or sisters, 177 parents, 0 foster children, 100 other relatives, 105 non-relatives
- In group quarters: 106
Size of family households: 2,758 2-persons, 1,231 3-persons, 1,334 4-persons, 474 5-persons, 89 6-persons.
Size of nonfamily households: 2,112 1-person, 213 2-persons.
3,456 married couples with children.
739 single-parent households (111 men, 628 women).
88.3% of residents of Marblehead speak English at home.
2.7% of residents speak Spanish at home (75% speak English very well, 14% speak English well, 11% speak English not well).
6.8% of residents speak other Indo-European language at home (80% speak English very well, 11% speak English well, 9% speak English not well).
1.0% of residents speak Asian or Pacific Island language at home (48% speak English very well, 26% speak English well, 26% speak English not well).
0.1% of residents speak other language at home (100% speak English very well).
Foreign born population: 1,645 (8.1%)
(75.2% of them are naturalized citizens)
| Here: | 7.5 |
| State: | 6.5 |
| Here: | 4.6 |
| State: | 4.0 |

- Bedrooms in owner-occupied houses and condos in Marblehead, Massachusetts
- 34no bedroom
- 881 bedroom
- 9502 bedrooms
- 2,5313 bedrooms
- 2,2494 bedrooms
- 8895+ bedrooms

- Bedrooms in renter-occupied apartments in Marblehead, Massachusetts
- 12no bedroom
- 4801 bedroom
- 6122 bedrooms
- 3143 bedrooms
- 1014 bedrooms
- 155+ bedrooms

- Cars and other vehicles available in Marblehead in owner-occupied houses/condos
- 137no vehicle
- 1,3621 vehicle
- 3,4382 vehicles
- 1,4653 vehicles
- 3194 vehicles
- 205+ vehicles

- Cars and other vehicles available in Marblehead in renter-occupied apartments
- 159no vehicle
- 1,0261 vehicle
- 2892 vehicles
- 343 vehicles
- 264 vehicles
- 05+ vehicles

- Rooms in owner-occupied houses in Marblehead, Massachusetts
- 01 room
- 462 rooms
- 383 rooms
- 3774 rooms
- 4765 rooms
- 1,1256 rooms
- 1,2557 rooms
- 1,4138 rooms
- 2,0129+ rooms

- Rooms in renter-occupied apartments in Marblehead, Massachusetts
- 121 room
- 882 rooms
- 2673 rooms
- 3904 rooms
- 4505 rooms
- 1016 rooms
- 727 rooms
- 608 rooms
- 949+ rooms


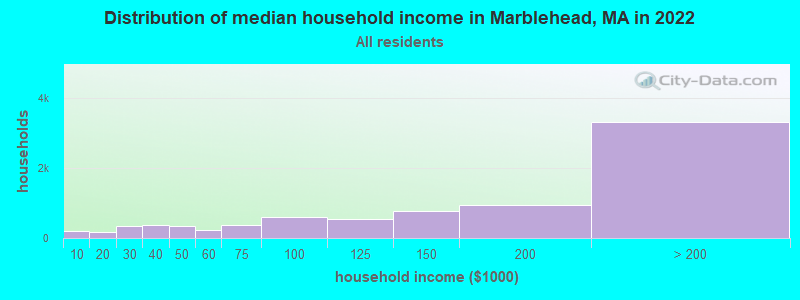
Marblehead, MA household income distribution

- 187Less than $10,000
- 173$10,000 to $19,999
- 345$20,000 to $29,999
- 378$30,000 to $39,999
- 348$40,000 to $49,999
- 242$50,000 to $59,999
- 359$60,000 to $74,999
- 603$75,000 to $99,999
- 554$100,000 to $124,999
- 761$125,000 to $149,999
- 954$150,000 to $199,999
- 3,321$200,000 or more
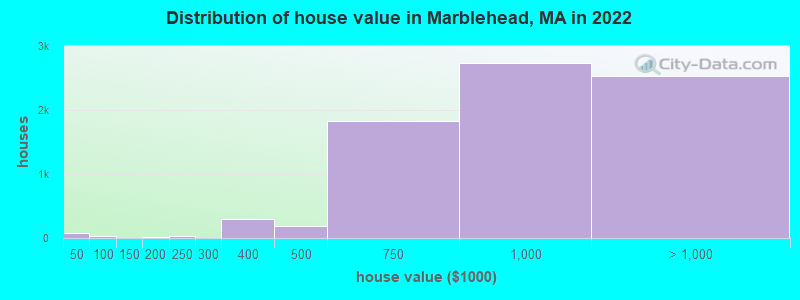
Home value of owner - occupied houses in 2022 in Marblehead, MA
-
- 51Less than $10,000
- 29$40,000 to $49,999
- 21$175,000 to $199,999
- 24$200,000 to $249,999
- 5$250,000 to $299,999
- 296$300,000 to $399,999
- 181$400,000 to $499,999
- 1,828$500,000 to $749,999
- 2,735$750,000 to $999,999
- 1,424$1,000,000 to $1,499,999
- 532$1,500,000 to $1,999,999
- 576$2,000,000 or more
Rent paid by renters in 2022 in Marblehead, MA
-
- 15$250 to $299
- 22$300 to $349
- 23$350 to $399
- 32$400 to $449
- 25$450 to $499
- 13$550 to $599
- 12$600 to $649
- 4$650 to $699
- 15$700 to $749
- 24$750 to $799
- 7$800 to $899
- 223$1,000 to $1,249
- 175$1,250 to $1,499
- 372$1,500 to $1,999
- 312$2,000 to $2,499
- 156$2,500 to $2,999
- 29$3,500 or more
- 75No cash rent


Percentage of workers working in this county: 74.0%
Number of people working at home: 3,693 (35.2% of all workers)
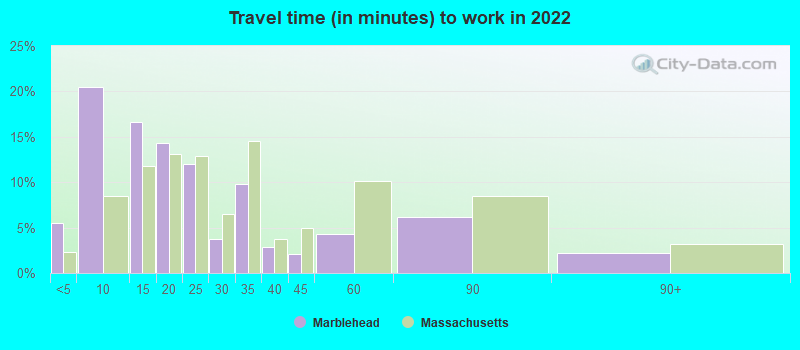
Travel time to work (commute)
- Less than 5 minutes: 467
- 5 to 9 minutes: 1,063
- 10 to 14 minutes: 870
- 15 to 19 minutes: 632
- 20 to 24 minutes: 486
- 25 to 29 minutes: 253
- 30 to 34 minutes: 659
- 35 to 39 minutes: 172
- 40 to 44 minutes: 221
- 45 to 59 minutes: 820
- 60 to 89 minutes: 1,203
- 90 or more minutes: 343
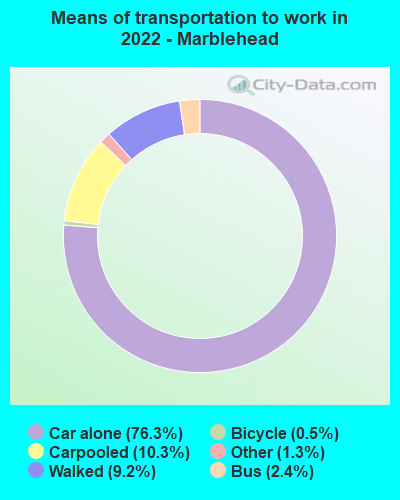
Means of transportation to work:
- Drove a car alone: 3,789 (47.1%)
- Carpooled: 391 (4.9%)
- Bus: 97 (1.2%)
- Taxi: 96 (1.2%)
- Bicycle: 38 (0.5%)
- Walked: 406 (5.0%)
- Worked at home: 3,693 (45.9%)

- Unemployment by race in 2022
- Unemployment rate for White non-Hispanic residents
- 1.9%Males
- 1.8%Females
- Unemployment rate for two or more race residents
- 20.1%Males
- Unemployment rate for Hispanic or Latino residents
- 12.6%Males

- Year of entry for the foreign-born population in Marblehead, Massachusetts
- 2582010 or later
- 4022000 to 2009
- 5441990 to 1999
- 3461980 to 1989
- 1551970 to 1979
- 471Before 1970

First ancestries reported:
- Irish: 1,937 (23.1%)
- English: 768 (9.2%)
- Italian: 712 (8.5%)
- American: 579 (6.9%)
- German: 360 (4.3%)
- Russian: 346 (4.1%)
- Greek: 301 (3.6%)
- European: 241 (2.9%)
- Eastern European: 199 (2.4%)
- Polish: 135 (1.6%)
- African: 127 (1.5%)
- Swedish: 120 (1.4%)
- Dutch: 114 (1.4%)
- Scottish: 105 (1.3%)
- Norwegian: 79 (0.9%)
- French Canadian: 59 (0.7%)
- Ukrainian: 58 (0.7%)
- British: 52 (0.6%)
- French: 52 (0.6%)
- Portuguese: 52 (0.6%)
- Scotch-Irish: 50 (0.6%)
- Swiss: 44 (0.5%)
- Bulgarian: 40 (0.5%)
- Lithuanian: 32 (0.4%)
- Northern European: 29 (0.3%)
- Canadian: 27 (0.3%)
- Hungarian: 26 (0.3%)
- Iranian: 21 (0.3%)
- Danish: 16 (0.2%)
- Serbian: 12 (0.1%)
- Finnish: 9 (0.1%)
- Austrian: 8 (0.10%)
- Latvian: 5 (0.06%)
- Scandinavian: 5 (0.06%)
Most common places of birth for foreign-born residents (%):
| Marblehead: | 17.8% (283) |
| Massachusetts: | 1.5% (18,278) |
| Marblehead: | 5.3% (84) |
| Massachusetts: | 8.4% (103,233) |
| Marblehead: | 5.2% (83) |
| Massachusetts: | 0.9% (10,808) |
| Marblehead: | 5.1% (81) |
| Massachusetts: | 6.8% (82,934) |
| Marblehead: | 5.0% (79) |
| Massachusetts: | 8.3% (101,767) |
| Marblehead: | 4.6% (73) |
| Massachusetts: | 0.8% (10,043) |
| Marblehead: | 4.6% (73) |
| Massachusetts: | 1.4% (16,886) |
| Marblehead: | 4.5% (71) |
| Massachusetts: | 1.0% (12,709) |
| Marblehead: | 4.5% (71) |
| Massachusetts: | 2.3% (28,158) |
| Marblehead: | 4.2% (66) |
| Massachusetts: | 0.9% (10,698) |
| Marblehead: | 3.1% (50) |
| Massachusetts: | 0.2% (2,160) |
| Marblehead: | 3.1% (49) |
| Massachusetts: | 0.3% (3,727) |
| Marblehead: | 2.5% (40) |
| Massachusetts: | 7.6% (92,959) |
| Marblehead: | 2.5% (39) |
| Massachusetts: | 0.3% (3,184) |
| Marblehead: | 2.0% (32) |
| Massachusetts: | 1.1% (13,446) |
| Marblehead: | 1.9% (31) |
| Massachusetts: | 0.3% (3,864) |
| Marblehead: | 1.8% (28) |
| Massachusetts: | 0.2% (2,231) |
| Marblehead: | 1.6% (26) |
| Massachusetts: | 0.4% (4,618) |
| Marblehead: | 1.6% (25) |
| Massachusetts: | 0.1% (1,702) |
| Marblehead: | 1.5% (24) |
| Massachusetts: | 0.3% (4,128) |
Place of birth for U.S.-born residents:
- This state: 12,479
- Other state: 5,663
- Northeast: 3,298
- Midwest: 1,073
- South: 816
- West: 474
95.2% of Marblehead residents lived in the same house 1 years ago.
Out of people who lived in different houses, 34.7% lived in this county.
Out of people who lived in different counties, 61.2% lived in Massachusetts.
| Marblehead: | 95.2% |
| State average: | 87.7% |
Education attainment for males 25 years and older:
- No schooling: 0
- Nursery to 4th grade: 0
- 5th and 6th grade: 6
- 7th and 8th grade: 0
- 9th grade: 29
- 10th grade: 0
- 11th grade: 19
- 12th grade, no diploma: 35
- High school graduate (or equivalency): 762
- Less than 1 year of college: 214
- Some college more than 1 year, no degree: 282
- Associate degree: 219
- Bachelor's degree: 2,645
- Master's degree: 1,686
- Professional school degree: 474
- Doctorate degree: 460

Education attainment for females 25 years and older:
- No schooling: 0
- Nursery to 4th grade: 12
- 5th and 6th grade: 0
- 7th and 8th grade: 0
- 9th grade: 7
- 10th grade: 0
- 11th grade: 0
- 12th grade, no diploma: 7
- High school graduate (or equivalency): 616
- Less than 1 year of college: 286
- Some college more than 1 year, no degree: 386
- Associate degree: 639
- Bachelor's degree: 3,325
- Master's degree: 1,899
- Professional school degree: 458
- Doctorate degree: 196


Housing units in structures:
- One, detached: 6,486
- One, attached: 377
- Two: 667
- 3 or 4: 679
- 5 to 9: 445
- 10 to 19: 49
- 20 to 49: 124
- 50 or more: 16
- Boats, RVs, vans, etc.: 34
Housing units lacking complete kitchen facilities in 2022: 0.2%
House/condo owner moved in on average 15 years ago
Renter moved in on average 3 years ago

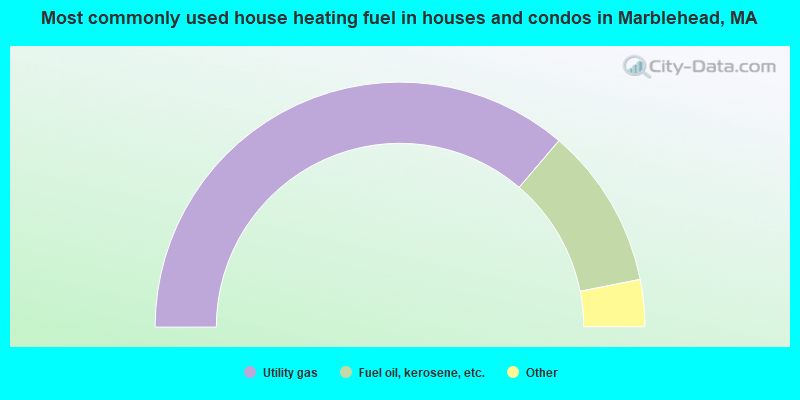
- 72.5%Utility gas
- 21.3%Fuel oil, kerosene, etc.
- 3.7%Electricity
- 2.0%Bottled, tank, or LP gas
- 0.5%Wood
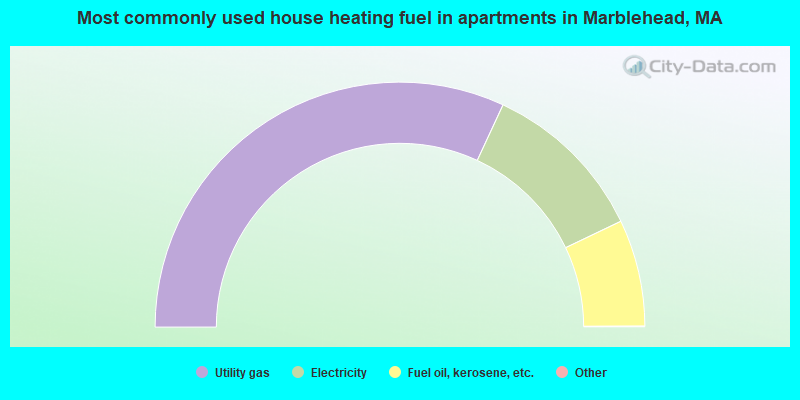
- 63.9%Utility gas
- 22.0%Electricity
- 14.1%Fuel oil, kerosene, etc.
Private vs. public school enrollment:
| Here: | 22.6% |
| Massachusetts: | 10.3% |
| Here: | 20.7% |
| Massachusetts: | 12.3% |
| Here: | 58.3% |
| Massachusetts: | 51.2% |


