Los Alamos, NM (New Mexico) Houses and Residents
Estimated median house or condo value in 2022: $461,552 (it was $204,300 in 2000 )
Los Alamos:
$461,552New Mexico:
$243,100
Lower value quartile - upper value quartile: $282,039 - $674,278Mean price in 2022: Detached houses: $508,960 Here:
$508,960State:
$322,045
Townhouses or other attached units: $333,904 Here:
$333,904State:
$284,053
In 2-unit structures: $239,343 Here:
$239,343State:
$354,971
In 3-to-4-unit structures: $241,379 Here:
$241,379State:
$235,720
In 5-or-more-unit structures: $144,052 Here:
$144,052State:
$217,304
Mobile homes: $140,777 Here:
$140,777State:
$117,675
Total population: 12,019 (Urban population: 10,722 (all inside urban clusters), Rural population: 1,180 (all nonfarm) )
Houses: 6,286 (6,082 occupied: 4,081 owner occupied, 2,175 renter occupied )
% of renters here:
35%State:
29%
Housing density: 579 houses/condos per square mile
Median price asked for vacant for-sale houses and condos in 2022 in this county: $220,485.
Median contract rent in 2022: $1,067 (lower quartile is $866, upper quartile is $1,435)
Median rent asked for vacant for-rent units in 2022: $4,569
Median gross rent in Los Alamos, NM in 2022: $1,208
Housing units in Los Alamos with a mortgage: 2,634 (177 second mortgage, 0 home equity loan, 85 both second mortgage and home equity loan )Houses without a mortgage: 98
Median household income for houses/condos with a mortgage: $175,302
Median household income for apartments without a mortgage: $133,180
Median monthly housing costs: $1,258
Data:
Median house or condo value ($)
Median house or condo value ($ change since 2000)
Median house or condo value ($) - White
Median house or condo value ($) - Black or African American
Median house or condo value ($) - Asian
Median house or condo value ($) - Hispanic or Latino
Median house or condo value ($) - American Indian and Alaska Native
Median house or condo value ($) - Multirace
Median house or condo value ($) - Other Race
Median price asked for mobile homes ($)
Household density (households per square mile)
Mean house or condo value by units in structure - 1, detached ($)
Mean house or condo value by units in structure - 1, attached ($)
Mean house or condo value by units in structure - 2 ($)
Mean house or condo value by units in structure by units in structure - 3 or 4 ($)
Mean house or condo value by units in structure - 5 or more ($)
Mean house or condo value by units in structure - Boat, RV, van, etc. ($)
Mean house or condo value by units in structure - Mobile home ($)
Median contract rent ($)
Median contract rent - Lower quartile ($)
Median contract rent - Upper quartile ($)
Median gross rent ($)
Urban houses (%)
Rural houses (%)
Houses occupied (%)
Houses occupied (% change since 2000)
Houses owner occupied (%)
Houses owner occupied (% change since 2000)
Houses renter occupied (%)
Houses renter occupied (% change since 2000)
Vacant housing units - For rent (%)
Vacant housing units - For rent (% change since 2000)
Vacant housing units - For sale only (%)
Vacant housing units - For sale only (% change since 2000)
Vacant housing units - Rented or sold, not occupied (%)
Vacant housing units - Rented or sold, not occupied (% change since 2000)
Vacant housing units - For seasonal, recreational, or occasional use (%)
Vacant housing units - For seasonal, recreational, or occasional use (% change since 2000)
Vacant housing units - For migrant workers (%)
Vacant housing units - For migrant workers (% change since 2000)
Vacant housing units - Other vacant (%)
Vacant housing units - Other vacant (% change since 2000)
Median monthly housing costs ($)
Median household income for houses/condos with a mortgage ($)
Median household income for houses/condos without a mortgage ($)
Median household income ($)
Median household income ($) - White
Median household income ($) - Black or African American
Median household income ($) - Asian
Median household income ($) - Hispanic or Latino
Median household income ($) - American Indian and Alaska Native
Median household income ($) - Multirace
Median household income ($) - Other Race
Mortgage status - with mortgage (%)
Mortgage status - with second mortgage (%)
Mortgage status - with home equity loan (%)
Mortgage status - with both second mortgage and home equity loan (%)
Mortgage status - without a mortgage (%)
Median year house/condo built
Median year apartment built
Household type by relationship - Male householder living alone (%)
Household type by relationship - Male householder not living alone (%)
Household type by relationship - Female householder living alone (%)
Household type by relationship - Female householder not living alone (%)
Household type by relationship - Opposite-Sex spouse (%)
Household type by relationship - Same-Sex spouse (%)
Household type by relationship - Opposite-Sex unmarried partner (%)
Household type by relationship - Same-Sex unmarried partner (%)
Household type by relationship - In group quarters (%)
Size of family households - 2-person household (%)
Size of family households - 3-person household (%)
Size of family households - 4-person household (%)
Size of family households - 5-person household (%)
Size of family households - 6-person household (%)
Size of family households - 7-or-more-person household (%)
Size of nonfamily households - 1-person household (%)
Size of nonfamily households - 2-person household (%)
Size of nonfamily households - 3-person household (%)
Size of nonfamily households - 4-person household (%)
Size of nonfamily households - 5-person household (%)
Size of nonfamily households - 6-person household (%)
Size of nonfamily households - 7-or-moreperson household (%)
Year house built - Built 2010 or later (%)
Year house built - Built 2000 to 2009 (%)
Year house built - Built 1990 to 1999 (%)
Year house built - Built 1980 to 1989 (%)
Year house built - Built 1970 to 1979 (%)
Year house built - Built 1960 to 1969 (%)
Year house built - Built 1950 to 1959 (%)
Year house built - Built 1940 to 1949 (%)
Year house built - Built 1939 or earlier (%)
Median number of rooms in houses and condos
Median number of rooms in apartments
Median number of bedrooms in owner occupied houses
Mean number of bedrooms in owner occupied houses
Median number of bedrooms in renter occupied houses
Mean number of bedrooms in renter occupied houses
Median number of vehichles in owner occupied houses
Mean number of vehichles in owner occupied houses
Median number of vehichles in renter occupied houses
Mean number of vehichles in renter occupied houses
Rooms in owner-occupied houses - 1 room (%)
Rooms in owner-occupied houses - 2 rooms (%)
Rooms in owner-occupied houses - 3 rooms (%)
Rooms in owner-occupied houses - 4 rooms (%)
Rooms in owner-occupied houses - 5 rooms (%)
Rooms in owner-occupied houses - 6 rooms (%)
Rooms in owner-occupied houses - 7 rooms (%)
Rooms in owner-occupied houses - 8 rooms (%)
Rooms in owner-occupied houses - 9+ rooms (%)
Rooms in renter-occupied houses - 1 room (%)
Rooms in renter-occupied houses - 2 rooms (%)
Rooms in renter-occupied houses - 3 rooms (%)
Rooms in renter-occupied houses - 4 rooms (%)
Rooms in renter-occupied houses - 5 rooms (%)
Rooms in renter-occupied houses - 6 rooms (%)
Rooms in renter-occupied houses - 7 rooms (%)
Rooms in renter-occupied houses - 8 rooms (%)
Rooms in renter-occupied houses - 9+ rooms (%)
Bedrooms in owner-occupied houses - no bedrooms (%)
Bedrooms in owner-occupied houses - 1 bedroom (%)
Bedrooms in owner-occupied houses - 2 bedrooms (%)
Bedrooms in owner-occupied houses - 3 bedrooms (%)
Bedrooms in owner-occupied houses - 4 bedrooms (%)
Bedrooms in owner-occupied houses - 5+ bedrooms (%)
Bedrooms in renter-occupied houses - no bedrooms (%)
Bedrooms in renter-occupied houses - 1 bedroom (%)
Bedrooms in renter-occupied houses - 2 bedrooms (%)
Bedrooms in renter-occupied houses - 3 bedrooms (%)
Bedrooms in renter-occupied houses - 4 bedrooms (%)
Bedrooms in renter-occupied houses - 5+ bedrooms (%)
Vehicles available in owner-occupied houses - no vehicle available (%)
Vehicles available in owner-occupied houses - 1 vehicle available(%)
Vehicles available in owner-occupied houses - 2 Vehicles available (%)
Vehicles available in owner-occupied houses - 3 Vehicles available (%)
Vehicles available in owner-occupied houses - 4 Vehicles available (%)
Vehicles available in owner-occupied houses - 5+ Vehicles available (%)
Vehicles available in renter-occupied houses - no vehicle available (%)
Vehicles available in renter-occupied houses - 1 vehicle available (%)
Vehicles available in renter-occupied houses - 2 Vehicles available (%)
Vehicles available in renter-occupied houses - 3 Vehicles available (%)
Vehicles available in renter-occupied houses - 4 Vehicles available (%)
Vehicles available in renter-occupied houses - 5+ Vehicles available (%)
Housing units in structures - 1, detached (%)
Housing units in structures - 1, attached (%)
Housing units in structures - 2 (%)
Housing units in structures - 3 or 4 (%)
Housing units in structures - 5 to 9 (%)
Housing units in structures - 10 to 19 (%)
Housing units in structures - 20 to 49 (%)
Housing units in structures - 50 or more (%)
Housing units in structures - Mobile home (%)
Housing units in structures - Boat, RV, van, etc. (%)
Housing units in structures - Owners - 1, detached (%)
Housing units in structures - Owners - 1, attached (%)
Housing units in structures - Owners - 2 (%)
Housing units in structures - Owners - 3 or 4 (%)
Housing units in structures - Owners - 5 to 9 (%)
Housing units in structures - Owners - 10 to 19 (%)
Housing units in structures - Owners - 20 to 49 (%)
Housing units in structures - Owners - 50 or more (%)
Housing units in structures - Owners - Mobile home (%)
Housing units in structures - Owners - Boat, RV, van, etc. (%)
Housing units in structures - Renters - 1, detached (%)
Housing units in structures - Renters - 1, attached (%)
Housing units in structures - Renters - 2 (%)
Housing units in structures - Renters - 3 or 4 (%)
Housing units in structures - Renters - 5 to 9 (%)
Housing units in structures - Renters - 10 to 19 (%)
Housing units in structures - Renters - 20 to 49 (%)
Housing units in structures - Renters - 50 or more (%)
Housing units in structures - Renters - Mobile home (%)
Housing units in structures - Renters - Boat, RV, van, etc. (%)
House/condo owner moved in on average (years ago)
Renter moved in on average (years ago)
Year householder moved into unit - Moved in 1999 to March 2000 (%)
Year householder moved into unit - Moved in 1999 to March 2000 (%) - White
Year householder moved into unit - Moved in 1999 to March 2000 (%) - Black or African American
Year householder moved into unit - Moved in 1999 to March 2000 (%) - Asian
Year householder moved into unit - Moved in 1999 to March 2000 (%) - Hispanic or Latino
Year householder moved into unit - Moved in 1999 to March 2000 (%) - American Indian and Alaska Native
Year householder moved into unit - Moved in 1999 to March 2000 (%) - Multirace
Year householder moved into unit - Moved in 1999 to March 2000 (%) - Other Race
Year householder moved into unit - Moved in 1995 to 1998 (%)
Year householder moved into unit - Moved in 1995 to 1998 (%) - White
Year householder moved into unit - Moved in 1995 to 1998 (%) - Black or African American
Year householder moved into unit - Moved in 1995 to 1998 (%) - Asian
Year householder moved into unit - Moved in 1995 to 1998 (%) - Hispanic or Latino
Year householder moved into unit - Moved in 1995 to 1998 (%) - American Indian and Alaska Native
Year householder moved into unit - Moved in 1995 to 1998 (%) - Multirace
Year householder moved into unit - Moved in 1995 to 1998 (%) - Other Race
Year householder moved into unit - Moved in 1990 to 1994 (%)
Year householder moved into unit - Moved in 1990 to 1994 (%) - White
Year householder moved into unit - Moved in 1990 to 1994 (%) - Black or African American
Year householder moved into unit - Moved in 1990 to 1994 (%) - Asian
Year householder moved into unit - Moved in 1990 to 1994 (%) - Hispanic or Latino
Year householder moved into unit - Moved in 1990 to 1994 (%) - American Indian and Alaska Native
Year householder moved into unit - Moved in 1990 to 1994 (%) - Multirace
Year householder moved into unit - Moved in 1990 to 1994 (%) - Other Race
Year householder moved into unit - Moved in 1980 to 1989 (%)
Year householder moved into unit - Moved in 1980 to 1989 (%) - White
Year householder moved into unit - Moved in 1980 to 1989 (%) - Black or African American
Year householder moved into unit - Moved in 1980 to 1989 (%) - Asian
Year householder moved into unit - Moved in 1980 to 1989 (%) - Hispanic or Latino
Year householder moved into unit - Moved in 1980 to 1989 (%) - American Indian and Alaska Native
Year householder moved into unit - Moved in 1980 to 1989 (%) - Multirace
Year householder moved into unit - Moved in 1980 to 1989 (%) - Other Race
Year householder moved into unit - Moved in 1970 to 1979 (%)
Year householder moved into unit - Moved in 1970 to 1979 (%) - White
Year householder moved into unit - Moved in 1970 to 1979 (%) - Black or African American
Year householder moved into unit - Moved in 1970 to 1979 (%) - Asian
Year householder moved into unit - Moved in 1970 to 1979 (%) - Hispanic or Latino
Year householder moved into unit - Moved in 1970 to 1979 (%) - American Indian and Alaska Native
Year householder moved into unit - Moved in 1970 to 1979 (%) - Multirace
Year householder moved into unit - Moved in 1970 to 1979 (%) - Other Race
Year householder moved into unit - Moved in 1969 or earlier (%)
Year householder moved into unit - Moved in 1969 or earlier (%) - White
Year householder moved into unit - Moved in 1969 or earlier (%) - Black or African American
Year householder moved into unit - Moved in 1969 or earlier (%) - Asian
Year householder moved into unit - Moved in 1969 or earlier (%) - Hispanic or Latino
Year householder moved into unit - Moved in 1969 or earlier (%) - American Indian and Alaska Native
Year householder moved into unit - Moved in 1969 or earlier (%) - Multirace
Year householder moved into unit - Moved in 1969 or earlier (%) - Other Race
Housing units lacking complete plumbing facilities (%)
Housing units lacking complete kitchen facilities (%)
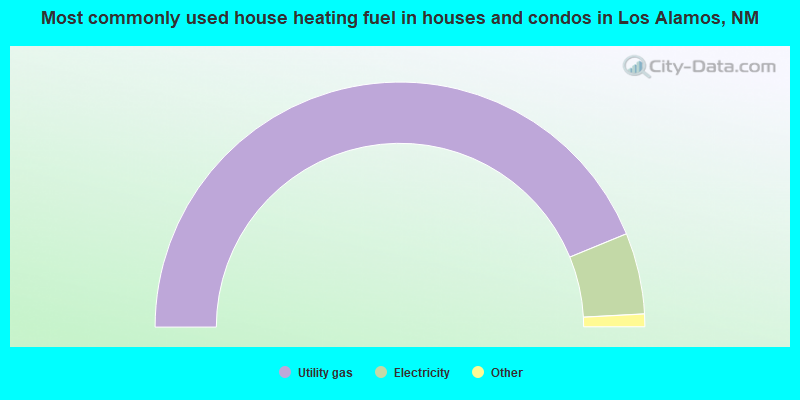
House heating fuel used in houses and condos - Utility gas (%)
House heating fuel used in houses and condos - Bottled, tank, or LP gas (%)
House heating fuel used in houses and condos - Electricity (%)
House heating fuel used in houses and condos - Fuel oil, kerosene, etc. (%)
House heating fuel used in houses and condos - Coal or coke (%)
House heating fuel used in houses and condos - Wood (%)
House heating fuel used in houses and condos - Solar energy (%)
House heating fuel used in houses and condos - Other fuel (%)
House heating fuel used in houses and condos - No fuel used (%)
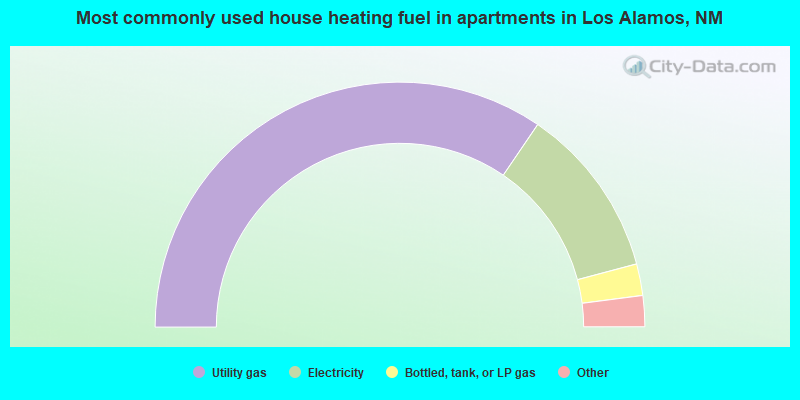
House heating fuel used in apartments - Utility gas (%)
House heating fuel used in apartments - Bottled, tank, or LP gas (%)
House heating fuel used in apartments - Electricity (%)
House heating fuel used in apartments - Fuel oil, kerosene, etc. (%)
House heating fuel used in apartments - Coal or coke (%)
House heating fuel used in apartments - Wood (%)
House heating fuel used in apartments - Solar energy (%)
House heating fuel used in apartments - Other fuel (%)
House heating fuel used in apartments - No fuel used (%)
Median year house/condo built: 1973Median year apartment built: 1975Household type by relationship:
Households: 13,465
Male householders: 3,483 (1,098 living alone ), Female householders: 2,515 (871 living alone )2,941 spouses (2,927 opposite-sex spouses ), 264 unmarried partners , (251 opposite-sex unmarried partners ), 3,309 children (3,123 natural , 124 adopted , 62 stepchildren ), 99 grandchildren , 116 brothers or sisters , 172 parents , 0 foster children , 120 other relatives , 342 non-relatives In group quarters: 103
Size of family households: 2,050 2-persons , 845 3-persons , 589 4-persons , 130 5-persons , 124 6-persons , 13 7-or-more-persons .
Size of nonfamily households: 2,102 1-person , 427 2-persons .
1,856 married couples with children. single-parent households (253 men , 308 women ).
84.5% of residents of Los Alamos speak English at home. of residents speak Spanish at home (86% speak English very well , 12% speak English well , 2% speak English not well ).of residents speak other Indo-European language at home (78% speak English very well , 17% speak English well , 5% speak English not well ).of residents speak Asian or Pacific Island language at home (70% speak English very well , 23% speak English well , 2% speak English not well , 4% don't speak English at all ).of residents speak other language at home (46% speak English very well , 43% speak English well , 11% don't speak English at all ).
Foreign born population: 1,563 (11.6%)of them are naturalized citizens )
Median number of rooms in houses and condos:
Median number of rooms in apartments
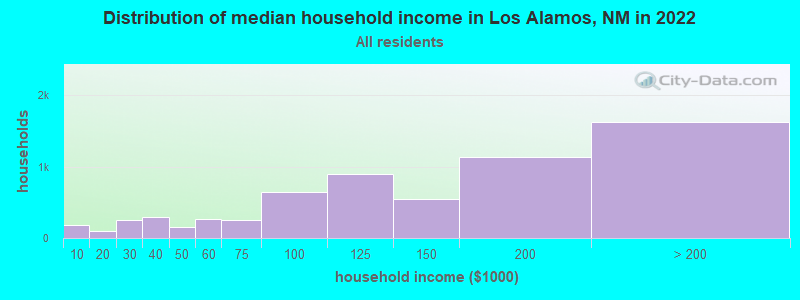
Los Alamos, NM household income distribution 178 Less than $10,00098 $10,000 to $19,999246 $20,000 to $29,999300 $30,000 to $39,999158 $40,000 to $49,999262 $50,000 to $59,999251 $60,000 to $74,999651 $75,000 to $99,999899 $100,000 to $124,999547 $125,000 to $149,9991,130 $150,000 to $199,9991,626 $200,000 or more
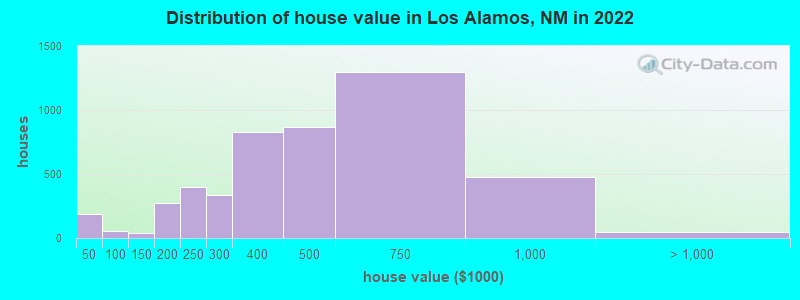
Home value of owner - occupied houses in 2022 in Los Alamos, NM 29 Less than $10,00022 $20,000 to $24,99936 $25,000 to $29,999102 $30,000 to $34,9998 $50,000 to $59,9997 $60,000 to $69,99935 $70,000 to $79,99921 $100,000 to $124,99916 $125,000 to $149,99991 $150,000 to $174,999185 $175,000 to $199,999395 $200,000 to $249,999337 $250,000 to $299,999826 $300,000 to $399,999863 $400,000 to $499,9991,300 $500,000 to $749,999473 $750,000 to $999,99947 $1,000,000 to $1,499,999Rent paid by renters in 2022 in Los Alamos, NM 10 $200 to $24914 $250 to $2995 $350 to $39953 $500 to $54941 $550 to $59935 $600 to $64928 $650 to $69982 $700 to $749106 $750 to $799280 $800 to $899212 $900 to $999291 $1,000 to $1,249345 $1,250 to $1,499275 $1,500 to $1,999203 $2,000 to $2,49921 $3,500 or more26 No cash rent
Percentage of workers working in this county: 96.9%Number of people working at home: 1,251 (16.1% of all workers )
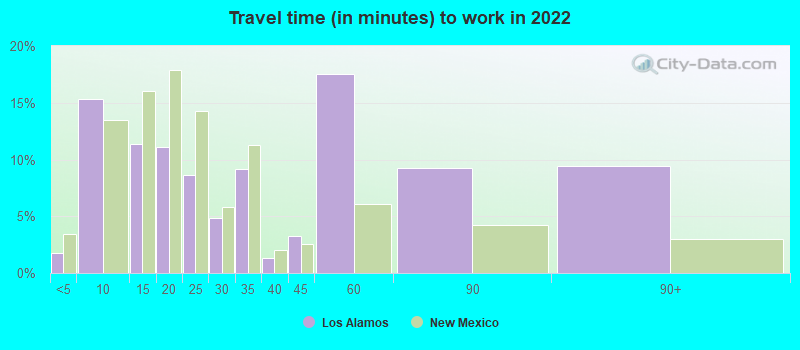
Travel time to work (commute)
Less than 5 minutes: 1105 to 9 minutes: 1,46510 to 14 minutes: 2,33515 to 19 minutes: 1,48220 to 24 minutes: 76625 to 29 minutes: 6730 to 34 minutes: 14435 to 39 minutes: 040 to 44 minutes: 6045 to 59 minutes: 6660 to 89 minutes: 290 or more minutes: 75
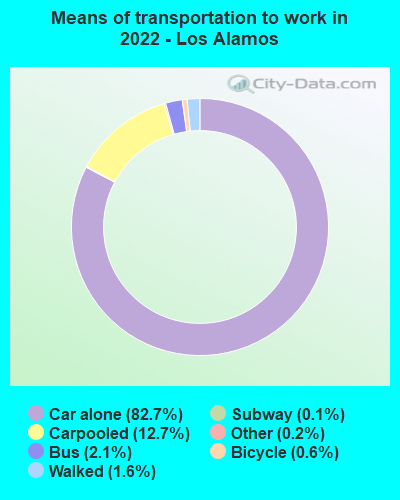
Means of transportation to work:
Drove a car alone: 5,724 (69.7%)Carpooled: 955 (11.6%)Bus : 128 (1.6%)Long-distance train or commuter rail : 13 (0.2%)Taxi: 16 (0.2%)Bicycle: 40 (0.5%)Walked: 121 (1.5%)Worked at home: 1,251 (15.2%)
Unemployment by race in 2022
Unemployment rate for White non-Hispanic residents 0.8% Males1.1% FemalesUnemployment rate for Black residents 53.3% MalesUnemployment rate for other race residents 21.0% MalesUnemployment rate for Hispanic or Latino residents 4.0% Males
Year of entry for the foreign-born population in Los Alamos, New Mexico
792 2010 or later 308 2000 to 2009 168 1990 to 1999 154 1980 to 1989 73 1970 to 1979 194 Before 1970
First ancestries reported:
English: 851 (12.6%)
German: 558 (8.3%)
European: 467 (6.9%)
American: 342 (5.1%)
Italian: 274 (4.1%)
Irish: 261 (3.9%)
Polish: 126 (1.9%)
Scottish: 106 (1.6%)
Eastern European: 72 (1.1%)
Swedish: 69 (1.0%)
Belgian: 60 (0.9%)
Greek: 59 (0.9%)
Russian: 53 (0.8%)
French: 49 (0.7%)
Ethiopian: 46 (0.7%)
Norwegian: 42 (0.6%)
Serbian: 41 (0.6%)
Ukrainian: 38 (0.6%)
British: 33 (0.5%)
Canadian: 33 (0.5%)
Nigerian: 33 (0.5%)
Northern European: 28 (0.4%)
Scotch-Irish: 28 (0.4%)
Dutch: 23 (0.3%)
Welsh: 20 (0.3%)
French Canadian: 20 (0.3%)
Danish: 17 (0.3%)
Hungarian: 12 (0.2%)
Slavic: 11 (0.2%)
Latvian: 9 (0.1%)
Swiss: 9 (0.1%)
Slovene: 8 (0.1%)
Scandinavian: 8 (0.1%)
New Zealander: 8 (0.1%)
Slovak: 6 (0.09%)
Croatian: 4 (0.06%)
African: 1 (0.01%) Most common places of birth for foreign-born residents (%): China, excluding Hong Kong and Taiwan Los Alamos:
28.0% (440)New Mexico:
1.6% (3,140)
Mexico Los Alamos:
7.5% (118)New Mexico:
66.5% (129,316)
India Los Alamos:
6.4% (101)New Mexico:
1.5% (3,002)
Korea Los Alamos:
5.2% (82)New Mexico:
0.8% (1,632)
Taiwan Los Alamos:
5.1% (81)New Mexico:
0.3% (530)
Canada Los Alamos:
4.3% (68)New Mexico:
1.1% (2,195)
Ukraine Los Alamos:
3.5% (55)New Mexico:
0.2% (383)
Bangladesh Los Alamos:
3.1% (48)New Mexico:
0.2% (477)
Serbia Los Alamos:
2.9% (45)New Mexico:
0.2% (304)
Ethiopia Los Alamos:
2.9% (45)New Mexico:
0.1% (205)
Poland Los Alamos:
2.2% (34)New Mexico:
0.3% (512)
Other Eastern Europe Los Alamos:
2.1% (33)New Mexico:
0.1% (197)
Russia Los Alamos:
2.0% (31)New Mexico:
0.4% (750)
Nigeria Los Alamos:
2.0% (31)New Mexico:
0.7% (1,297)
Vietnam Los Alamos:
1.8% (28)New Mexico:
2.1% (4,150)
Colombia Los Alamos:
1.7% (26)New Mexico:
0.6% (1,258)
Philippines Los Alamos:
1.6% (25)New Mexico:
3.2% (6,181)
Spain Los Alamos:
1.5% (24)New Mexico:
0.3% (673)
Place of birth for U.S.-born residents:
This state: 3,989Other state: 7,883Northeast: 1,098Midwest: 1,848South: 1,767West: 3,173 86.0% of Los Alamos residents lived in the same house 1 years ago.
Out of people who lived in different houses, 26.3% lived in this county.
Out of people who lived in different counties, 18.8% lived in New Mexico.
Los Alamos:
86.0%State average:
88.2%
Education attainment for males 25 years and older:
No schooling: 8Nursery to 4th grade: 05th and 6th grade: 287th and 8th grade: 239th grade: 710th grade: 011th grade: 012th grade, no diploma: 47High school graduate (or equivalency): 408Less than 1 year of college: 194Some college more than 1 year, no degree: 601Associate degree: 229Bachelor's degree: 1,114Master's degree: 1,038Professional school degree: 95Doctorate degree: 1,396
Education attainment for females 25 years and older:
No schooling: 31Nursery to 4th grade: 105th and 6th grade: 297th and 8th grade: 09th grade: 6710th grade: 1111th grade: 012th grade, no diploma: 9High school graduate (or equivalency): 545Less than 1 year of college: 83Some college more than 1 year, no degree: 387Associate degree: 238Bachelor's degree: 1,661Master's degree: 1,279Professional school degree: 126Doctorate degree: 644
Housing units in structures:
One, detached: 3,194One, attached: 734Two: 1703 or 4: 4025 to 9: 33610 to 19: 36720 to 49: 54750 or more: 159Mobile homes: 373Median worth of mobile homes: $185,425
Housing units lacking complete plumbing facilities in 2022: 0.3%Housing units lacking complete kitchen facilities in 2022: 1.0%House/condo owner moved in on average 9 years ago
Renter moved in on average 2 years ago
Private vs. public school enrollment:
Students in private schools in grades 1 to 8 (elementary and middle school): 101 Here:
8.1%New Mexico:
10.2%
Students in private schools in grades 9 to 12 (high school): 18 Here:
2.1%New Mexico:
10.0%
Students in private undergraduate colleges: 149 Here:
25.6%New Mexico:
12.3%