Logan, UT (Utah) Houses and Residents
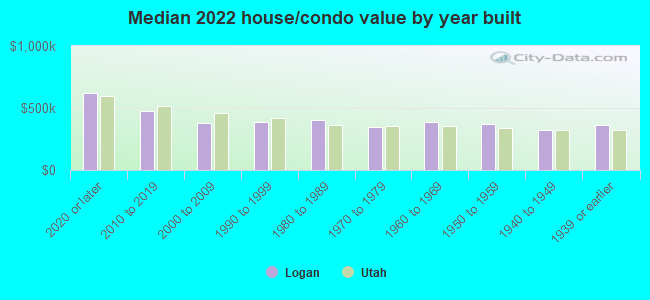
| Logan: | $384,233 |
| Utah: | $499,500 |
Mean price in 2022:
Detached houses: $435,621
Here: $435,621 State: $607,750 Townhouses or other attached units: $316,154
Here: $316,154 State: $444,505 In 2-unit structures: $355,850
Here: $355,850 State: $433,540 In 3-to-4-unit structures: $315,241
Here: $315,241 State: $362,850 In 5-or-more-unit structures: $284,389
Here: $284,389 State: $412,810 Mobile homes: $39,146
Here: $39,146 State: $113,475
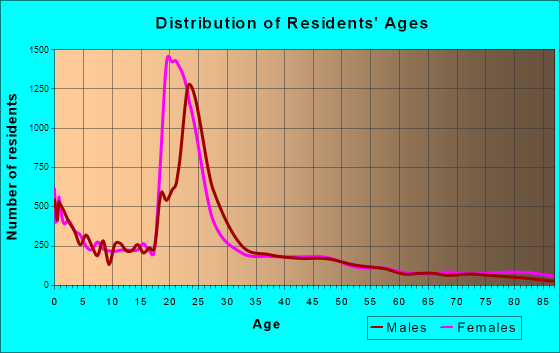
Total population: 48,997 (Urban population: 42,534, Rural population: 191 (19 farm, 172 nonfarm))
Houses: 19,938 (18,668 occupied: 7,691 owner occupied, 11,374 renter occupied)
| % of renters here: | 60% |
| State: | 29% |
Housing density: 1,207 houses/condos per square mile
Median price asked for vacant for-sale houses and condos in 2022: $1,004,486.
Median contract rent in 2022: $982 (lower quartile is $686, upper quartile is $1,314)
Median rent asked for vacant for-rent units in 2022: $1,005
Median gross rent in Logan, UT in 2022: $1,133
Housing units in Logan with a mortgage: 4,901 (446 second mortgage, 15 home equity loan, 291 both second mortgage and home equity loan)
Houses without a mortgage: 69
Median household income for houses/condos with a mortgage: $86,781
Median household income for apartments without a mortgage: $80,911
Median monthly housing costs: $1,123
Compare current foreclosures in Logan, UT:
| Photo | Address | Area | Beds / Baths | Price | Details |
|---|---|---|---|---|---|

|
#1
800 East
Logan, UT 84341
|
1,013 sq. feet
|
1 baths 3 beds |
show details | |

|
#2
Beech Ct
Logan, UT 84321
|
965 sq. feet
|
- baths - beds |
show details | |

|
#3
N 400 E
Logan, UT 84341
|
- sq. feet
|
- baths - beds |
show details | |

|
#4
E 3100 N
Logan, UT 84341
|
- sq. feet
|
- baths - beds |
show details | |

|
#5
Knowles Ln
Logan, UT 84321
|
- sq. feet
|
- baths - beds |
show details | |

|
#6
E 100 N Apt F
Logan, UT 84321
|
- sq. feet
|
- baths - beds |
show details | |

|
#7
S 100 E
Logan, UT 84321
|
- sq. feet
|
- baths - beds |
show details | |

|
#8
W 200 N
Logan, UT 84321
|
- sq. feet
|
- baths - beds |
show details | |

|
#9
N 400 E, Apt 428
Logan, UT 84341
|
- sq. feet
|
- baths - beds |
show details | |

|
#10
N 400 E, Apt 4
Logan, UT 84341
|
- sq. feet
|
- baths - beds |
show details |
| Photo | Address | Area | Beds / Baths | Price | Details |
|---|---|---|---|---|---|

|
#11
W 600 S
Logan, UT 84321
|
- sq. feet
|
- baths - beds |
show details | |

|
#12
E 1900 N
Logan, UT 84341
|
- sq. feet
|
- baths - beds |
show details | |

|
#13
N 480 W
Logan, UT 84321
|
- sq. feet
|
- baths - beds |
show details | |

|
#14
W 1100 N
Logan, UT 84341
|
- sq. feet
|
- baths - beds |
show details | |

|
#15
W 800 S
Logan, UT 84321
|
- sq. feet
|
- baths - beds |
show details | |

|
#16
N 290 W, Apt 3
Logan, UT 84341
|
- sq. feet
|
- baths - beds |
show details | |

|
#17
W 1800 N Apt A104
Logan, UT 84341
|
- sq. feet
|
- baths - beds |
show details | |

|
#18
N 100 W, Apt 4
Logan, UT 84321
|
- sq. feet
|
- baths - beds |
show details | |

|
#19
E 2200 N
Logan, UT 84341
|
- sq. feet
|
- baths - beds |
show details | |

|
#20
N 400 E Apt 5c
Logan, UT 84341
|
- sq. feet
|
- baths - beds |
show details |
| Photo | Address | Area | Beds / Baths | Price | Details |
|---|---|---|---|---|---|

|
#21
River Heights Blvd
Logan, UT 84321
|
- sq. feet
|
- baths - beds |
show details | |

|
#22
N 400 E
Logan, UT 84341
|
- sq. feet
|
- baths - beds |
show details | |

|
#23
E 900 N
Logan, UT 84321
|
- sq. feet
|
- baths - beds |
show details | |

|
#24
W 1190 N
Logan, UT 84341
|
- sq. feet
|
- baths - beds |
show details | |

|
#25
N 150 W
Logan, UT 84321
|
- sq. feet
|
- baths - beds |
show details | |

|
#26
S Main St
Logan, UT 84321
|
- sq. feet
|
- baths - beds |
show details | |

|
#27
Ginger Cir
Logan, UT 84321
|
- sq. feet
|
- baths - beds |
show details | |

|
#28
E 200 N # 2
Logan, UT 84321
|
- sq. feet
|
- baths - beds |
show details | |

|
#29
E 1300 N, Apt F106
Logan, UT 84341
|
- sq. feet
|
- baths - beds |
show details | |

|
#30
Canyon Rd Apt 4
Logan, UT 84321
|
- sq. feet
|
- baths - beds |
show details |
| Photo | Address | Area | Beds / Baths | Price | Details |
|---|---|---|---|---|---|

|
#31
1/2 N 600 E, Apt 10
Logan, UT 84321
|
- sq. feet
|
- baths - beds |
show details | |

|
#32
E 870 N
Logan, UT 84321
|
- sq. feet
|
- baths - beds |
show details | |

|
#33
W 1100 N
Logan, UT 84341
|
- sq. feet
|
- baths - beds |
show details | |

|
#34
N 1250 E
Logan, UT 84321
|
- sq. feet
|
- baths - beds |
show details | |

|
#35
N 200 E, Apt 328
Logan, UT 84341
|
- sq. feet
|
- baths - beds |
show details | |

|
#36
N 200 E
Logan, UT 84341
|
- sq. feet
|
- baths - beds |
show details | |

|
#37
N 400 E, Apt 628
Logan, UT 84341
|
- sq. feet
|
- baths - beds |
show details | |

|
#38
N 200 E, Apt 4
Logan, UT 84321
|
- sq. feet
|
- baths - beds |
show details | |

|
#39
Winding Way
Logan, UT 84321
|
- sq. feet
|
- baths - beds |
show details | |

|
#40
N 400 E
Logan, UT 84321
|
- sq. feet
|
- baths - beds |
show details |
| Photo | Address | Area | Beds / Baths | Price | Details |
|---|---|---|---|---|---|

|
#41
E 1370 N Apt 5
Logan, UT 84341
|
- sq. feet
|
- baths - beds |
show details | |

|
#42
N 360 E
Logan, UT 84341
|
- sq. feet
|
- baths - beds |
show details | |

|
#43
N 200 W
Logan, UT 84321
|
- sq. feet
|
- baths - beds |
show details | |

|
#44
Maple Cir
Logan, UT 84341
|
- sq. feet
|
- baths - beds |
show details | |

|
#45
E 700 S
Logan, UT 84321
|
- sq. feet
|
- baths - beds |
show details | |

|
#46
W 2200 S # B108
Logan, UT 84321
|
- sq. feet
|
- baths - beds |
show details | |

|
#47
W 200 S
Logan, UT 84321
|
- sq. feet
|
- baths - beds |
show details | |

|
#48
S 100 E
Logan, UT 84321
|
- sq. feet
|
- baths - beds |
show details | |

|
#49
S 400 W # 1
Logan, UT 84321
|
- sq. feet
|
- baths - beds |
show details | |

|
Check over 1 million property listings on Foreclosure.com!
|
browse all offers | |||

Latest news about housing in Logan, UT collected exclusively by city-data.com from local newspapers, TV, and radio stations

 | How hard is it to find a rental house in Logan? (0 replies) |
| Rental homes in Logan (0 replies) |
| Any recommendations for apartment rentals in Logan/Brigham City/Ogden (4 replies) |
| Logan as a new home. (1 reply) |
| Pet friendly apartments in Logan, UT (1 reply) |
| Logan Utah airport question (5 replies) |
Median year apartment built: 1983
Household type by relationship:
Households: 55,521- Male householders: 9,403 (1,863 living alone), Female householders: 8,987 (1,672 living alone)
9,375 spouses (9,330 opposite-sex spouses), 719 unmarried partners, (651 opposite-sex unmarried partners), 14,467 children (13,900 natural, 210 adopted, 356 stepchildren), 530 grandchildren, 728 brothers or sisters, 301 parents, 19 foster children, 608 other relatives, 6,753 non-relatives
- In group quarters: 3,624
Size of family households: 5,761 2-persons, 2,255 3-persons, 1,628 4-persons, 1,111 5-persons, 723 6-persons, 472 7-or-more-persons.
Size of nonfamily households: 3,867 1-person, 1,383 2-persons, 1,057 3-persons, 869 4-persons, 69 5-persons, 266 6-persons, 18 7-or-more-persons.
9,077 married couples with children.
1,388 single-parent households (227 men, 1,161 women).
84.6% of residents of Logan speak English at home.
9.9% of residents speak Spanish at home (71% speak English very well, 16% speak English well, 10% speak English not well, 3% don't speak English at all).
1.6% of residents speak other Indo-European language at home (83% speak English very well, 10% speak English well, 5% speak English not well, 2% don't speak English at all).
3.4% of residents speak Asian or Pacific Island language at home (38% speak English very well, 25% speak English well, 35% speak English not well, 2% don't speak English at all).
0.4% of residents speak other language at home (97% speak English very well, 3% speak English well).
Foreign born population: 4,206 (7.6%)
(43.3% of them are naturalized citizens)
| Here: | 7.2 |
| State: | 7.6 |
| Here: | 4.3 |
| State: | 4.3 |
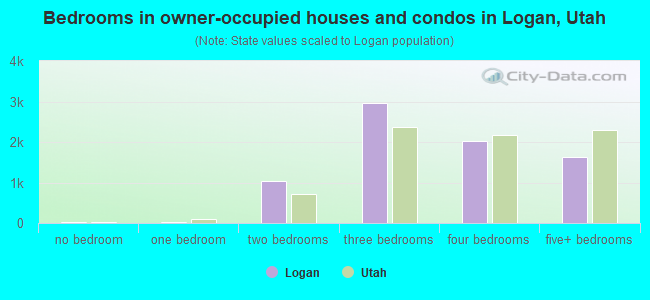
- Bedrooms in owner-occupied houses and condos in Logan, Utah
- 37no bedroom
- 131 bedroom
- 1,0362 bedrooms
- 2,9643 bedrooms
- 2,0174 bedrooms
- 1,6255+ bedrooms
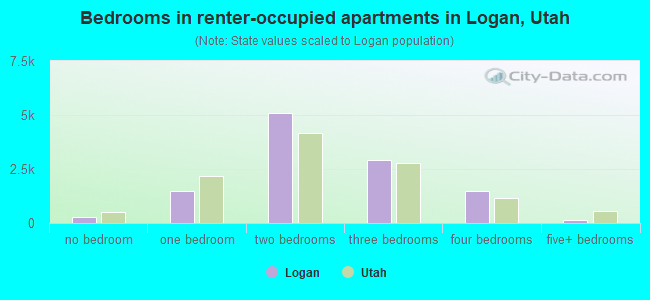
- Bedrooms in renter-occupied apartments in Logan, Utah
- 272no bedroom
- 1,4831 bedroom
- 5,0802 bedrooms
- 2,9343 bedrooms
- 1,4594 bedrooms
- 1465+ bedrooms
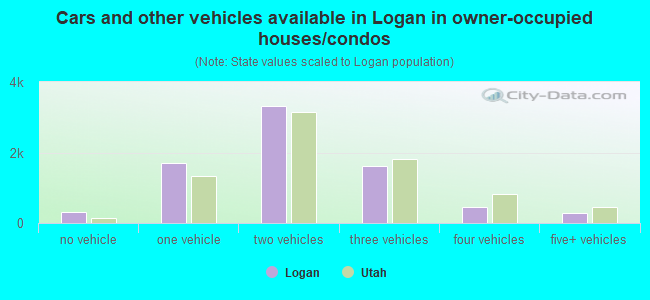
- Cars and other vehicles available in Logan in owner-occupied houses/condos
- 326no vehicle
- 1,6961 vehicle
- 3,3062 vehicles
- 1,6193 vehicles
- 4614 vehicles
- 2835+ vehicles
- Cars and other vehicles available in Logan in renter-occupied apartments
- 635no vehicle
- 3,5861 vehicle
- 4,7902 vehicles
- 1,5213 vehicles
- 5294 vehicles
- 3155+ vehicles
- Rooms in owner-occupied houses in Logan, Utah
- 281 room
- 02 rooms
- 1373 rooms
- 6524 rooms
- 1,1685 rooms
- 1,2336 rooms
- 9647 rooms
- 1,1268 rooms
- 2,3839+ rooms
- Rooms in renter-occupied apartments in Logan, Utah
- 1871 room
- 5382 rooms
- 1,6913 rooms
- 3,7564 rooms
- 2,2105 rooms
- 1,2116 rooms
- 8427 rooms
- 4068 rooms
- 5349+ rooms
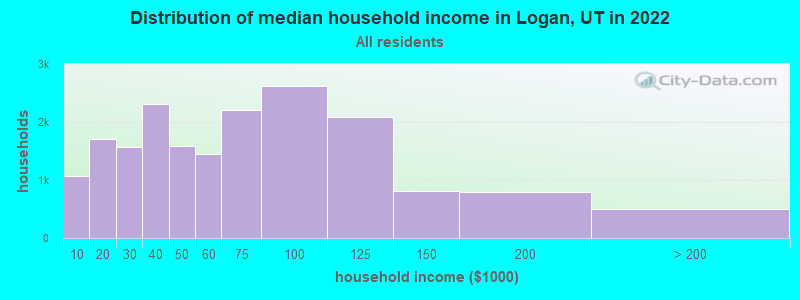
Logan, UT household income distribution

- 1,064Less than $10,000
- 1,700$10,000 to $19,999
- 1,567$20,000 to $29,999
- 2,317$30,000 to $39,999
- 1,581$40,000 to $49,999
- 1,440$50,000 to $59,999
- 2,202$60,000 to $74,999
- 2,629$75,000 to $99,999
- 2,079$100,000 to $124,999
- 818$125,000 to $149,999
- 785$150,000 to $199,999
- 496$200,000 or more
Home value of owner - occupied houses in 2022 in Logan, UT
-
- 3$10,000 to $14,999
- 63$15,000 to $19,999
- 14$20,000 to $24,999
- 1$25,000 to $29,999
- 93$35,000 to $39,999
- 12$40,000 to $49,999
- 56$50,000 to $59,999
- 54$60,000 to $69,999
- 62$80,000 to $89,999
- 7$90,000 to $99,999
- 161$100,000 to $124,999
- 103$125,000 to $149,999
- 154$150,000 to $174,999
- 257$175,000 to $199,999
- 550$200,000 to $249,999
- 601$250,000 to $299,999
- 1,322$300,000 to $399,999
- 1,011$400,000 to $499,999
- 854$500,000 to $749,999
- 139$750,000 to $999,999
- 132$1,000,000 to $1,499,999
- 47$2,000,000 or more
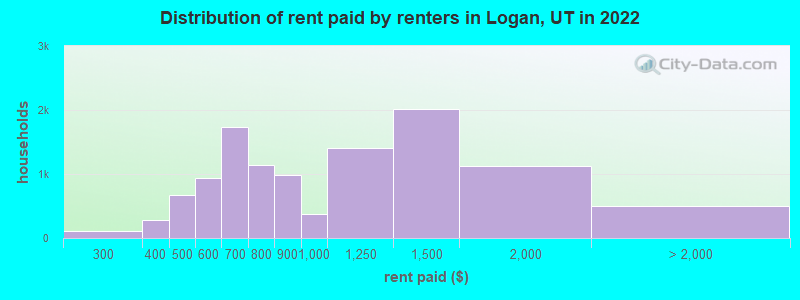
Rent paid by renters in 2022 in Logan, UT
-
- 14Less than $100
- 1$100 to $149
- 33$200 to $249
- 83$250 to $299
- 145$300 to $349
- 134$350 to $399
- 501$400 to $449
- 176$450 to $499
- 502$500 to $549
- 438$550 to $599
- 1,151$600 to $649
- 584$650 to $699
- 470$700 to $749
- 668$750 to $799
- 981$800 to $899
- 372$900 to $999
- 1,410$1,000 to $1,249
- 2,015$1,250 to $1,499
- 1,131$1,500 to $1,999
- 102$2,000 to $2,499
- 13$2,500 to $2,999
- 80$3,500 or more
- 301No cash rent
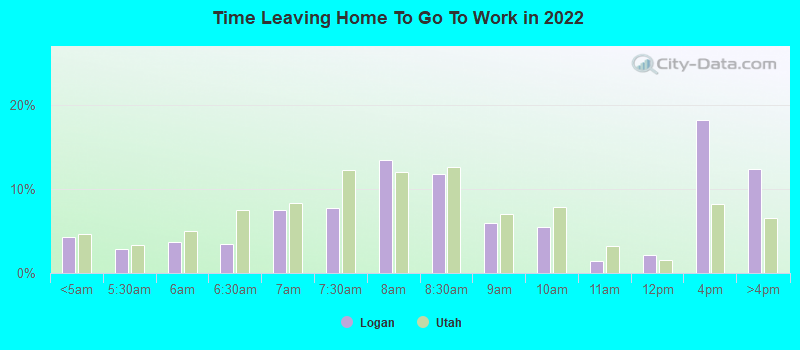
Percentage of workers working in this county: 95.4%
Number of people working at home: 4,561 (14.1% of all workers)
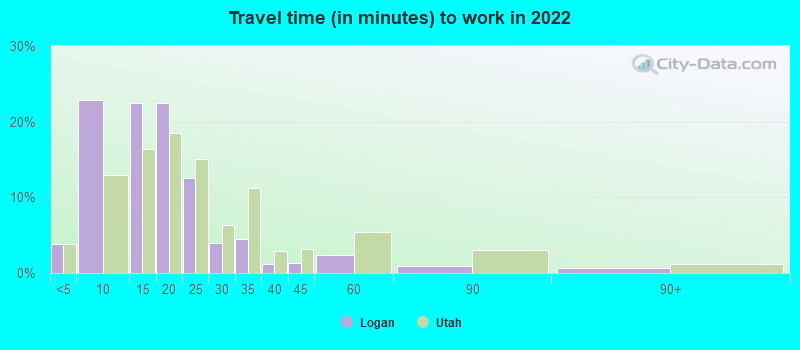
Travel time to work (commute)
- Less than 5 minutes: 1,207
- 5 to 9 minutes: 7,640
- 10 to 14 minutes: 6,489
- 15 to 19 minutes: 5,543
- 20 to 24 minutes: 2,809
- 25 to 29 minutes: 541
- 30 to 34 minutes: 1,101
- 35 to 39 minutes: 356
- 40 to 44 minutes: 197
- 45 to 59 minutes: 530
- 60 to 89 minutes: 346
- 90 or more minutes: 265
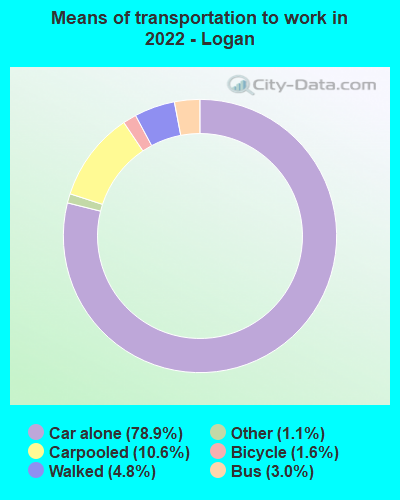
Means of transportation to work:
- Drove a car alone: 31,625 (69.2%)
- Carpooled: 3,958 (8.7%)
- Bus: 1,790 (3.9%)
- Taxi: 519 (1.1%)
- Bicycle: 978 (2.1%)
- Walked: 1,673 (3.7%)
- Worked at home: 4,561 (10.0%)
- Unemployment by race in 2022
- Unemployment rate for White non-Hispanic residents
- 1.6%Males
- 2.3%Females
- Unemployment rate for Asian residents
- 1.1%Females
- Unemployment rate for two or more race residents
- 12.9%Males
- 2.6%Females
- Unemployment rate for Hispanic or Latino residents
- 5.1%Males
- 0.8%Females
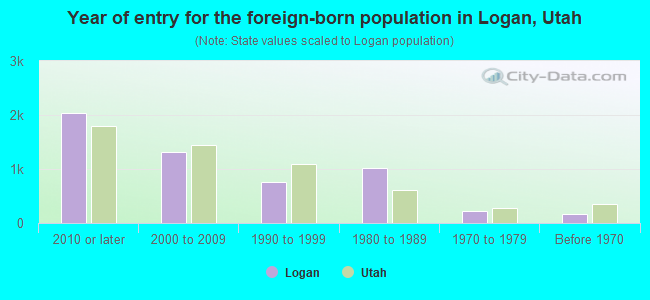
- Year of entry for the foreign-born population in Logan, Utah
- 2,0372010 or later
- 1,3242000 to 2009
- 7561990 to 1999
- 1,0251980 to 1989
- 2271970 to 1979
- 175Before 1970
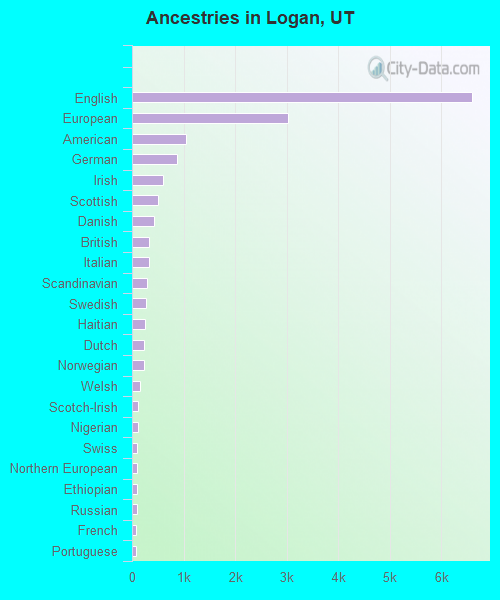
First ancestries reported:
- English: 6,594 (26.0%)
- European: 3,031 (11.9%)
- American: 1,055 (4.2%)
- German: 867 (3.4%)
- Irish: 603 (2.4%)
- Scottish: 511 (2.0%)
- Danish: 432 (1.7%)
- British: 333 (1.3%)
- Italian: 325 (1.3%)
- Scandinavian: 298 (1.2%)
- Swedish: 266 (1.0%)
- Haitian: 248 (1.0%)
- Dutch: 240 (0.9%)
- Norwegian: 237 (0.9%)
- Welsh: 155 (0.6%)
- Scotch-Irish: 114 (0.4%)
- Nigerian: 110 (0.4%)
- Swiss: 103 (0.4%)
- Northern European: 94 (0.4%)
- Ethiopian: 94 (0.4%)
- Russian: 88 (0.3%)
- French: 87 (0.3%)
- Portuguese: 74 (0.3%)
- Canadian: 46 (0.2%)
- Hungarian: 45 (0.2%)
- Polish: 36 (0.1%)
- Brazilian: 30 (0.1%)
- Serbian: 28 (0.1%)
- Greek: 26 (0.1%)
- Iranian: 23 (0.09%)
- Czech: 18 (0.07%)
- Eastern European: 14 (0.06%)
- African: 13 (0.05%)
- Basque: 12 (0.05%)
- Ukrainian: 12 (0.05%)
- Jamaican: 8 (0.03%)
- Icelander: 8 (0.03%)
- Lithuanian: 7 (0.03%)
- Romanian: 5 (0.02%)
- Slovene: 5 (0.02%)
- Turkish: 4 (0.02%)
- Armenian: 4 (0.02%)
- French Canadian: 2 (0.01%)
Most common places of birth for foreign-born residents (%):
| Logan: | 32.1% (1,555) |
| Utah: | 36.1% (99,740) |
| Logan: | 7.1% (346) |
| Utah: | 2.9% (8,017) |
| Logan: | 5.0% (243) |
| Utah: | 0.8% (2,087) |
| Logan: | 5.0% (243) |
| Utah: | 0.3% (824) |
| Logan: | 4.8% (230) |
| Utah: | 3.0% (8,341) |
| Logan: | 4.0% (193) |
| Utah: | 0.3% (782) |
| Logan: | 3.6% (173) |
| Utah: | 0.4% (1,109) |
| Logan: | 3.1% (148) |
| Utah: | 0.0% (102) |
| Logan: | 3.0% (144) |
| Utah: | 2.6% (7,062) |
| Logan: | 2.9% (142) |
| Utah: | 2.8% (7,644) |
| Logan: | 2.9% (139) |
| Utah: | 2.1% (5,902) |
| Logan: | 2.0% (98) |
| Utah: | 2.6% (7,211) |
| Logan: | 1.9% (94) |
| Utah: | 0.2% (415) |
| Logan: | 1.9% (90) |
| Utah: | 0.3% (893) |
Place of birth for U.S.-born residents:
- This state: 32,873
- Other state: 17,701
- Northeast: 853
- Midwest: 2,146
- South: 3,300
- West: 11,485
70.9% of Logan residents lived in the same house 1 years ago.
Out of people who lived in different houses, 37.6% lived in this county.
Out of people who lived in different counties, 58.7% lived in Utah.
| Logan: | 70.9% |
| State average: | 85.7% |
Education attainment for males 25 years and older:
- No schooling: 179
- Nursery to 4th grade: 29
- 5th and 6th grade: 72
- 7th and 8th grade: 83
- 9th grade: 179
- 10th grade: 94
- 11th grade: 84
- 12th grade, no diploma: 382
- High school graduate (or equivalency): 2,345
- Less than 1 year of college: 937
- Some college more than 1 year, no degree: 2,057
- Associate degree: 932
- Bachelor's degree: 3,337
- Master's degree: 1,556
- Professional school degree: 180
- Doctorate degree: 548
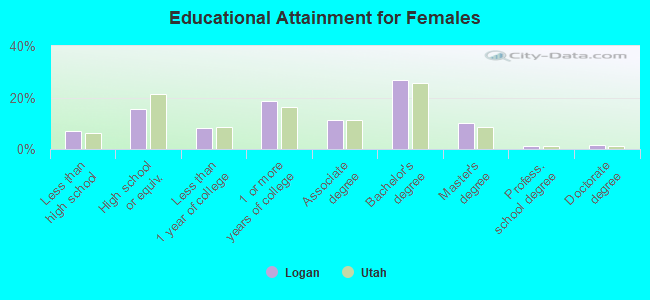
Education attainment for females 25 years and older:
- No schooling: 100
- Nursery to 4th grade: 13
- 5th and 6th grade: 12
- 7th and 8th grade: 26
- 9th grade: 254
- 10th grade: 84
- 11th grade: 134
- 12th grade, no diploma: 186
- High school graduate (or equivalency): 1,806
- Less than 1 year of college: 940
- Some college more than 1 year, no degree: 2,207
- Associate degree: 1,326
- Bachelor's degree: 3,128
- Master's degree: 1,188
- Professional school degree: 142
- Doctorate degree: 184
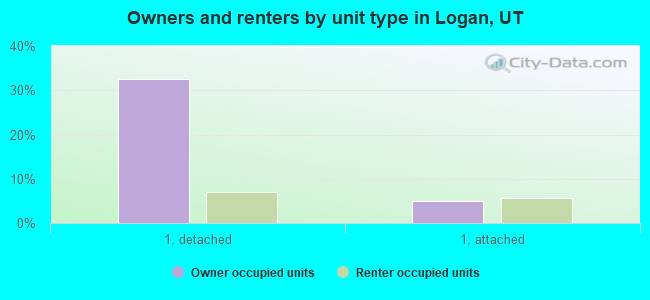
Housing units in structures:
- One, detached: 8,000
- One, attached: 2,199
- Two: 1,626
- 3 or 4: 3,636
- 5 to 9: 1,435
- 10 to 19: 1,347
- 20 to 49: 853
- 50 or more: 446
- Mobile homes: 392
Median worth of mobile homes: $66,115
Housing units lacking complete kitchen facilities in 2022: 1.2%
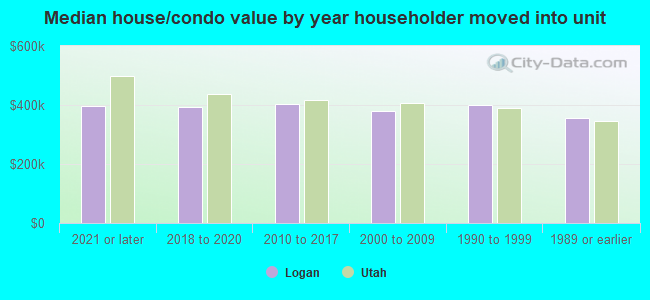
House/condo owner moved in on average 7 years ago
Renter moved in on average 0 years ago
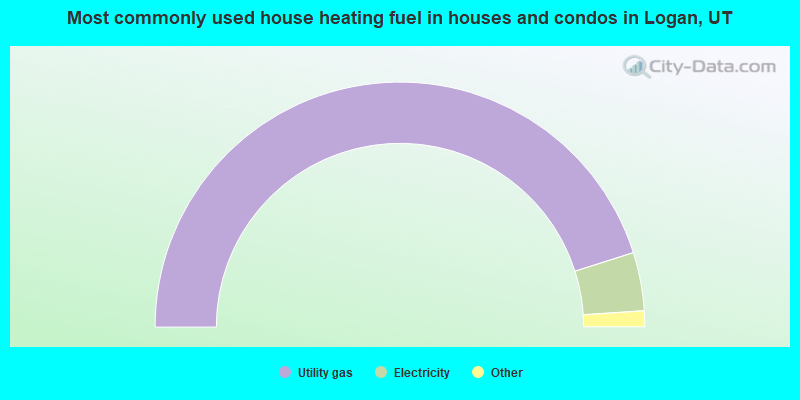
- 90.3%Utility gas
- 7.7%Electricity
- 1.5%Bottled, tank, or LP gas
- 0.2%Wood
- 0.2%Solar energy
- 0.1%Other fuel
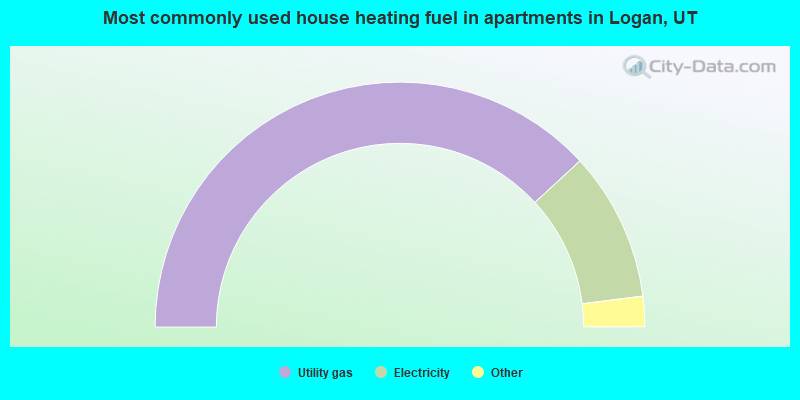
- 76.3%Utility gas
- 19.7%Electricity
- 1.7%Bottled, tank, or LP gas
- 0.9%Other fuel
- 0.7%Fuel oil, kerosene, etc.
- 0.6%No fuel used
- 0.1%Solar energy
Private vs. public school enrollment:
| Here: | 6.4% |
| Utah: | 7.2% |
| Here: | 6.3% |
| Utah: | 5.3% |
| Here: | 4.6% |
| Utah: | 26.7% |