Housing density: 860 houses/condos per square mile
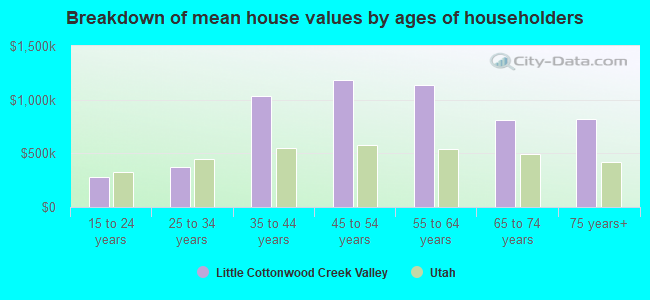
Median price asked for vacant for-sale houses and condos in 2022 in this county: $719,617.
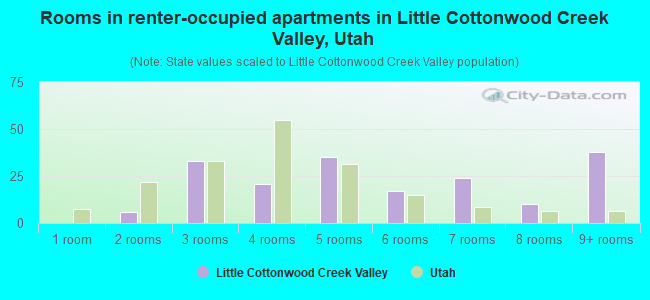
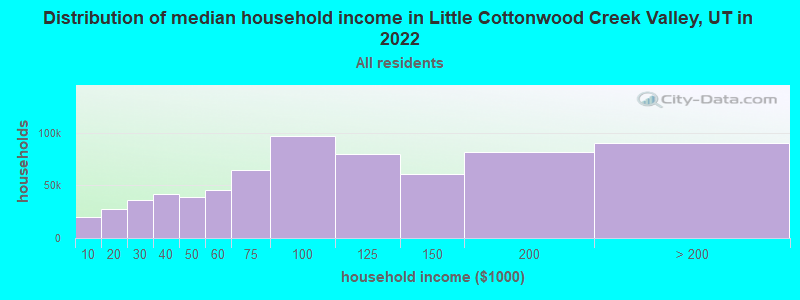
Median contract rent in 2022: $1,413 (lower quartile is $907, upper quartile is over $2,000)
Median rent asked for vacant for-rent units in 2022: $3,206
Median gross rent in Little Cottonwood Creek Valley, UT in 2022: $1,406
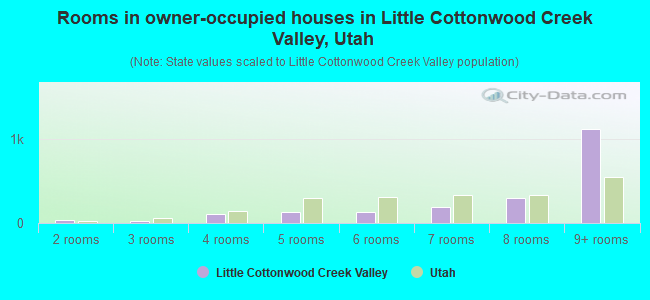
Housing units in Little Cottonwood Creek Valley with a mortgage: 1,289 (167 second mortgage, 191 home equity loan, 8 both second mortgage and home equity loan) Houses without a mortgage: 473
Compare current foreclosures near Little Cottonwood Creek Valley, UT:
In family households: 879,880 (178,461 male householders, 64,165 female householders)
187,678 spouses, 347,268 children (321,676 natural, 9,572 adopted, 16,020 stepchildren), 25,511 grandchildren, 12,209 brothers or sisters, 7,940 parents, foster children, 18,887 other relatives, 27,608 non-relatives
In nonfamily households: 135,769 (49,607 male householders (35,052 living alone)), 50,389 female householders (40,012 living alone)), 35,773 nonrelatives
In group quarters: 14,006 (9,420 institutionalized population)
205,311 married couples with children.
43,285 single-parent households (10,357 men, 32,928 women).
92.2% of residents of Little Cottonwood Creek Valley speak English at home.
2.1% of residents speak Spanish at home (70% speak English very well, 20% speak English well, 10% speak English not well).
3.8% of residents speak other Indo-European language at home (67% speak English very well, 22% speak English well, 11% speak English not well).
1.4% of residents speak Asian or Pacific Island language at home (65% speak English very well, 21% speak English well, 14% speak English not well).
0.5% of residents speak other language at home (100% speak English very well).
Foreign born population: 495 (5.2%)
(93.1% of them are naturalized citizens)
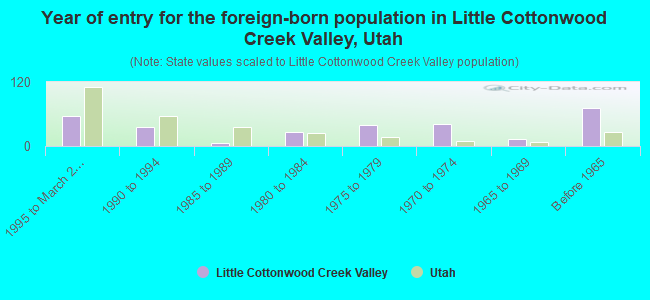
Year of entry for the foreign-born population in Little Cottonwood Creek Valley, Utah
561995 to March 2000
361990 to 1994
61985 to 1989
261980 to 1984
401975 to 1979
411970 to 1974
131965 to 1969
71Before 1965
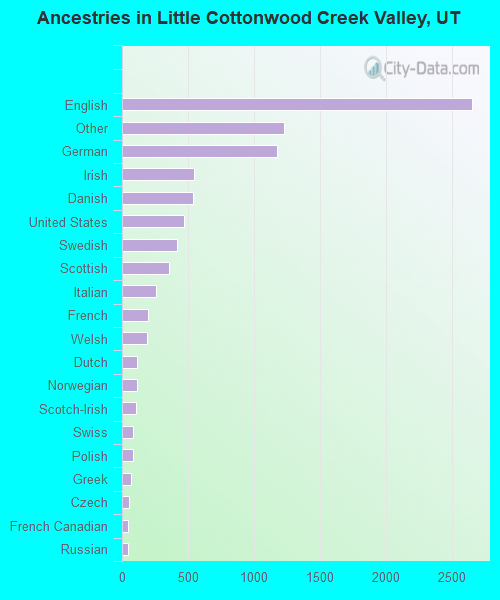
First ancestries reported:
English: 2,651 (30.2%)
Other: 1,225 (14.0%)
German: 1,174 (13.4%)
Irish: 545 (6.2%)
Danish: 537 (6.1%)
United States: 469 (5.3%)
Swedish: 415 (4.7%)
Scottish: 358 (4.1%)
Italian: 258 (2.9%)
French: 200 (2.3%)
Welsh: 189 (2.2%)
Dutch: 115 (1.3%)
Norwegian: 111 (1.3%)
Scotch-Irish: 103 (1.2%)
Swiss: 86 (1.0%)
Polish: 80 (0.9%)
Greek: 70 (0.8%)
Czech: 53 (0.6%)
French Canadian: 43 (0.5%)
Russian: 42 (0.5%)
Ukrainian: 19 (0.2%)
Hungarian: 17 (0.2%)
Arab: 6 (0.07%)
Lithuanian: 3 (0.03%)
Most common places of birth for foreign-born residents (%):
Germany
Little Cottonwood Creek Valley:
14.2% (41)
Utah:
3.2% (5,086)
Canada
Little Cottonwood Creek Valley:
13.8% (40)
Utah:
4.9% (7,722)
Taiwan
Little Cottonwood Creek Valley:
10.0% (29)
Utah:
0.7% (1,098)
United Kingdom
Little Cottonwood Creek Valley:
9.7% (28)
Utah:
3.0% (4,784)
Other Northern Europe
Little Cottonwood Creek Valley:
9.0% (26)
Utah:
1.0% (1,655)
Russia
Little Cottonwood Creek Valley:
6.2% (18)
Utah:
0.9% (1,392)
Netherlands
Little Cottonwood Creek Valley:
4.8% (14)
Utah:
1.3% (2,020)
Hong Kong
Little Cottonwood Creek Valley:
4.8% (14)
Utah:
0.3% (537)
Poland
Little Cottonwood Creek Valley:
4.5% (13)
Utah:
0.4% (627)
Iran
Little Cottonwood Creek Valley:
3.5% (10)
Utah:
0.7% (1,050)
Czechoslovakia (includes Czech Republic and Slovakia)
Little Cottonwood Creek Valley:
2.4% (7)
Utah:
0.3% (460)
China, excluding Hong Kong and Taiwan
Little Cottonwood Creek Valley:
2.4% (7)
Utah:
2.0% (3,195)
Brazil
Little Cottonwood Creek Valley:
2.4% (7)
Utah:
1.6% (2,507)
Korea
Little Cottonwood Creek Valley:
2.1% (6)
Utah:
1.9% (3,013)
Other South Eastern Asia
Little Cottonwood Creek Valley:
2.1% (6)
Utah:
0.1% (104)
Mexico
Little Cottonwood Creek Valley:
2.1% (6)
Utah:
41.9% (66,478)
Bolivia
Little Cottonwood Creek Valley:
2.1% (6)
Utah:
0.3% (428)
Chile
Little Cottonwood Creek Valley:
2.1% (6)
Utah:
0.9% (1,405)
Thailand
Little Cottonwood Creek Valley:
1.7% (5)
Utah:
0.6% (959)
Place of birth for U.S.-born residents:
This state: 4,572
Other state: 2,329
Northeast: 280
Midwest: 426
South: 262
West: 1,361
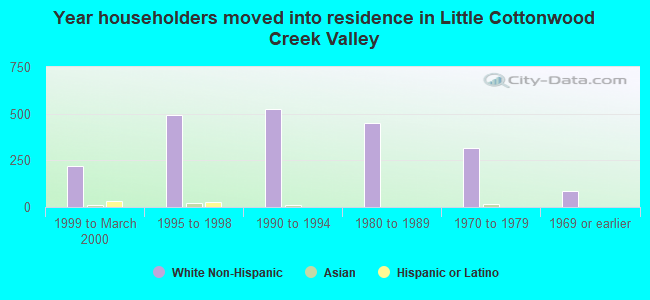
70% of Little Cottonwood Creek Valley residents lived in the same house 5 years ago. Out of people who lived in different houses, 66% lived in this county. Out of people who lived in different counties, 26% lived in Utah.
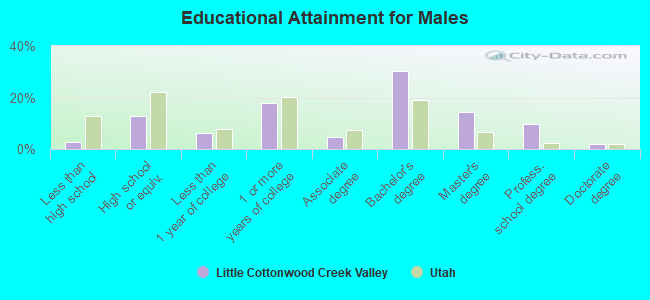
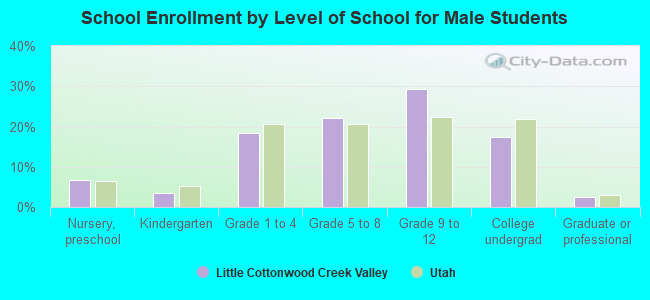
Education attainment for males 25 years and older:
No schooling: 6
Nursery to 4th grade: 0
5th and 6th grade: 0
7th and 8th grade: 7
9th grade: 0
10th grade: 0
11th grade: 21
12th grade, no diploma: 22
High school graduate (or equivalency): 266
Less than 1 year of college: 128
Some college more than 1 year, no degree: 370
Associate degree: 94
Bachelor's degree: 625
Master's degree: 294
Professional school degree: 198
Doctorate degree: 41
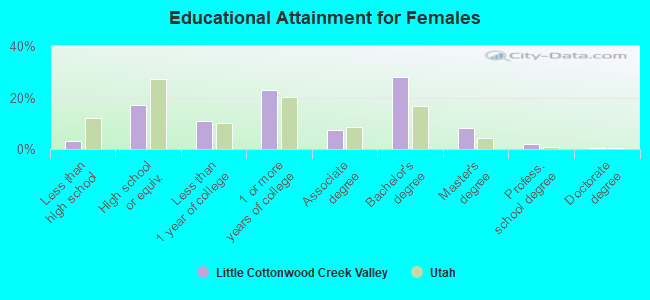
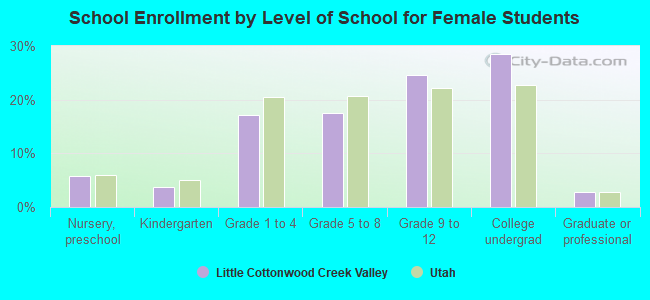
Education attainment for females 25 years and older:
No schooling: 22
Nursery to 4th grade: 0
5th and 6th grade: 0
7th and 8th grade: 6
9th grade: 6
10th grade: 8
11th grade: 15
12th grade, no diploma: 14
High school graduate (or equivalency): 376
Less than 1 year of college: 237
Some college more than 1 year, no degree: 501
Associate degree: 160
Bachelor's degree: 618
Master's degree: 179
Professional school degree: 44
Doctorate degree: 12
Housing units in structures:
One, detached: 1,845
One, attached: 97
Two: 41
5 to 9: 30
10 to 19: 52
20 to 49: 21
50 or more: 13
Mobile homes: 139
Median worth of mobile homes: $66,789
Housing units lacking complete kitchen facilities: 0.2%