Housing density: 263 houses/condos per square mile
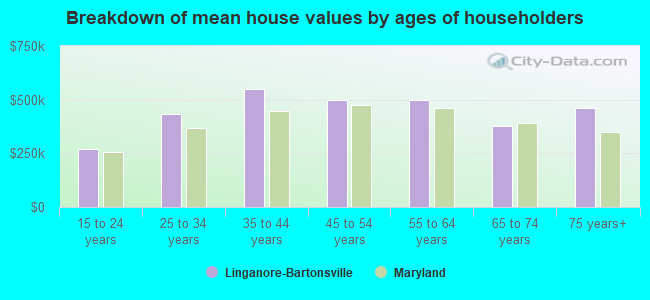
Median price asked for vacant for-sale houses and condos in 2022 in this county: $402,870.
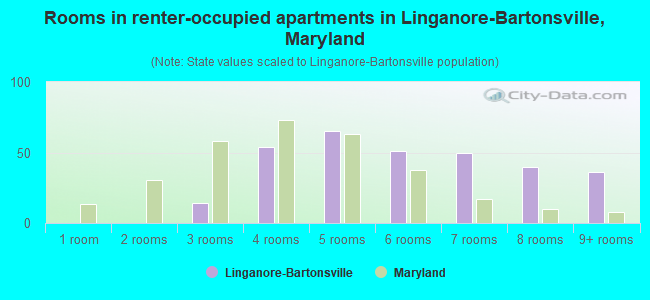
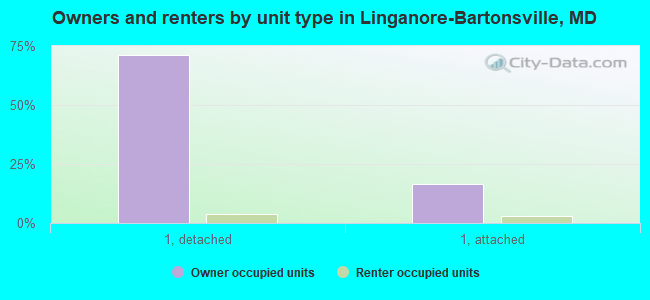
Median contract rent in 2022: over $2,000 (lower quartile is $1,029, upper quartile is over $2,000)
Median rent asked for vacant for-rent units in 2022: $3,043
Median gross rent in Linganore-Bartonsville, MD in 2022: over $2,000
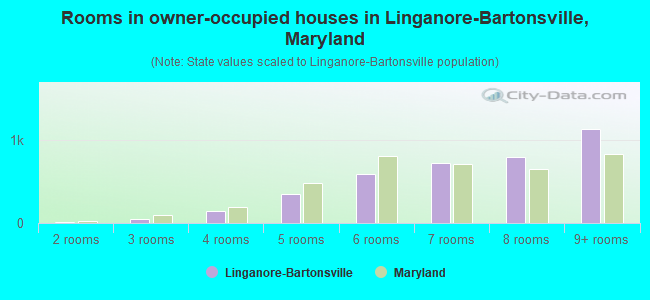
Housing units in Linganore-Bartonsville with a mortgage: 3,163 (455 second mortgage, 453 home equity loan, 0 both second mortgage and home equity loan) Houses without a mortgage: 278
Compare current foreclosures near Linganore-Bartonsville, MD:
In family households: 199,111 (45,130 male householders, 16,068 female householders)
49,048 spouses, 71,169 children (66,662 natural, 1,549 adopted, 2,958 stepchildren), 3,868 grandchildren, 1,839 brothers or sisters, 2,153 parents, foster children, 2,881 other relatives, 5,194 non-relatives
In nonfamily households: 30,092 (10,870 male householders (8,043 living alone)), 12,732 female householders (10,582 living alone)), 6,490 nonrelatives
In group quarters: 4,182 (1,640 institutionalized population)
41,250 married couples with children.
8,777 single-parent households (2,130 men, 6,647 women).
94.6% of residents of Linganore-Bartonsville speak English at home.
2.2% of residents speak Spanish at home (82% speak English very well, 15% speak English well, 3% speak English not well).
1.9% of residents speak other Indo-European language at home (74% speak English very well, 13% speak English well, 12% speak English not well).
1.0% of residents speak Asian or Pacific Island language at home (67% speak English very well, 19% speak English well, 15% speak English not well).
0.3% of residents speak other language at home (77% speak English very well, 23% speak English well).
Foreign born population: 2,716 (14.9%)
(57.9% of them are naturalized citizens)
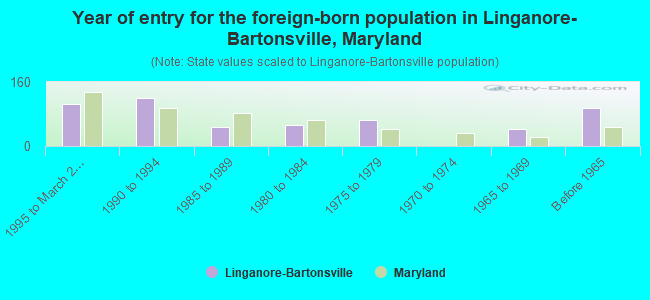
Year of entry for the foreign-born population in Linganore-Bartonsville, Maryland
1041995 to March 2000
1191990 to 1994
471985 to 1989
521980 to 1984
641975 to 1979
01970 to 1974
421965 to 1969
95Before 1965
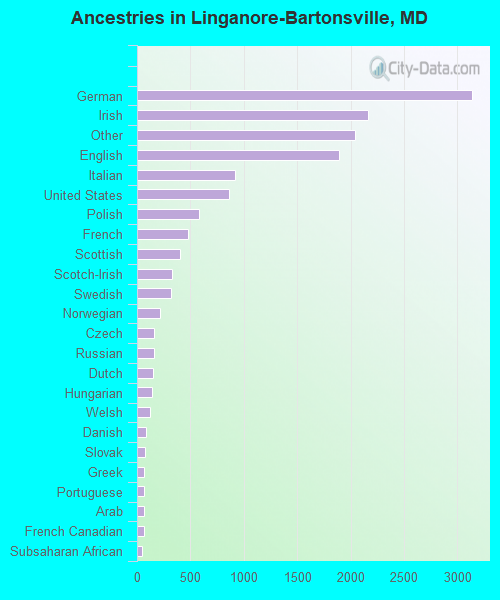
First ancestries reported:
German: 3,139 (21.5%)
Irish: 2,160 (14.8%)
Other: 2,041 (14.0%)
English: 1,890 (13.0%)
Italian: 914 (6.3%)
United States: 862 (5.9%)
Polish: 585 (4.0%)
French: 476 (3.3%)
Scottish: 406 (2.8%)
Scotch-Irish: 326 (2.2%)
Swedish: 319 (2.2%)
Norwegian: 218 (1.5%)
Czech: 161 (1.1%)
Russian: 158 (1.1%)
Dutch: 151 (1.0%)
Hungarian: 145 (1.0%)
Welsh: 126 (0.9%)
Danish: 81 (0.6%)
Slovak: 79 (0.5%)
Greek: 69 (0.5%)
Portuguese: 66 (0.5%)
Arab: 65 (0.4%)
French Canadian: 62 (0.4%)
Subsaharan African: 46 (0.3%)
Swiss: 22 (0.2%)
Lithuanian: 11 (0.08%)
Ukrainian: 8 (0.05%)
Most common places of birth for foreign-born residents (%):
South Africa
Linganore-Bartonsville:
12.8% (67)
Maryland:
0.3% (1,541)
Vietnam
Linganore-Bartonsville:
11.1% (58)
Maryland:
2.9% (14,807)
Germany
Linganore-Bartonsville:
9.0% (47)
Maryland:
2.8% (14,555)
Canada
Linganore-Bartonsville:
8.8% (46)
Maryland:
1.7% (9,019)
Guatemala
Linganore-Bartonsville:
7.1% (37)
Maryland:
2.0% (10,309)
Russia
Linganore-Bartonsville:
5.7% (30)
Maryland:
1.7% (8,723)
United Kingdom
Linganore-Bartonsville:
5.4% (28)
Maryland:
2.7% (14,206)
Italy
Linganore-Bartonsville:
4.6% (24)
Maryland:
1.2% (6,266)
Philippines
Linganore-Bartonsville:
4.2% (22)
Maryland:
4.1% (21,007)
Other Western Asia
Linganore-Bartonsville:
3.1% (16)
Maryland:
0.4% (2,102)
France
Linganore-Bartonsville:
2.7% (14)
Maryland:
0.8% (4,318)
India
Linganore-Bartonsville:
2.5% (13)
Maryland:
6.2% (32,276)
Other Western Africa
Linganore-Bartonsville:
2.5% (13)
Maryland:
1.7% (8,678)
Korea
Linganore-Bartonsville:
2.3% (12)
Maryland:
6.0% (31,249)
Netherlands
Linganore-Bartonsville:
2.1% (11)
Maryland:
0.3% (1,415)
Turkey
Linganore-Bartonsville:
1.9% (10)
Maryland:
0.4% (2,147)
Peru
Linganore-Bartonsville:
1.9% (10)
Maryland:
1.6% (8,407)
Czechoslovakia (includes Czech Republic and Slovakia)
Linganore-Bartonsville:
1.7% (9)
Maryland:
0.3% (1,565)
Poland
Linganore-Bartonsville:
1.7% (9)
Maryland:
0.8% (4,199)
Romania
Linganore-Bartonsville:
1.7% (9)
Maryland:
0.3% (1,547)
Sweden
Linganore-Bartonsville:
1.5% (8)
Maryland:
0.2% (778)
Jordan
Linganore-Bartonsville:
1.5% (8)
Maryland:
0.1% (658)
Argentina
Linganore-Bartonsville:
1.5% (8)
Maryland:
0.6% (2,999)
Place of birth for U.S.-born residents:
This state: 6,032
Other state: 5,691
Northeast: 2,177
Midwest: 920
South: 2,186
West: 408
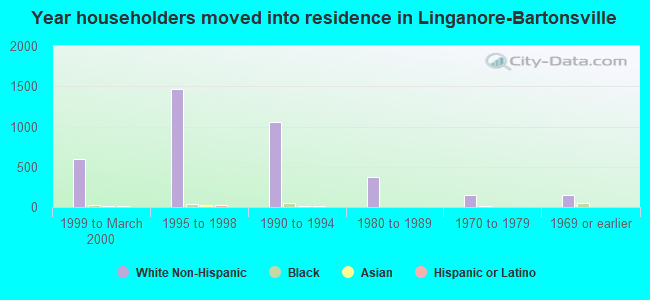
47% of Linganore-Bartonsville residents lived in the same house 5 years ago. Out of people who lived in different houses, 36% lived in this county. Out of people who lived in different counties, 62% lived in Maryland.
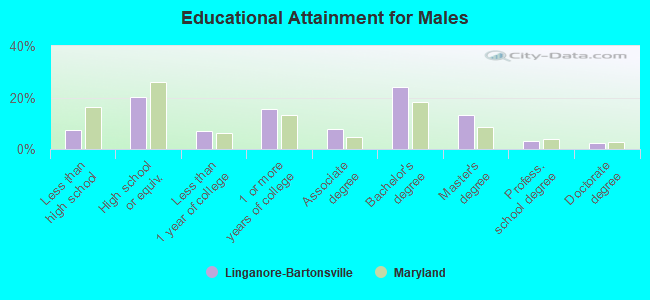
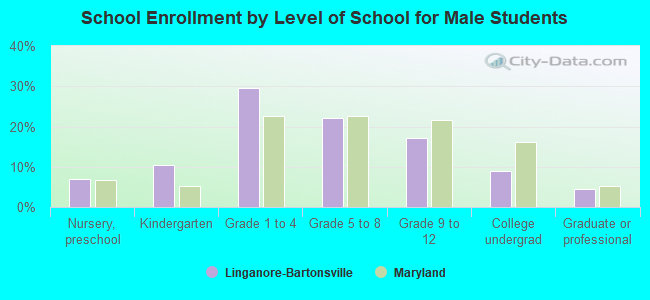
Education attainment for males 25 years and older:
No schooling: 23
Nursery to 4th grade: 0
5th and 6th grade: 5
7th and 8th grade: 59
9th grade: 11
10th grade: 51
11th grade: 44
12th grade, no diploma: 82
High school graduate (or equivalency): 776
Less than 1 year of college: 260
Some college more than 1 year, no degree: 588
Associate degree: 295
Bachelor's degree: 923
Master's degree: 498
Professional school degree: 114
Doctorate degree: 94
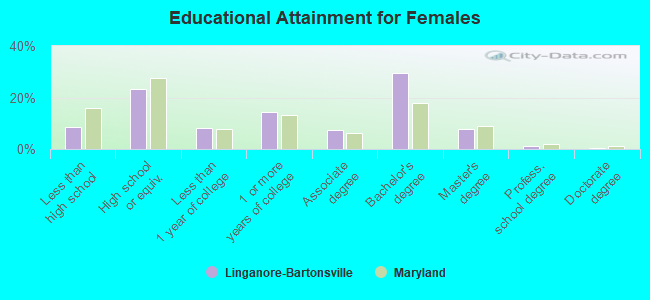
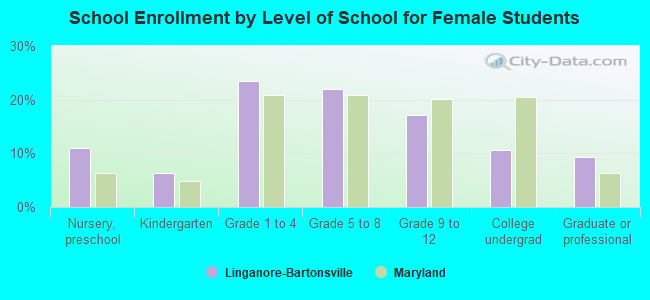
Education attainment for females 25 years and older: