Linden, NJ (New Jersey) Houses and Residents
| Linden: | $389,504 |
| New Jersey: | $428,900 |
Mean price in 2022:
Detached houses: $410,410
Here: $410,410 State: $537,591 Townhouses or other attached units: $334,212
Here: $334,212 State: $381,113 In 2-unit structures: $479,356
Here: $479,356 State: $444,476 In 3-to-4-unit structures: $790,169
Here: $790,169 State: $457,463 In 5-or-more-unit structures: $351,766
Here: $351,766 State: $368,745
Total population: 41,651 (Urban population: 39,394, Rural population: 0)
Houses: 16,206 (15,362 occupied: 9,253 owner occupied, 6,161 renter occupied)
| % of renters here: | 40% |
| State: | 35% |
Housing density: 1,500 houses/condos per square mile
Median price asked for vacant for-sale houses and condos in 2022: $203,940.
Median contract rent in 2022: $1,459 (lower quartile is $1,159, upper quartile is $1,793)
Median rent asked for vacant for-rent units in 2022: $1,593
Median gross rent in Linden, NJ in 2022: $1,643
Housing units in Linden with a mortgage: 6,256 (412 second mortgage, 0 home equity loan, 359 both second mortgage and home equity loan)
Houses without a mortgage: 309
Median household income for houses/condos with a mortgage: $120,794
Median household income for apartments without a mortgage: $89,173
Median monthly housing costs: $1,816
Compare current foreclosures in Linden, NJ:
| Photo | Address | Area | Beds / Baths | Price | Details |
|---|---|---|---|---|---|

|
#1
Mccandless Pl
Linden, NJ 07036
|
1,058 sq. feet
|
2 baths 3 beds |
show details | |

|
#2
Seymour Ave
Linden, NJ 07036
|
768 sq. feet
|
1 baths 3 beds |
show details | |

|
#3
Donaldson Pl
Linden, NJ 07036
|
768 sq. feet
|
3 baths 3 beds |
show details | |

|
#4
S Stiles St
Linden, NJ 07036
|
804 sq. feet
|
- baths - beds |
show details | |

|
#5
Orchard Ter
Linden, NJ 07036
|
1,700 sq. feet
|
- baths - beds |
show details | |

|
#6
Morristown Rd
Linden, NJ 07036
|
1,188 sq. feet
|
- baths - beds |
show details | |

|
#7
E Henry St
Linden, NJ 07036
|
768 sq. feet
|
- baths - beds |
show details | |

|
#8
W Munsell Ave
Linden, NJ 07036
|
1,056 sq. feet
|
- baths - beds |
show details | |

|
#9
3rd Ave
Linden, NJ 07036
|
1,498 sq. feet
|
- baths - beds |
show details | |

|
#10
Jackson Ave
Linden, NJ 07036
|
1,768 sq. feet
|
- baths - beds |
show details |
| Photo | Address | Area | Beds / Baths | Price | Details |
|---|---|---|---|---|---|

|
#11
E Henry St
Linden, NJ 07036
|
2,700 sq. feet
|
- baths - beds |
show details | |

|
#12
University Cir
Linden, NJ 07036
|
- sq. feet
|
- baths - beds |
show details | |

|
#13
Clinton St
Linden, NJ 07036
|
- sq. feet
|
- baths - beds |
show details | |

|
#14
Essex Ave
Linden, NJ 07036
|
- sq. feet
|
- baths - beds |
show details | |

|
#15
Walnut St
Linden, NJ 07036
|
928 sq. feet
|
- baths - beds |
show details | |

|
#16
Carnegie St
Linden, NJ 07036
|
1,468 sq. feet
|
- baths - beds |
show details | |

|
#17
E Blancke St
Linden, NJ 07036
|
- sq. feet
|
- baths - beds |
show details | |

|
#18
Fay Ave
Linden, NJ 07036
|
1,116 sq. feet
|
- baths - beds |
show details | |

|
#19
Carnegie St
Linden, NJ 07036
|
1,260 sq. feet
|
- baths - beds |
show details | |

|
#20
Bergen Ave
Linden, NJ 07036
|
- sq. feet
|
- baths - beds |
show details |
| Photo | Address | Area | Beds / Baths | Price | Details |
|---|---|---|---|---|---|

|
#21
Meacham Ave
Linden, NJ 07036
|
1,064 sq. feet
|
- baths - beds |
show details | |

|
#22
W Blancke St
Linden, NJ 07036
|
- sq. feet
|
- baths - beds |
show details | |

|
#23
Edgewood Rd
Linden, NJ 07036
|
1,188 sq. feet
|
- baths - beds |
show details | |

|
#24
Lenape Rd
Linden, NJ 07036
|
1,560 sq. feet
|
- baths - beds |
show details | |

|
#25
W Curtis St
Linden, NJ 07036
|
1,210 sq. feet
|
- baths - beds |
show details | |

|
#26
Hagel Ave
Linden, NJ 07036
|
1,690 sq. feet
|
- baths - beds |
show details | |

|
#27
E 19th St
Linden, NJ 07036
|
1,376 sq. feet
|
- baths - beds |
show details | |

|
#28
Cranford Ave
Linden, NJ 07036
|
- sq. feet
|
- baths - beds |
show details | |

|
#29
Grier Ave
Linden, NJ 07036
|
- sq. feet
|
- baths - beds |
show details | |

|
#30
E Elizabeth Ave # 1
Linden, NJ 07036
|
- sq. feet
|
- baths - beds |
show details |
| Photo | Address | Area | Beds / Baths | Price | Details |
|---|---|---|---|---|---|

|
#31
Melrose Ter
Linden, NJ 07036
|
1,375 sq. feet
|
- baths - beds |
show details | |

|
#32
Franklin Dr
Linden, NJ 07036
|
1,648 sq. feet
|
- baths - beds |
show details | |

|
#33
E Elizabeth Ave # E11
Linden, NJ 07036
|
61,080 sq. feet
|
- baths - beds |
show details | |

|
#34
Dennis Pl
Linden, NJ 07036
|
- sq. feet
|
- baths - beds |
show details | |

|
#35
Georgian Dr
Linden, NJ 07036
|
2,449 sq. feet
|
- baths - beds |
show details | |

|
#36
Marion Ave
Linden, NJ 07036
|
3,997 sq. feet
|
- baths - beds |
show details | |

|
#37
E Elizabeth Ave
Linden, NJ 07036
|
4,630 sq. feet
|
- baths - beds |
show details | |

|
#38
Bradford Ave
Linden, NJ 07036
|
1,354 sq. feet
|
- baths - beds |
show details | |

|
#39
Buchanan St
Linden, NJ 07036
|
2,422 sq. feet
|
- baths - beds |
show details | |

|
#40
Woodlawn Ave
Linden, NJ 07036
|
2,400 sq. feet
|
- baths - beds |
show details |
| Photo | Address | Area | Beds / Baths | Price | Details |
|---|---|---|---|---|---|

|
#41
Dewitt St
Linden, NJ 07036
|
1,766 sq. feet
|
- baths - beds |
show details | |

|
#42
Middlesex St
Linden, NJ 07036
|
1,236 sq. feet
|
- baths - beds |
show details | |

|
#43
Elmwood Ter
Linden, NJ 07036
|
1,824 sq. feet
|
- baths - beds |
show details | |

|
#44
W 10th St
Linden, NJ 07036
|
5,460 sq. feet
|
- baths - beds |
show details | |

|
#45
Grasselli Ave
Linden, NJ 07036
|
- sq. feet
|
- baths - beds |
show details | |

|
#46
Dill Ave Apt 214
Linden, NJ 07036
|
- sq. feet
|
- baths - beds |
show details | |

|
#47
W 11th St
Linden, NJ 07036
|
- sq. feet
|
- baths - beds |
show details | |

|
#48
Purdue Pl Apt C
Linden, NJ 07036
|
- sq. feet
|
- baths - beds |
show details | |

|
#49
Monmouth Ave
Linden, NJ 07036
|
1,128 sq. feet
|
- baths - beds |
show details | |

|
Check over 1 million property listings on Foreclosure.com!
|
browse all offers | |||

Latest news about housing in Linden, NJ collected exclusively by city-data.com from local newspapers, TV, and radio stations


Median year apartment built: 1974
Household type by relationship:
Households: 43,305- Male householders: 7,792 (1,796 living alone), Female householders: 7,366 (1,866 living alone)
6,786 spouses (6,632 opposite-sex spouses), 869 unmarried partners, (834 opposite-sex unmarried partners), 14,196 children (13,681 natural, 49 adopted, 465 stepchildren), 994 grandchildren, 857 brothers or sisters, 1,300 parents, 0 foster children, 1,333 other relatives, 1,559 non-relatives
- In group quarters: 249
Size of family households: 3,156 2-persons, 2,599 3-persons, 2,773 4-persons, 1,439 5-persons, 519 6-persons, 389 7-or-more-persons.
Size of nonfamily households: 3,557 1-person, 986 2-persons, 43 3-persons, 13 5-persons.
4,616 married couples with children.
3,313 single-parent households (1,007 men, 2,306 women).
44.3% of residents of Linden speak English at home.
28.3% of residents speak Spanish at home (62% speak English very well, 21% speak English well, 11% speak English not well, 7% don't speak English at all).
22.7% of residents speak other Indo-European language at home (58% speak English very well, 22% speak English well, 16% speak English not well, 5% don't speak English at all).
1.7% of residents speak Asian or Pacific Island language at home (69% speak English very well, 24% speak English well, 7% speak English not well).
1.7% of residents speak other language at home (66% speak English very well, 8% speak English well, 20% speak English not well, 6% don't speak English at all).
Foreign born population: 15,745 (36.4%)
(59.9% of them are naturalized citizens)
| Here: | 6.4 |
| State: | 6.8 |
| Here: | 4.4 |
| State: | 3.9 |

- Bedrooms in owner-occupied houses and condos in Linden, New Jersey
- 29no bedroom
- 3021 bedroom
- 1,1812 bedrooms
- 4,6053 bedrooms
- 2,5714 bedrooms
- 5665+ bedrooms

- Bedrooms in renter-occupied apartments in Linden, New Jersey
- 399no bedroom
- 1,4361 bedroom
- 2,2212 bedrooms
- 1,8133 bedrooms
- 2644 bedrooms
- 275+ bedrooms

- Cars and other vehicles available in Linden in owner-occupied houses/condos
- 446no vehicle
- 2,7111 vehicle
- 3,4072 vehicles
- 1,7593 vehicles
- 6724 vehicles
- 2595+ vehicles

- Cars and other vehicles available in Linden in renter-occupied apartments
- 1,083no vehicle
- 2,6711 vehicle
- 2,0252 vehicles
- 3183 vehicles
- 294 vehicles
- 355+ vehicles

- Rooms in owner-occupied houses in Linden, New Jersey
- 201 room
- 322 rooms
- 2853 rooms
- 6574 rooms
- 1,9785 rooms
- 2,0556 rooms
- 1,7937 rooms
- 1,2458 rooms
- 1,1889+ rooms

- Rooms in renter-occupied apartments in Linden, New Jersey
- 3991 room
- 3042 rooms
- 9723 rooms
- 1,7304 rooms
- 1,4275 rooms
- 1,0716 rooms
- 1847 rooms
- 38 rooms
- 719+ rooms


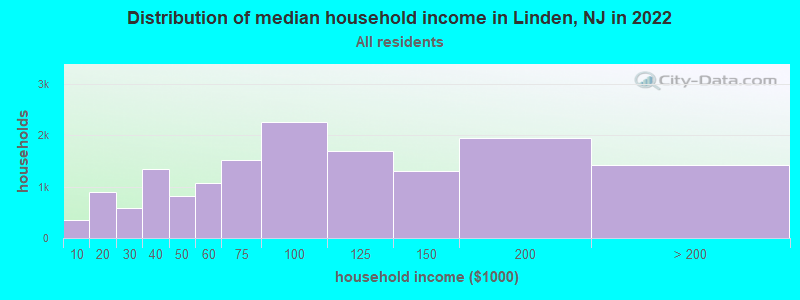
Linden, NJ household income distribution

- 353Less than $10,000
- 887$10,000 to $19,999
- 585$20,000 to $29,999
- 1,337$30,000 to $39,999
- 810$40,000 to $49,999
- 1,073$50,000 to $59,999
- 1,512$60,000 to $74,999
- 2,254$75,000 to $99,999
- 1,692$100,000 to $124,999
- 1,297$125,000 to $149,999
- 1,938$150,000 to $199,999
- 1,409$200,000 or more
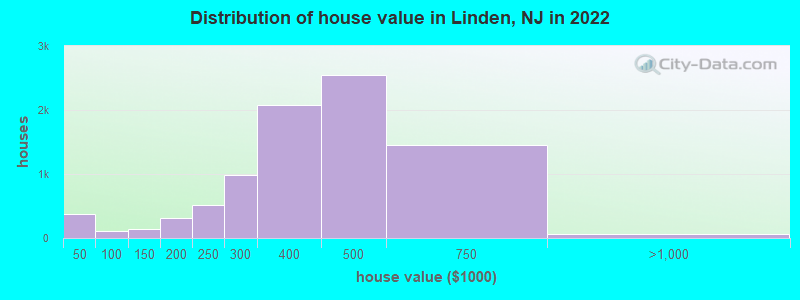
Home value of owner - occupied houses in 2022 in Linden, NJ
-
- 262Less than $10,000
- 4$20,000 to $24,999
- 20$25,000 to $29,999
- 30$30,000 to $34,999
- 10$35,000 to $39,999
- 49$40,000 to $49,999
- 11$50,000 to $59,999
- 16$60,000 to $69,999
- 8$70,000 to $79,999
- 3$80,000 to $89,999
- 16$90,000 to $99,999
- 62$100,000 to $124,999
- 76$125,000 to $149,999
- 191$150,000 to $174,999
- 113$175,000 to $199,999
- 516$200,000 to $249,999
- 986$250,000 to $299,999
- 2,081$300,000 to $399,999
- 2,539$400,000 to $499,999
- 1,449$500,000 to $749,999
- 30$750,000 to $999,999
- 27$1,000,000 to $1,499,999
- 12$2,000,000 or more
Rent paid by renters in 2022 in Linden, NJ
-
- 8Less than $100
- 58$150 to $199
- 72$200 to $249
- 78$250 to $299
- 21$300 to $349
- 33$450 to $499
- 23$500 to $549
- 11$550 to $599
- 18$600 to $649
- 9$700 to $749
- 31$750 to $799
- 185$800 to $899
- 249$900 to $999
- 924$1,000 to $1,249
- 1,591$1,250 to $1,499
- 2,146$1,500 to $1,999
- 394$2,000 to $2,499
- 79$2,500 to $2,999
- 146No cash rent


Percentage of workers working in this county: 48.0%
Number of people working at home: 1,307 (5.9% of all workers)
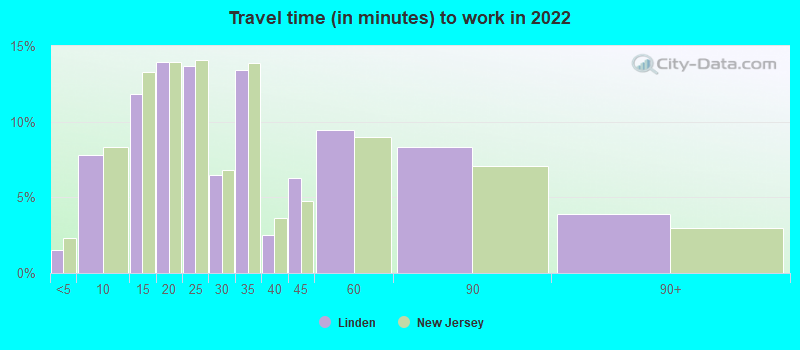
Travel time to work (commute)
- Less than 5 minutes: 251
- 5 to 9 minutes: 1,581
- 10 to 14 minutes: 2,301
- 15 to 19 minutes: 2,823
- 20 to 24 minutes: 2,244
- 25 to 29 minutes: 1,424
- 30 to 34 minutes: 3,117
- 35 to 39 minutes: 564
- 40 to 44 minutes: 1,150
- 45 to 59 minutes: 2,079
- 60 to 89 minutes: 1,756
- 90 or more minutes: 1,007
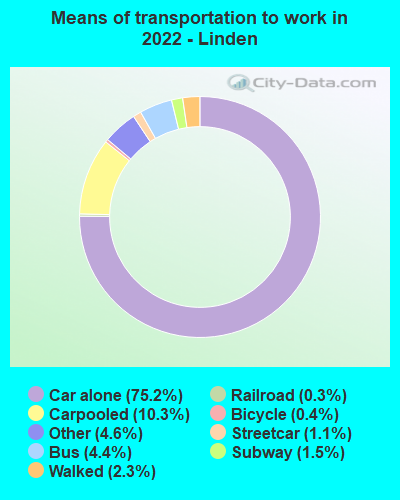
Means of transportation to work:
- Drove a car alone: 13,340 (66.8%)
- Carpooled: 2,203 (11.0%)
- Bus: 882 (4.4%)
- Subway or elevated rail: 180 (0.9%)
- Long-distance train or commuter rail: 339 (1.7%)
- Light rail, streetcar or trolley: 51 (0.3%)
- Taxi: 728 (3.6%)
- Bicycle: 118 (0.6%)
- Walked: 463 (2.3%)
- Worked at home: 1,307 (6.5%)

- Unemployment by race in 2022
- Unemployment rate for White non-Hispanic residents
- 5.3%Males
- 6.0%Females
- Unemployment rate for Black residents
- 8.9%Males
- 7.8%Females
- Unemployment rate for American Indian and Alaska Native residents
- 1.5%Males
- Unemployment rate for other race residents
- 7.8%Males
- 5.7%Females
- Unemployment rate for two or more race residents
- 4.2%Males
- 13.6%Females
- Unemployment rate for Hispanic or Latino residents
- 6.5%Males
- 10.2%Females

- Year of entry for the foreign-born population in Linden, New Jersey
- 3,9432010 or later
- 3,4602000 to 2009
- 3,8031990 to 1999
- 2,6151980 to 1989
- 1,7551970 to 1979
- 1,769Before 1970
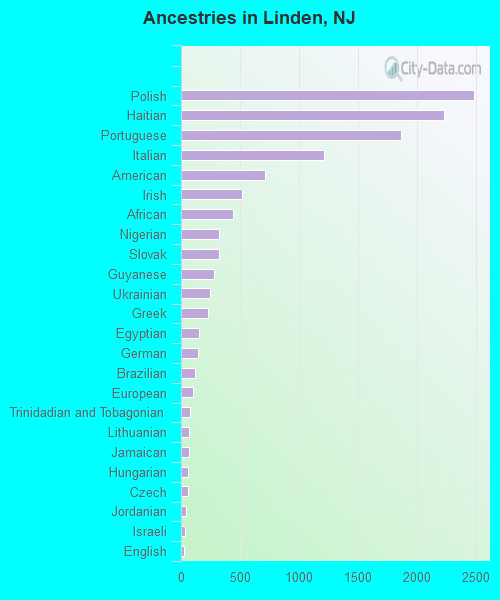
First ancestries reported:
- Polish: 2,487 (9.3%)
- Haitian: 2,230 (8.3%)
- Portuguese: 1,863 (7.0%)
- Italian: 1,212 (4.5%)
- American: 708 (2.6%)
- Irish: 513 (1.9%)
- African: 443 (1.7%)
- Nigerian: 326 (1.2%)
- Slovak: 323 (1.2%)
- Guyanese: 281 (1.1%)
- Ukrainian: 248 (0.9%)
- Greek: 229 (0.9%)
- Egyptian: 155 (0.6%)
- German: 147 (0.6%)
- Brazilian: 122 (0.5%)
- European: 101 (0.4%)
- Trinidadian and Tobagonian: 80 (0.3%)
- Lithuanian: 69 (0.3%)
- Jamaican: 68 (0.3%)
- Hungarian: 63 (0.2%)
- Czech: 60 (0.2%)
- Jordanian: 40 (0.1%)
- Israeli: 31 (0.1%)
- English: 28 (0.1%)
- Slavic: 22 (0.08%)
- French: 21 (0.08%)
- Dutch: 20 (0.07%)
- Croatian: 18 (0.07%)
- Yugoslavian: 15 (0.06%)
- Ghanaian: 14 (0.05%)
- Serbian: 13 (0.05%)
- Albanian: 9 (0.03%)
- Romanian: 8 (0.03%)
- Scotch-Irish: 8 (0.03%)
- Czechoslovakian: 7 (0.03%)
- Eastern European: 6 (0.02%)
- Liberian: 6 (0.02%)
- Austrian: 5 (0.02%)
- Bulgarian: 3 (0.01%)
- Scottish: 3 (0.01%)
Most common places of birth for foreign-born residents (%):
| Linden: | 13.7% (2,095) |
| New Jersey: | 2.3% (49,491) |
| Linden: | 12.1% (1,849) |
| New Jersey: | 4.2% (90,817) |
| Linden: | 10.6% (1,626) |
| New Jersey: | 2.3% (48,811) |
| Linden: | 8.3% (1,263) |
| New Jersey: | 1.3% (28,871) |
| Linden: | 6.9% (1,061) |
| New Jersey: | 4.4% (95,275) |
| Linden: | 5.1% (776) |
| New Jersey: | 9.7% (209,055) |
| Linden: | 3.8% (588) |
| New Jersey: | 2.3% (48,885) |
| Linden: | 3.6% (558) |
| New Jersey: | 4.8% (102,527) |
| Linden: | 3.4% (527) |
| New Jersey: | 2.7% (58,563) |
| Linden: | 3.0% (459) |
| New Jersey: | 0.2% (3,968) |
| Linden: | 2.5% (390) |
| New Jersey: | 1.2% (26,173) |
| Linden: | 2.0% (303) |
| New Jersey: | 0.7% (14,848) |
| Linden: | 1.7% (263) |
| New Jersey: | 4.0% (85,934) |
| Linden: | 1.6% (246) |
| New Jersey: | 12.8% (274,609) |
| Linden: | 1.6% (238) |
| New Jersey: | 1.2% (25,213) |
| Linden: | 1.5% (236) |
| New Jersey: | 0.5% (10,246) |
Place of birth for U.S.-born residents:
- This state: 19,208
- Other state: 7,517
- Northeast: 5,637
- Midwest: 228
- South: 1,672
- West: 103
86.3% of Linden residents lived in the same house 1 years ago.
Out of people who lived in different houses, 30.4% lived in this county.
Out of people who lived in different counties, 54.9% lived in New Jersey.
| Linden: | 86.3% |
| State average: | 90.4% |
Education attainment for males 25 years and older:
- No schooling: 733
- Nursery to 4th grade: 307
- 5th and 6th grade: 158
- 7th and 8th grade: 201
- 9th grade: 123
- 10th grade: 231
- 11th grade: 342
- 12th grade, no diploma: 533
- High school graduate (or equivalency): 4,869
- Less than 1 year of college: 1,115
- Some college more than 1 year, no degree: 1,991
- Associate degree: 1,118
- Bachelor's degree: 2,051
- Master's degree: 953
- Professional school degree: 64
- Doctorate degree: 19

Education attainment for females 25 years and older:
- No schooling: 579
- Nursery to 4th grade: 191
- 5th and 6th grade: 260
- 7th and 8th grade: 172
- 9th grade: 168
- 10th grade: 203
- 11th grade: 287
- 12th grade, no diploma: 520
- High school graduate (or equivalency): 4,792
- Less than 1 year of college: 886
- Some college more than 1 year, no degree: 1,789
- Associate degree: 1,589
- Bachelor's degree: 2,415
- Master's degree: 1,237
- Professional school degree: 174
- Doctorate degree: 70


Housing units in structures:
- One, detached: 7,635
- One, attached: 515
- Two: 4,410
- 3 or 4: 1,227
- 5 to 9: 435
- 10 to 19: 361
- 20 to 49: 636
- 50 or more: 929
- Mobile homes: 54
Housing units lacking complete kitchen facilities in 2022: 1.6%
House/condo owner moved in on average 13 years ago
Renter moved in on average 6 years ago

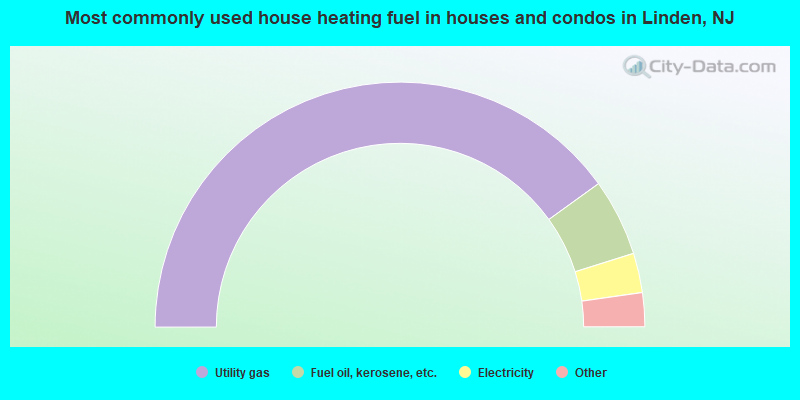
- 80.1%Utility gas
- 10.2%Fuel oil, kerosene, etc.
- 5.2%Electricity
- 3.6%Bottled, tank, or LP gas
- 0.4%Other fuel
- 0.4%Solar energy
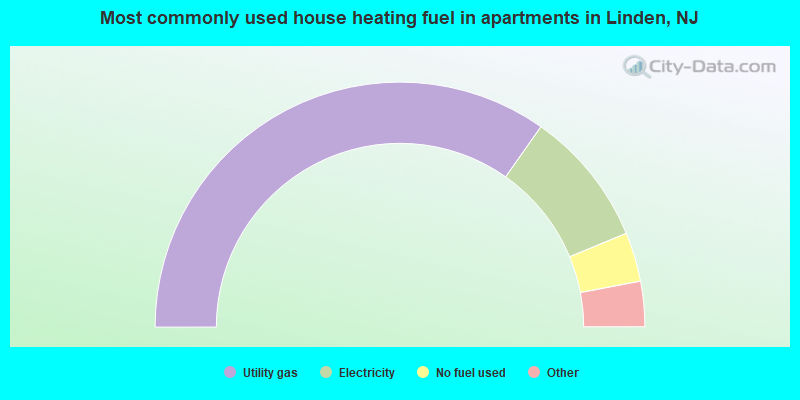
- 69.6%Utility gas
- 18.0%Electricity
- 6.5%No fuel used
- 2.7%Bottled, tank, or LP gas
- 1.8%Fuel oil, kerosene, etc.
- 1.3%Other fuel
- 0.2%Solar energy
Private vs. public school enrollment:
| Here: | 12.5% |
| New Jersey: | 12.3% |
| Here: | 13.6% |
| New Jersey: | 13.1% |
| Here: | 29.8% |
| New Jersey: | 33.2% |


