Lexington Park, MD (Maryland) Houses and Residents
| Lexington Park: | $294,720 |
| Maryland: | $398,100 |
Mean price in 2022:
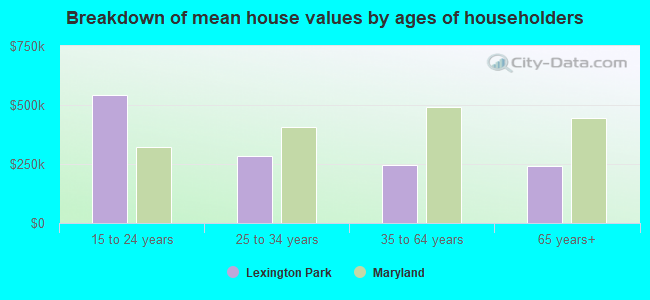
Detached houses: $273,601
Here: $273,601 State: $526,819 Townhouses or other attached units: $234,720
Here: $234,720 State: $328,305 Mobile homes: $56,882
Here: $56,882 State: $89,353
Total population: 11,626 (Urban population: 10,845 (all inside urban clusters), Rural population: 0)
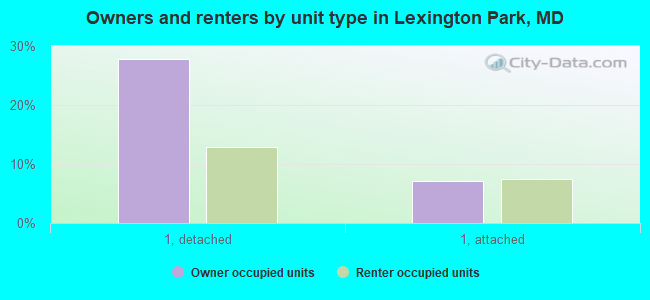
Houses: 6,355 (5,834 occupied: 2,788 owner occupied, 3,385 renter occupied)
| % of renters here: | 55% |
| State: | 32% |
Housing density: 795 houses/condos per square mile
Median price asked for vacant for-sale houses and condos in 2022 in this county: $475,864.
Median contract rent in 2022: $1,423 (lower quartile is $1,237, upper quartile is $1,711)
Median rent asked for vacant for-rent units in 2022: $1,117
Median gross rent in Lexington Park, MD in 2022: $1,577
Housing units in Lexington Park with a mortgage: 2,073 (126 second mortgage, 0 home equity loan, 63 both second mortgage and home equity loan)
Houses without a mortgage: 0
Median household income for houses/condos with a mortgage: $124,318
Median household income for apartments without a mortgage: $103,052
Median monthly housing costs: $1,602
Compare current foreclosures in Lexington Park, MD:
| Photo | Address | Area | Beds / Baths | Price | Details |
|---|---|---|---|---|---|

|
#1
Brookstone Ct
Lexington Park, MD 20653
|
2,506 sq. feet
|
2 baths 4 beds |
show details | |

|
#2
Lincoln Ave
Lexington Park, MD 20653
|
1,232 sq. feet
|
2 baths 3 beds |
show details | |

|
#3
Rosewood Dr
Lexington Park, MD 20653
|
1,457 sq. feet
|
2 baths - beds |
show details | |

|
#4
Gooseneck Dr
Lexington Park, MD 20653
|
2,528 sq. feet
|
4 baths - beds |
show details | |

|
#5
Altman Ct
Lexington Park, MD 20653
|
1,972 sq. feet
|
3 baths - beds |
show details | |

|
#6
Midway Dr
Lexington Park, MD 20653
|
1,420 sq. feet
|
2 baths - beds |
show details | |

|
#7
Calla Ln
Lexington Park, MD 20653
|
1,148 sq. feet
|
1 baths - beds |
show details | |

|
#8
Chestnut St
Lexington Park, MD 20653
|
2,056 sq. feet
|
2 baths - beds |
show details | |

|
#9
Lynn Dr
Lexington Park, MD 20653
|
1,805 sq. feet
|
2 baths - beds |
show details | |

|
#10
Lynn Dr
Lexington Park, MD 20653
|
1,375 sq. feet
|
2 baths - beds |
show details |
| Photo | Address | Area | Beds / Baths | Price | Details |
|---|---|---|---|---|---|

|
#11
Munley Ln
Lexington Park, MD 20653
|
1,860 sq. feet
|
2 baths - beds |
show details | |

|
#12
Schwartzkopf Dr
Lexington Park, MD 20653
|
1,964 sq. feet
|
3 baths - beds |
show details | |

|
#13
Warwick Dr
Lexington Park, MD 20653
|
1,594 sq. feet
|
2 baths - beds |
show details | |

|
#14
Red Rose Ct
Lexington Park, MD 20653
|
2,984 sq. feet
|
3 baths - beds |
show details | |

|
#15
Skipjack Dr
Lexington Park, MD 20653
|
2,954 sq. feet
|
2 baths - beds |
show details | |

|
#16
Warwick Dr
Lexington Park, MD 20653
|
1,210 sq. feet
|
2 baths - beds |
show details | |

|
#17
Calvert View Rd
Lexington Park, MD 20653
|
3,645 sq. feet
|
3 baths - beds |
show details | |

|
#18
Midway Dr
Lexington Park, MD 20653
|
1,375 sq. feet
|
1 baths - beds |
show details | |

|
#19
Gelrud Ct
Lexington Park, MD 20653
|
2,996 sq. feet
|
3 baths - beds |
show details | |

|
#20
Anita Ct
Lexington Park, MD 20653
|
2,676 sq. feet
|
2 baths - beds |
show details |
| Photo | Address | Area | Beds / Baths | Price | Details |
|---|---|---|---|---|---|

|
#21
Kregel Ct
Lexington Park, MD 20653
|
1,984 sq. feet
|
2 baths - beds |
show details | |

|
#22
Seabiscuit Ct
Lexington Park, MD 20653
|
- sq. feet
|
- baths - beds |
show details | |

|
#23
Edgar Way
Lexington Park, MD 20653
|
- sq. feet
|
- baths - beds |
show details | |

|
#24
Leeward Cir Unit 105
Lexington Park, MD 20653
|
- sq. feet
|
- baths - beds |
show details | |

|
#25
Liberty St Unit 315
Lexington Park, MD 20653
|
- sq. feet
|
- baths - beds |
show details | |

|
#26
Kala Ln, Apt 303
Lexington Park, MD 20653
|
- sq. feet
|
- baths - beds |
show details | |

|
#27
Red Cedar Ln
Lexington Park, MD 20653
|
- sq. feet
|
- baths - beds |
show details | |

|
#28
Liberty St Unit 419
Lexington Park, MD 20653
|
- sq. feet
|
- baths - beds |
show details | |

|
#29
Daisy Ln
Lexington Park, MD 20653
|
- sq. feet
|
- baths - beds |
show details | |

|
#30
Westbury Blvd
Lexington Park, MD 20653
|
- sq. feet
|
- baths - beds |
show details |
| Photo | Address | Area | Beds / Baths | Price | Details |
|---|---|---|---|---|---|

|
#31
Rickys Pl
Lexington Park, MD 20653
|
- sq. feet
|
- baths - beds |
show details | |

|
#32
Mayfaire Ln Unit 202
Lexington Park, MD 20653
|
- sq. feet
|
- baths - beds |
show details | |

|
#33
Donaldson Dr
Lexington Park, MD 20653
|
- sq. feet
|
- baths - beds |
show details | |

|
Check over 1 million property listings on Foreclosure.com!
|
browse all offers | |||


 | Son is moving to Lexington Park, MD, advise on rentals, neighborhood crime, etc (2 replies) |
| Southern Maryland apartments (11 replies) |
| Lexington Park, Md (11 replies) |
| Apartment for retire for $1000 or less (8 replies) |
| New Bay Bridge Proposals (159 replies) |
| Pax River NAS job...where to live? (27 replies) |

Median year apartment built: 1993
Household type by relationship:
Households: 13,663- Male householders: 3,303 (1,437 living alone), Female householders: 2,481 (328 living alone)
1,944 spouses (1,944 opposite-sex spouses), 316 unmarried partners, (316 opposite-sex unmarried partners), 4,211 children (4,021 natural, 120 adopted, 70 stepchildren), 305 grandchildren, 104 brothers or sisters, 328 parents, 0 foster children, 87 other relatives, 519 non-relatives
- In group quarters: 57
Size of family households: 1,499 2-persons, 1,105 3-persons, 674 4-persons, 286 5-persons, 77 6-persons, 33 7-or-more-persons.
Size of nonfamily households: 1,985 1-person, 434 2-persons, 111 3-persons.
1,489 married couples with children.
1,118 single-parent households (121 men, 997 women).
90.4% of residents of Lexington Park speak English at home.
2.9% of residents speak Spanish at home (48% speak English very well, 33% speak English well, 19% speak English not well).
0.5% of residents speak other Indo-European language at home (100% speak English very well).
4.1% of residents speak Asian or Pacific Island language at home (39% speak English very well, 51% speak English well, 10% speak English not well).
0.3% of residents speak other language at home (100% speak English very well).
Foreign born population: 663 (4.9%)
(62.3% of them are naturalized citizens)
| Here: | 6.9 |
| State: | 7.3 |
| Here: | 4.4 |
| State: | 4.2 |
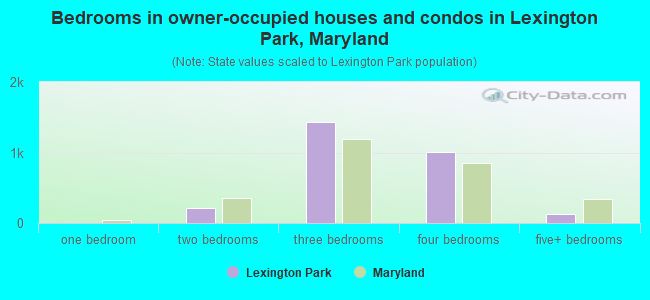
- Bedrooms in owner-occupied houses and condos in Lexington Park, Maryland
- 0no bedroom
- 01 bedroom
- 2192 bedrooms
- 1,4373 bedrooms
- 1,0134 bedrooms
- 1215+ bedrooms
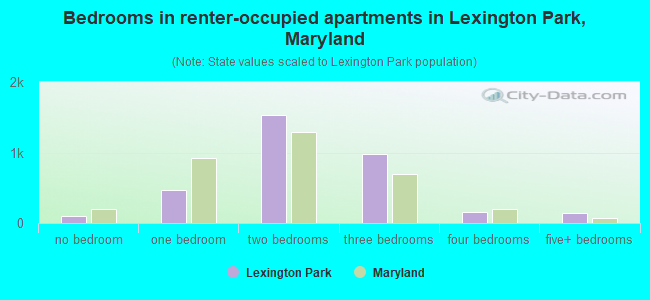
- Bedrooms in renter-occupied apartments in Lexington Park, Maryland
- 94no bedroom
- 4711 bedroom
- 1,5362 bedrooms
- 9853 bedrooms
- 1584 bedrooms
- 1425+ bedrooms
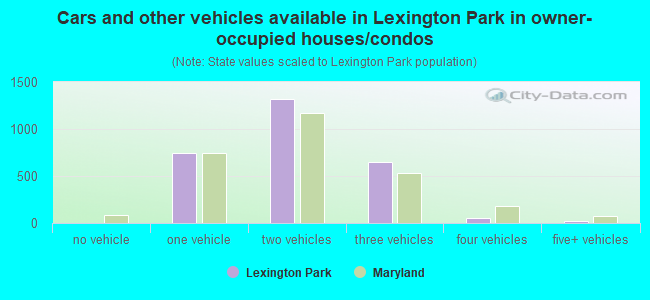
- Cars and other vehicles available in Lexington Park in owner-occupied houses/condos
- 5no vehicle
- 7431 vehicle
- 1,3222 vehicles
- 6453 vehicles
- 554 vehicles
- 185+ vehicles
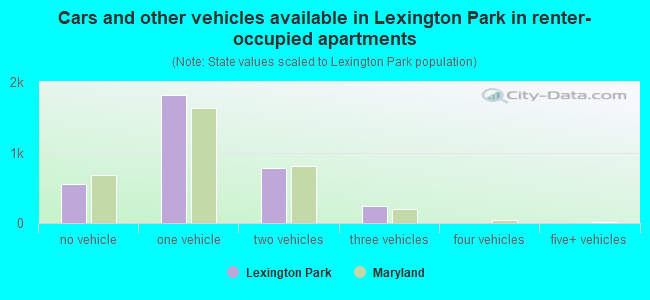
- Cars and other vehicles available in Lexington Park in renter-occupied apartments
- 548no vehicle
- 1,8151 vehicle
- 7812 vehicles
- 2413 vehicles
- 04 vehicles
- 05+ vehicles
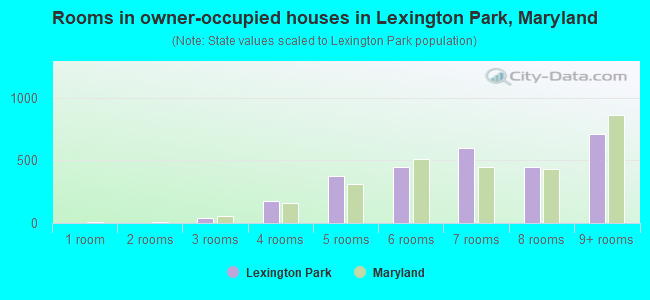
- Rooms in owner-occupied houses in Lexington Park, Maryland
- 01 room
- 02 rooms
- 383 rooms
- 1774 rooms
- 3745 rooms
- 4486 rooms
- 6007 rooms
- 4458 rooms
- 7089+ rooms
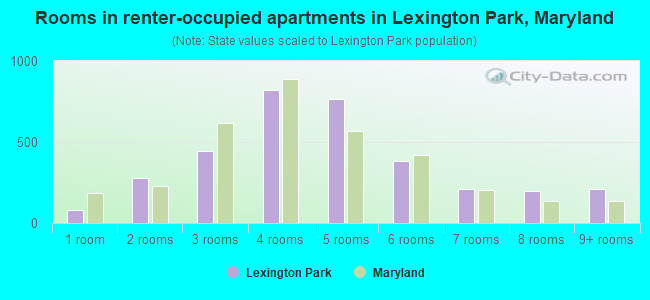
- Rooms in renter-occupied apartments in Lexington Park, Maryland
- 791 room
- 2792 rooms
- 4453 rooms
- 8214 rooms
- 7675 rooms
- 3816 rooms
- 2107 rooms
- 1978 rooms
- 2079+ rooms
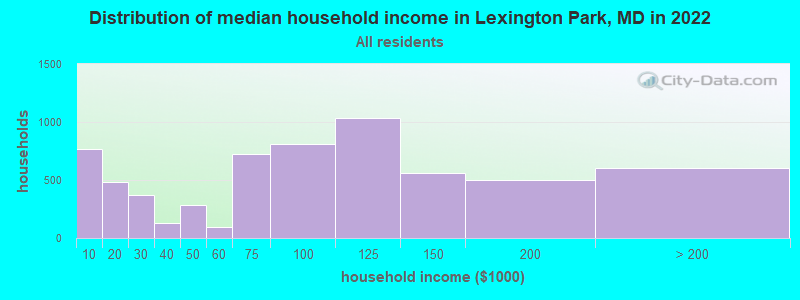
Lexington Park, MD household income distribution

- 769Less than $10,000
- 487$10,000 to $19,999
- 370$20,000 to $29,999
- 131$30,000 to $39,999
- 286$40,000 to $49,999
- 92$50,000 to $59,999
- 722$60,000 to $74,999
- 813$75,000 to $99,999
- 1,037$100,000 to $124,999
- 564$125,000 to $149,999
- 497$150,000 to $199,999
- 604$200,000 or more
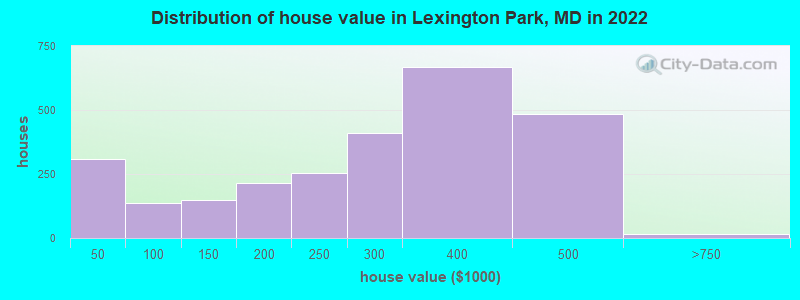
Home value of owner - occupied houses in 2022 in Lexington Park, MD
-
- 49Less than $10,000
- 50$10,000 to $14,999
- 70$20,000 to $24,999
- 15$30,000 to $34,999
- 123$40,000 to $49,999
- 13$80,000 to $89,999
- 26$100,000 to $124,999
- 122$125,000 to $149,999
- 113$150,000 to $174,999
- 102$175,000 to $199,999
- 253$200,000 to $249,999
- 408$250,000 to $299,999
- 666$300,000 to $399,999
- 484$400,000 to $499,999
- 13$500,000 to $749,999
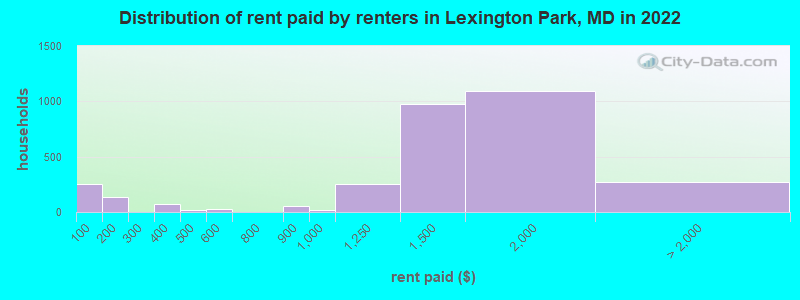
Rent paid by renters in 2022 in Lexington Park, MD
-
- 257Less than $100
- 134$150 to $199
- 40$300 to $349
- 27$350 to $399
- 21$400 to $449
- 27$550 to $599
- 50$800 to $899
- 16$900 to $999
- 248$1,000 to $1,249
- 971$1,250 to $1,499
- 1,095$1,500 to $1,999
- 204$2,000 to $2,499
- 11$3,000 to $3,499
- 56No cash rent
Percentage of workers working in this county: 93.0%
Number of people working at home: 1,226 (15.8% of all workers)
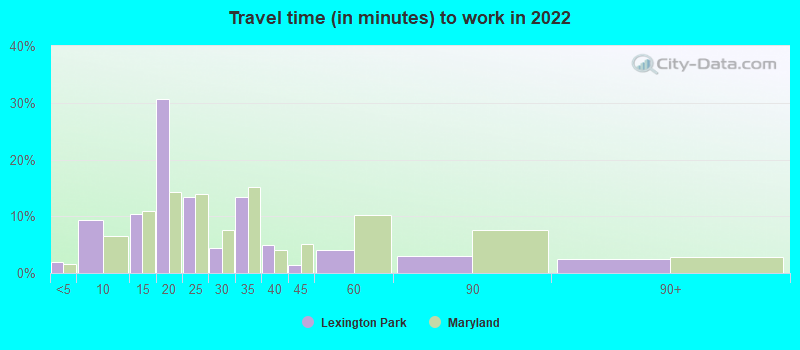
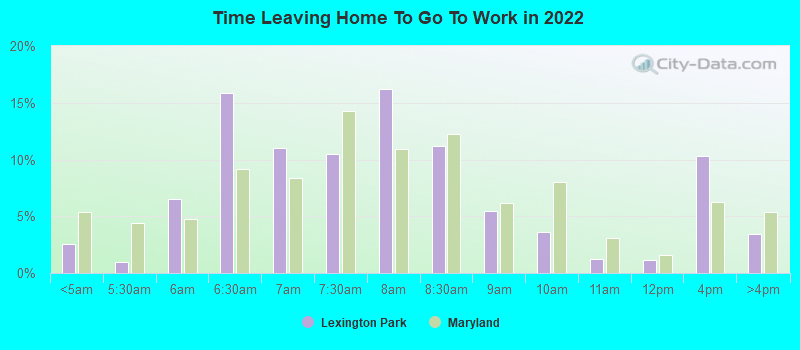
Travel time to work (commute)
- Less than 5 minutes: 18
- 5 to 9 minutes: 1,015
- 10 to 14 minutes: 1,175
- 15 to 19 minutes: 2,925
- 20 to 24 minutes: 956
- 25 to 29 minutes: 148
- 30 to 34 minutes: 169
- 35 to 39 minutes: 176
- 40 to 44 minutes: 154
- 45 to 59 minutes: 82
- 60 to 89 minutes: 97
- 90 or more minutes: 232
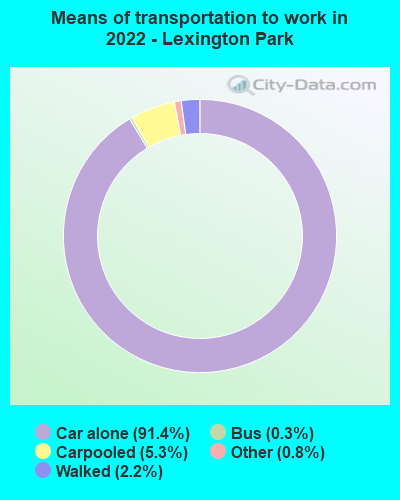
Means of transportation to work:
- Drove a car alone: 6,159 (76.2%)
- Carpooled: 376 (4.7%)
- Bus: 17 (0.2%)
- Taxi: 61 (0.8%)
- Walked: 145 (1.8%)
- Worked at home: 1,226 (15.2%)
- Unemployment by race in 2022
- Unemployment rate for White non-Hispanic residents
- 1.0%Males
- 2.5%Females
- Unemployment rate for Black residents
- 9.5%Males
- 1.7%Females
- Unemployment rate for two or more race residents
- 6.5%Males
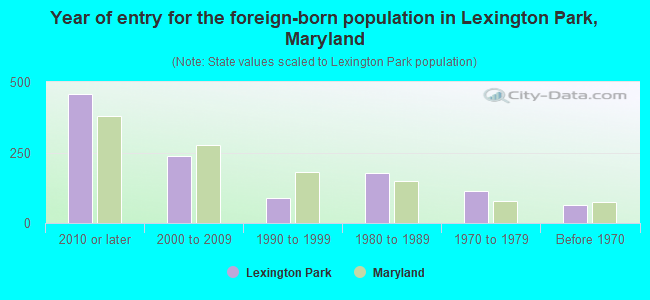
- Year of entry for the foreign-born population in Lexington Park, Maryland
- 4592010 or later
- 2362000 to 2009
- 881990 to 1999
- 1781980 to 1989
- 1131970 to 1979
- 65Before 1970
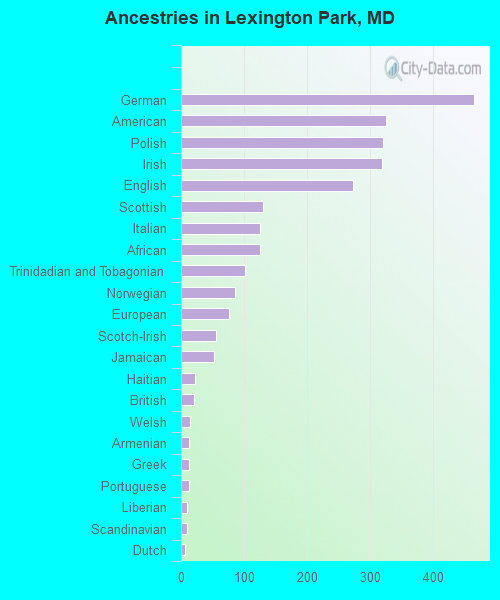
First ancestries reported:
- German: 466 (7.7%)
- American: 325 (5.4%)
- Polish: 321 (5.3%)
- Irish: 320 (5.3%)
- English: 274 (4.5%)
- Scottish: 130 (2.2%)
- Italian: 126 (2.1%)
- African: 126 (2.1%)
- Trinidadian and Tobagonian: 101 (1.7%)
- Norwegian: 85 (1.4%)
- European: 77 (1.3%)
- Scotch-Irish: 55 (0.9%)
- Jamaican: 53 (0.9%)
- Haitian: 23 (0.4%)
- British: 20 (0.3%)
- Welsh: 14 (0.2%)
- Armenian: 13 (0.2%)
- Greek: 13 (0.2%)
- Portuguese: 12 (0.2%)
- Liberian: 10 (0.2%)
- Scandinavian: 9 (0.1%)
- Dutch: 7 (0.1%)
Most common places of birth for foreign-born residents (%):
| Lexington Park: | 38.8% (416) |
| Maryland: | 3.8% (36,698) |
| Lexington Park: | 12.5% (134) |
| Maryland: | 12.0% (115,412) |
| Lexington Park: | 10.2% (109) |
| Maryland: | 3.5% (34,065) |
| Lexington Park: | 9.0% (97) |
| Maryland: | 1.2% (11,481) |
| Lexington Park: | 5.1% (55) |
| Maryland: | 1.9% (18,716) |
| Lexington Park: | 3.2% (34) |
| Maryland: | 1.8% (17,037) |
| Lexington Park: | 3.0% (32) |
| Maryland: | 0.5% (4,995) |
| Lexington Park: | 2.3% (25) |
| Maryland: | 1.1% (10,205) |
| Lexington Park: | 2.1% (23) |
| Maryland: | 0.4% (3,874) |
| Lexington Park: | 2.0% (21) |
| Maryland: | 1.3% (12,898) |
| Lexington Park: | 1.9% (20) |
| Maryland: | 1.2% (11,265) |
| Lexington Park: | 1.6% (17) |
| Maryland: | 0.7% (6,724) |
Place of birth for U.S.-born residents:
- This state: 5,983
- Other state: 6,593
- Northeast: 1,816
- Midwest: 928
- South: 2,857
- West: 940
85.0% of Lexington Park residents lived in the same house 1 years ago.
Out of people who lived in different houses, 26.7% lived in this county.
Out of people who lived in different counties, 52.2% lived in Maryland.
| Lexington Park: | 85.0% |
| State average: | 88.5% |
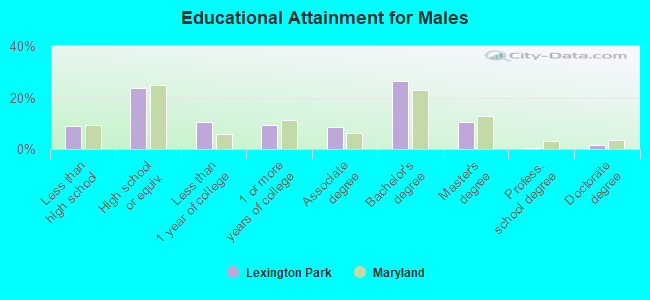
Education attainment for males 25 years and older:
- No schooling: 58
- Nursery to 4th grade: 1
- 5th and 6th grade: 0
- 7th and 8th grade: 71
- 9th grade: 37
- 10th grade: 0
- 11th grade: 184
- 12th grade, no diploma: 35
- High school graduate (or equivalency): 1,040
- Less than 1 year of college: 452
- Some college more than 1 year, no degree: 408
- Associate degree: 370
- Bachelor's degree: 1,161
- Master's degree: 457
- Professional school degree: 22
- Doctorate degree: 76
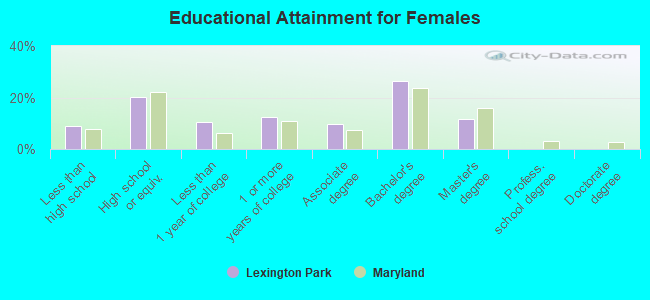
Education attainment for females 25 years and older:
- No schooling: 11
- Nursery to 4th grade: 0
- 5th and 6th grade: 49
- 7th and 8th grade: 38
- 9th grade: 17
- 10th grade: 37
- 11th grade: 221
- 12th grade, no diploma: 36
- High school graduate (or equivalency): 925
- Less than 1 year of college: 476
- Some college more than 1 year, no degree: 570
- Associate degree: 451
- Bachelor's degree: 1,212
- Master's degree: 536
- Professional school degree: 0
- Doctorate degree: 0


Housing units in structures:
- One, detached: 2,511
- One, attached: 931
- 3 or 4: 173
- 5 to 9: 680
- 10 to 19: 867
- 20 to 49: 687
- 50 or more: 232
- Mobile homes: 256
- Boats, RVs, vans, etc.: 16
Median worth of mobile homes: $43,137
Housing units lacking complete kitchen facilities in 2022: 0.5%
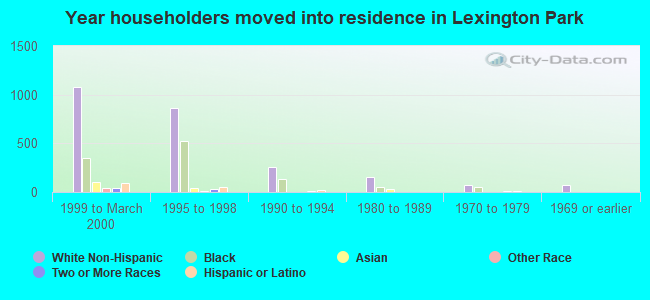
House/condo owner moved in on average 5 years ago
Renter moved in on average 5 years ago
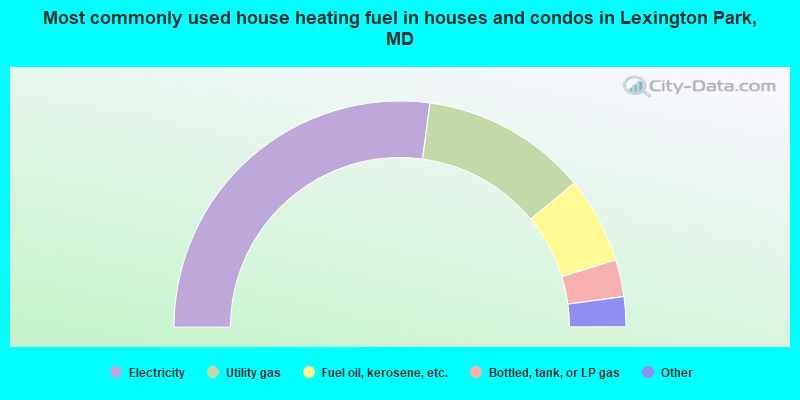
- 54.3%Electricity
- 23.8%Utility gas
- 12.4%Fuel oil, kerosene, etc.
- 5.3%Bottled, tank, or LP gas
- 1.9%No fuel used
- 1.2%Wood
- 0.6%Solar energy
- 0.6%Other fuel
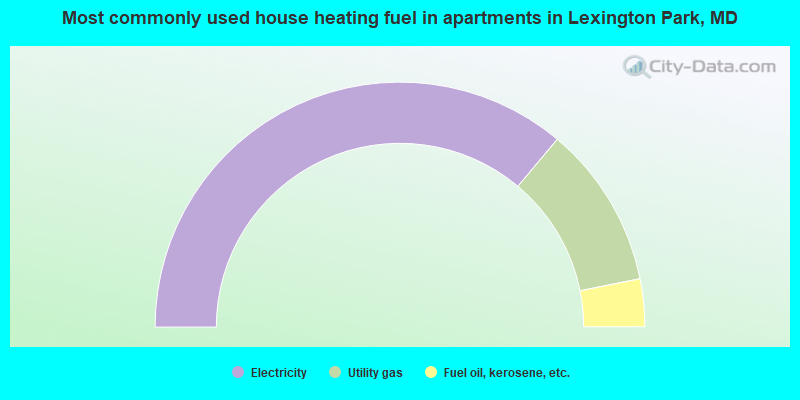
- 72.2%Electricity
- 21.5%Utility gas
- 6.3%Fuel oil, kerosene, etc.
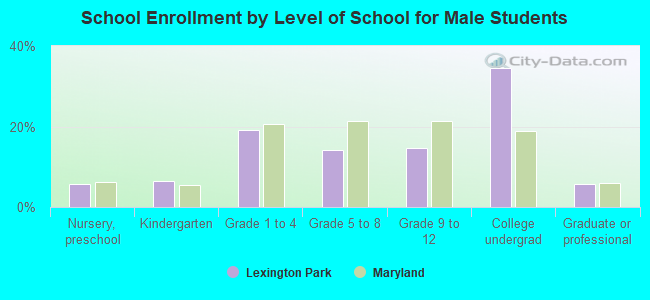
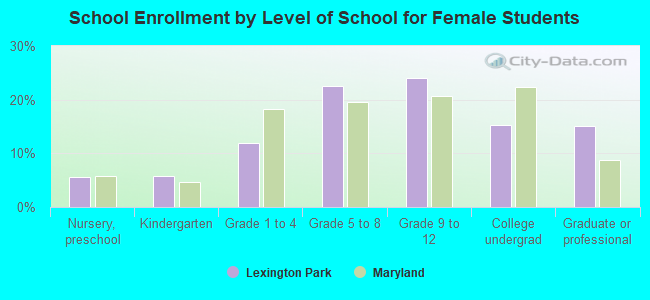
Private vs. public school enrollment:
| Here: | 13.5% |
| Maryland: | 15.2% |
| Here: | 10.3% |
| Maryland: | 14.4% |
| Here: | 13.4% |
| Maryland: | 20.2% |