Lebanon, NH (New Hampshire) Houses and Residents
| Lebanon: | $393,013 |
| New Hampshire: | $384,700 |
Mean price in 2022:
Detached houses: $478,291
Here: $478,291 State: $491,479 Townhouses or other attached units: $375,706
Here: $375,706 State: $361,001 In 2-unit structures: $409,592
Here: $409,592 State: $368,847 In 3-to-4-unit structures: $402,258
Here: $402,258 State: $575,942 In 5-or-more-unit structures: $402,412
Here: $402,412 State: $274,068 Mobile homes: $97,786
Here: $97,786 State: $124,817
Total population: 13,589 (Urban population: 10,904 (all inside urban clusters), Rural population: 1,664 (all nonfarm))
Houses: 7,345 (6,172 occupied: 3,441 owner occupied, 3,138 renter occupied)
| % of renters here: | 48% |
| State: | 28% |
Housing density: 182 houses/condos per square mile
Median price asked for vacant for-sale houses and condos in 2022: $345,008.
Median contract rent in 2022: $1,443 (lower quartile is $1,096, upper quartile is $1,908)
Median rent asked for vacant for-rent units in 2022: $2,591
Median gross rent in Lebanon, NH in 2022: $1,582
Housing units in Lebanon with a mortgage: 2,037 (198 second mortgage, 0 home equity loan, 188 both second mortgage and home equity loan)
Houses without a mortgage: 42
Median household income for houses/condos with a mortgage: $144,034
Median household income for apartments without a mortgage: $87,682
Median monthly housing costs: $1,705
Compare current foreclosures near Lebanon, NH:
| Photo | Address | Area | Beds / Baths | Price | Details |
|---|---|---|---|---|---|

|
#1
Bank Street Ext
Lebanon, NH 03766
|
1,232 sq. feet
|
1 baths 4 beds |
show details | |

|
#2
Renihan Mdws
Lebanon, NH 03766
|
- sq. feet
|
- baths - beds |
show details | |

|
#3
Church St
Lebanon, NH 03766
|
- sq. feet
|
- baths - beds |
show details | |

|
#4
Doe Hill Way
Woodstock, VT 05091
|
1,264 sq. feet
|
1 baths 1 beds |
$262,900
|
show details |

|
#5
Main St
Windsor, VT 05089
|
1,800 sq. feet
|
3 baths 7 beds |
show details | |

|
#6
Daniels Dr
Enfield, NH 03748
|
636 sq. feet
|
1 baths 2 beds |
show details | |

|
#7
Winter St W
West Lebanon, NH 03784
|
894 sq. feet
|
1 baths 2 beds |
show details | |

|
#8
Orchard Rd
Enfield, NH 03748
|
1,056 sq. feet
|
2 baths 2 beds |
show details | |

|
#9
S Main St Apt 2
White River Junction, VT 05001
|
- sq. feet
|
- baths - beds |
show details | |

|
#10
Gates St Apt 7
White River Junction, VT 05001
|
- sq. feet
|
- baths - beds |
show details |
| Photo | Address | Area | Beds / Baths | Price | Details |
|---|---|---|---|---|---|

|
#11
Bugbee St Apt 31
White River Junction, VT 05001
|
- sq. feet
|
- baths - beds |
show details | |

|
#12
Us Route 4, Unit 5
Enfield, NH 03748
|
- sq. feet
|
- baths - beds |
show details | |

|
#13
Dawn Dr
White River Junction, VT 05001
|
- sq. feet
|
- baths - beds |
show details | |

|
#14
Bavier Ave
Windsor, VT 05089
|
- sq. feet
|
- baths - beds |
show details | |

|
#15
Slab City Rd
Grafton, NH 03240
|
- sq. feet
|
- baths - beds |
show details | |

|
#16
Horseshoe Ave
Wilder, VT 05088
|
- sq. feet
|
- baths - beds |
show details | |

|
#17
Pine St
Windsor, VT 05089
|
- sq. feet
|
- baths - beds |
show details | |

|
#18
Cash St
Newport, NH 03773
|
- sq. feet
|
- baths - beds |
show details | |

|
#19
Downing Rd
Hanover, NH 03755
|
- sq. feet
|
- baths - beds |
show details | |

|
Check over 1 million property listings on Foreclosure.com!
|
browse all offers | |||

Latest news about housing in Lebanon, NH collected exclusively by city-data.com from local newspapers, TV, and radio stations


Median year apartment built: 1985
Household type by relationship:
Households: 14,561- Male householders: 2,825 (789 living alone), Female householders: 3,292 (1,274 living alone)
2,702 spouses (2,640 opposite-sex spouses), 519 unmarried partners, (494 opposite-sex unmarried partners), 3,600 children (3,348 natural, 179 adopted, 72 stepchildren), 342 grandchildren, 35 brothers or sisters, 122 parents, 0 foster children, 72 other relatives, 815 non-relatives
- In group quarters: 232
Size of family households: 2,094 2-persons, 805 3-persons, 410 4-persons, 290 5-persons, 109 7-or-more-persons.
Size of nonfamily households: 2,050 1-person, 645 2-persons, 97 3-persons, 37 4-persons.
1,359 married couples with children.
583 single-parent households (50 men, 533 women).
91.1% of residents of Lebanon speak English at home.
1.3% of residents speak Spanish at home (58% speak English very well, 19% speak English well, 22% speak English not well).
3.5% of residents speak other Indo-European language at home (90% speak English very well, 8% speak English well, 1% speak English not well).
4.7% of residents speak Asian or Pacific Island language at home (85% speak English very well, 11% speak English well, 4% speak English not well).
0.4% of residents speak other language at home (84% speak English very well, 16% speak English well).
Foreign born population: 1,446 (9.9%)
(56.3% of them are naturalized citizens)
| Here: | 6.7 |
| State: | 6.4 |
| Here: | 3.7 |
| State: | 4.0 |

- Bedrooms in owner-occupied houses and condos in Lebanon, New Hampshire
- 0no bedroom
- 171 bedroom
- 1,0812 bedrooms
- 1,4243 bedrooms
- 6114 bedrooms
- 3095+ bedrooms

- Bedrooms in renter-occupied apartments in Lebanon, New Hampshire
- 204no bedroom
- 1,0281 bedroom
- 1,6452 bedrooms
- 1913 bedrooms
- 544 bedrooms
- 165+ bedrooms

- Cars and other vehicles available in Lebanon in owner-occupied houses/condos
- 86no vehicle
- 8791 vehicle
- 1,9082 vehicles
- 4263 vehicles
- 684 vehicles
- 735+ vehicles

- Cars and other vehicles available in Lebanon in renter-occupied apartments
- 412no vehicle
- 1,7611 vehicle
- 7872 vehicles
- 1043 vehicles
- 654 vehicles
- 105+ vehicles

- Rooms in owner-occupied houses in Lebanon, New Hampshire
- 01 room
- 172 rooms
- 613 rooms
- 5304 rooms
- 6655 rooms
- 3996 rooms
- 6547 rooms
- 3698 rooms
- 7469+ rooms

- Rooms in renter-occupied apartments in Lebanon, New Hampshire
- 2041 room
- 2652 rooms
- 7853 rooms
- 1,0644 rooms
- 3575 rooms
- 3016 rooms
- 1047 rooms
- 08 rooms
- 589+ rooms


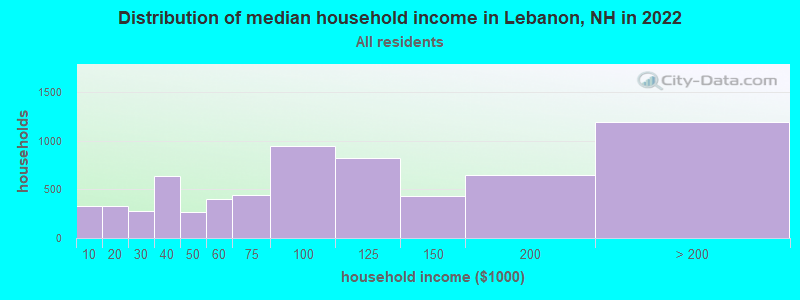
Lebanon, NH household income distribution

- 325Less than $10,000
- 329$10,000 to $19,999
- 280$20,000 to $29,999
- 632$30,000 to $39,999
- 269$40,000 to $49,999
- 396$50,000 to $59,999
- 438$60,000 to $74,999
- 943$75,000 to $99,999
- 827$100,000 to $124,999
- 428$125,000 to $149,999
- 648$150,000 to $199,999
- 1,192$200,000 or more
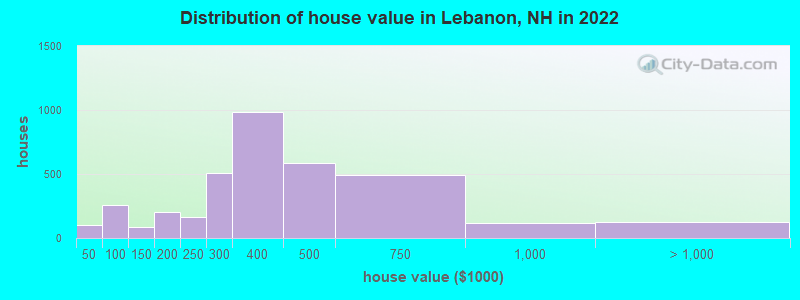
Home value of owner - occupied houses in 2022 in Lebanon, NH
-
- 66$20,000 to $24,999
- 22$25,000 to $29,999
- 9$40,000 to $49,999
- 87$50,000 to $59,999
- 49$60,000 to $69,999
- 6$70,000 to $79,999
- 102$90,000 to $99,999
- 74$100,000 to $124,999
- 13$125,000 to $149,999
- 107$150,000 to $174,999
- 93$175,000 to $199,999
- 163$200,000 to $249,999
- 503$250,000 to $299,999
- 980$300,000 to $399,999
- 584$400,000 to $499,999
- 491$500,000 to $749,999
- 118$750,000 to $999,999
- 28$1,000,000 to $1,499,999
- 57$1,500,000 to $1,999,999
- 41$2,000,000 or more
Rent paid by renters in 2022 in Lebanon, NH
-
- 53Less than $100
- 53$150 to $199
- 17$200 to $249
- 16$350 to $399
- 85$500 to $549
- 7$550 to $599
- 76$700 to $749
- 44$750 to $799
- 136$800 to $899
- 97$900 to $999
- 788$1,000 to $1,249
- 419$1,250 to $1,499
- 743$1,500 to $1,999
- 231$2,000 to $2,499
- 15$2,500 to $2,999
- 182$3,500 or more
- 53No cash rent


Percentage of workers working in this county: 91.8%
Number of people working at home: 2,072 (23.6% of all workers)
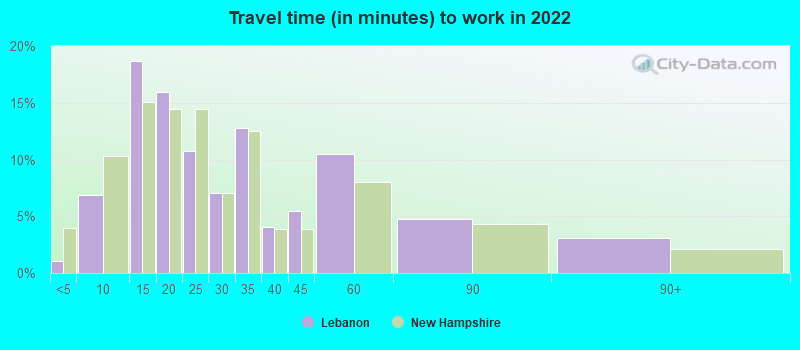
Travel time to work (commute)
- Less than 5 minutes: 110
- 5 to 9 minutes: 981
- 10 to 14 minutes: 2,614
- 15 to 19 minutes: 1,932
- 20 to 24 minutes: 501
- 25 to 29 minutes: 81
- 30 to 34 minutes: 470
- 35 to 39 minutes: 14
- 40 to 44 minutes: 32
- 45 to 59 minutes: 218
- 60 to 89 minutes: 33
- 90 or more minutes: 220
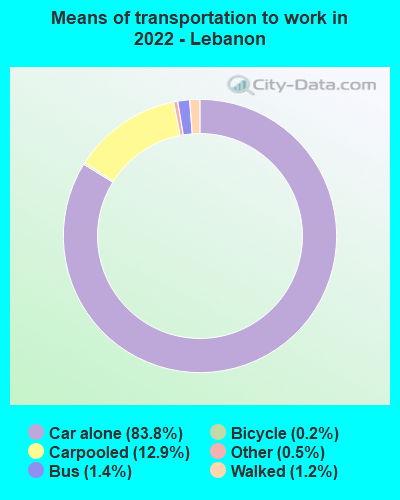
Means of transportation to work:
- Drove a car alone: 14,381 (72.1%)
- Carpooled: 2,645 (13.3%)
- Bus: 123 (0.6%)
- Taxi: 113 (0.6%)
- Bicycle: 31 (0.2%)
- Walked: 214 (1.1%)
- Worked at home: 2,072 (10.4%)

- Unemployment by race in 2022
- Unemployment rate for White non-Hispanic residents
- 0.4%Females
- Unemployment rate for Asian residents
- 5.5%Males
- Unemployment rate for two or more race residents
- 2.4%Females

- Year of entry for the foreign-born population in Lebanon, New Hampshire
- 4742010 or later
- 3452000 to 2009
- 2751990 to 1999
- 1171980 to 1989
- 1121970 to 1979
- 181Before 1970

First ancestries reported:
- English: 1,278 (20.9%)
- French: 474 (7.7%)
- Irish: 439 (7.2%)
- American: 332 (5.4%)
- Italian: 302 (4.9%)
- French Canadian: 300 (4.9%)
- German: 254 (4.1%)
- European: 153 (2.5%)
- Polish: 148 (2.4%)
- British: 125 (2.0%)
- Scottish: 86 (1.4%)
- Ugandan: 85 (1.4%)
- Dutch: 77 (1.3%)
- Austrian: 63 (1.0%)
- Northern European: 63 (1.0%)
- Russian: 63 (1.0%)
- Portuguese: 55 (0.9%)
- Iraqi: 41 (0.7%)
- Scotch-Irish: 41 (0.7%)
- Danish: 36 (0.6%)
- Swedish: 31 (0.5%)
- Welsh: 31 (0.5%)
- Eastern European: 29 (0.5%)
- Albanian: 19 (0.3%)
- Norwegian: 19 (0.3%)
- Iranian: 18 (0.3%)
- Hungarian: 16 (0.3%)
- Lithuanian: 16 (0.3%)
- New Zealander: 13 (0.2%)
- Brazilian: 11 (0.2%)
- Egyptian: 10 (0.2%)
- Haitian: 10 (0.2%)
- Canadian: 5 (0.08%)
Most common places of birth for foreign-born residents (%):
| Lebanon: | 13.9% (194) |
| New Hampshire: | 9.1% (7,609) |
| Lebanon: | 9.3% (130) |
| New Hampshire: | 4.5% (3,775) |
| Lebanon: | 8.6% (119) |
| New Hampshire: | 3.3% (2,768) |
| Lebanon: | 8.0% (111) |
| New Hampshire: | 1.7% (1,439) |
| Lebanon: | 6.6% (92) |
| New Hampshire: | 0.2% (181) |
| Lebanon: | 4.9% (68) |
| New Hampshire: | 0.2% (127) |
| Lebanon: | 4.3% (60) |
| New Hampshire: | 2.5% (2,112) |
| Lebanon: | 4.2% (58) |
| New Hampshire: | 0.4% (309) |
| Lebanon: | 4.1% (57) |
| New Hampshire: | 0.8% (694) |
| Lebanon: | 3.2% (44) |
| New Hampshire: | 3.6% (2,964) |
| Lebanon: | 2.7% (37) |
| New Hampshire: | 0.8% (686) |
| Lebanon: | 2.5% (35) |
| New Hampshire: | 0.5% (431) |
| Lebanon: | 2.4% (34) |
| New Hampshire: | 9.1% (7,618) |
| Lebanon: | 2.3% (32) |
| New Hampshire: | 1.9% (1,607) |
| Lebanon: | 2.2% (30) |
| New Hampshire: | 0.5% (424) |
| Lebanon: | 1.9% (26) |
| New Hampshire: | 0.9% (729) |
| Lebanon: | 1.7% (23) |
| New Hampshire: | 0.8% (705) |
| Lebanon: | 1.7% (23) |
| New Hampshire: | 2.7% (2,211) |
| Lebanon: | 1.7% (23) |
| New Hampshire: | 0.2% (207) |
| Lebanon: | 1.6% (22) |
| New Hampshire: | 2.0% (1,650) |
Place of birth for U.S.-born residents:
- This state: 5,668
- Other state: 7,250
- Northeast: 4,417
- Midwest: 1,274
- South: 908
- West: 589
82.3% of Lebanon residents lived in the same house 1 years ago.
Out of people who lived in different houses, 30.3% lived in this county.
Out of people who lived in different counties, 21.1% lived in New Hampshire.
| Lebanon: | 82.3% |
| State average: | 89.8% |
Education attainment for males 25 years and older:
- No schooling: 0
- Nursery to 4th grade: 0
- 5th and 6th grade: 20
- 7th and 8th grade: 21
- 9th grade: 18
- 10th grade: 110
- 11th grade: 31
- 12th grade, no diploma: 89
- High school graduate (or equivalency): 1,253
- Less than 1 year of college: 254
- Some college more than 1 year, no degree: 187
- Associate degree: 249
- Bachelor's degree: 1,687
- Master's degree: 967
- Professional school degree: 185
- Doctorate degree: 541

Education attainment for females 25 years and older:
- No schooling: 54
- Nursery to 4th grade: 0
- 5th and 6th grade: 0
- 7th and 8th grade: 0
- 9th grade: 59
- 10th grade: 75
- 11th grade: 52
- 12th grade, no diploma: 36
- High school graduate (or equivalency): 1,329
- Less than 1 year of college: 267
- Some college more than 1 year, no degree: 501
- Associate degree: 408
- Bachelor's degree: 1,444
- Master's degree: 992
- Professional school degree: 167
- Doctorate degree: 794


Housing units in structures:
- One, detached: 2,901
- One, attached: 527
- Two: 406
- 3 or 4: 562
- 5 to 9: 536
- 10 to 19: 555
- 20 to 49: 549
- 50 or more: 979
- Mobile homes: 325
Housing units lacking complete kitchen facilities in 2022: 0.5%
House/condo owner moved in on average 14 years ago
Renter moved in on average 2 years ago

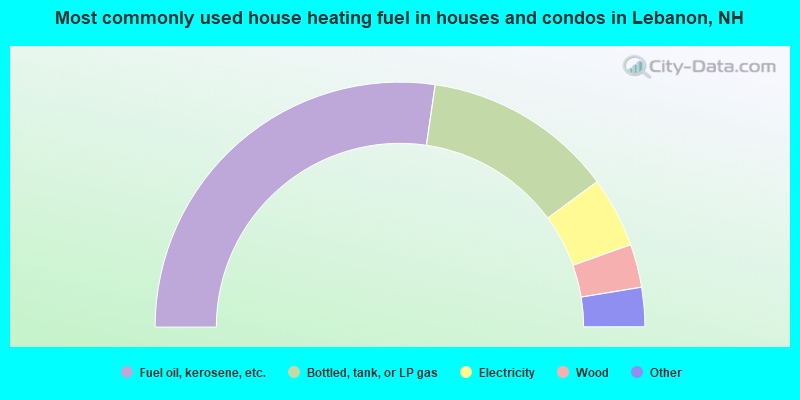
- 54.6%Fuel oil, kerosene, etc.
- 25.2%Bottled, tank, or LP gas
- 9.3%Electricity
- 5.7%Wood
- 3.2%Utility gas
- 2.0%Other fuel
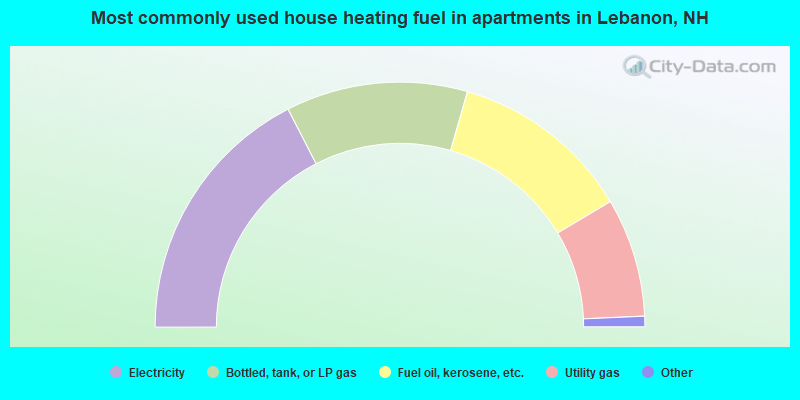
- 34.9%Electricity
- 24.0%Bottled, tank, or LP gas
- 24.0%Fuel oil, kerosene, etc.
- 15.7%Utility gas
- 0.9%Other fuel
- 0.3%No fuel used
- 0.2%Wood
Private vs. public school enrollment:
| Here: | 17.0% |
| New Hampshire: | 11.4% |
| Here: | 7.8% |
| New Hampshire: | 14.0% |
| Here: | 44.2% |
| New Hampshire: | 38.0% |


