Lebanon, CT (Connecticut) Houses and Residents
| Lebanon: | $309,799 |
| Connecticut: | $347,200 |
Total population: 7,308 (Urban population: 30 (all inside urban clusters), Rural population: 6,877 (140 farm, 6,737 nonfarm))
Houses: 2,820 (2,446 occupied: 2,167 owner occupied, 279 renter occupied)
| % of renters here: | 11% |
| State: | 34% |
Housing density: 52 houses/condos per square mile
Median price asked for vacant for-sale houses and condos in 2022 in this county: $309,766.
Median contract rent in 2022: $1,209 (lower quartile is $942, upper quartile is $1,482)
Median rent asked for vacant for-rent units in 2022: $1,272
Median gross rent in Lebanon, CT in 2022: $1,354
Housing units in Lebanon with a mortgage: 1,365 (158 second mortgage, 251 home equity loan, 0 both second mortgage and home equity loan)
Houses without a mortgage: 350
Compare current foreclosures near Lebanon, CT:
| Photo | Address | Area | Beds / Baths | Price | Details |
|---|---|---|---|---|---|

|
#1
Beaumont Hwy
Lebanon, CT 06249
|
1,719 sq. feet
|
1 baths 4 beds |
show details | |

|
#2
Leonard Bridge Rd
Lebanon, CT 06249
|
2,748 sq. feet
|
2 baths 4 beds |
show details | |

|
#3
Packerville Rd
Plainfield, CT 06374
|
998 sq. feet
|
1 baths 2 beds |
$103,900
|
show details |

|
#4
Lake Dr E
Oakdale, CT 06370
|
1,346 sq. feet
|
1 baths 3 beds |
$335,000
|
show details |

|
#5
Pleasant St
Willimantic, CT 06226
|
2,836 sq. feet
|
3 baths 6 beds |
show details | |

|
#6
Riverside Dr
Baltic, CT 06330
|
1,400 sq. feet
|
2 baths 2 beds |
show details | |

|
#7
Maple St
Norwich, CT 06360
|
1,242 sq. feet
|
2 baths 3 beds |
show details | |

|
#8
Sycamore Rd
Norwich, CT 06360
|
2,454 sq. feet
|
3 baths 5 beds |
show details | |

|
#9
Old Colchester Rd
Uncasville, CT 06382
|
1,634 sq. feet
|
2 baths 2 beds |
show details | |

|
#10
Fairmount St
Norwich, CT 06360
|
4,495 sq. feet
|
4 baths 8 beds |
show details |
| Photo | Address | Area | Beds / Baths | Price | Details |
|---|---|---|---|---|---|

|
#11
Victoria Dr
Colchester, CT 06415
|
1,290 sq. feet
|
2 baths 3 beds |
show details | |

|
#12
Hanover Rd
Baltic, CT 06330
|
1,456 sq. feet
|
2 baths 3 beds |
show details | |

|
#13
Massachusetts Rd
Oakdale, CT 06370
|
1,000 sq. feet
|
2 baths 3 beds |
show details | |

|
#14
Michael Ln
Ledyard, CT 06339
|
910 sq. feet
|
1 baths 3 beds |
show details | |

|
#15
Route 2a
Preston, CT 06365
|
3,878 sq. feet
|
2 baths 5 beds |
show details | |

|
#16
Cove Rd
Preston, CT 06365
|
744 sq. feet
|
1 baths 2 beds |
show details | |

|
#17
Catalina Dr
Coventry, CT 06238
|
1,337 sq. feet
|
1 baths 4 beds |
show details | |

|
#18
Lakewood Rd
East Hampton, CT 06424
|
1,386 sq. feet
|
2 baths 2 beds |
show details | |

|
#19
Asylum St
Norwich, CT 06360
|
2,498 sq. feet
|
2 baths 7 beds |
show details | |

|
#20
Merchants Ave
Taftville, CT 06380
|
2,031 sq. feet
|
4 baths 6 beds |
show details |
| Photo | Address | Area | Beds / Baths | Price | Details |
|---|---|---|---|---|---|

|
#21
Branch Hill Rd
Preston, CT 06365
|
1,400 sq. feet
|
3 baths 3 beds |
show details | |

|
#22
Huntington Rd
Scotland, CT 06264
|
960 sq. feet
|
1 baths 3 beds |
show details | |

|
#23
Brooklyn Tpke
Scotland, CT 06264
|
1,060 sq. feet
|
1 baths 3 beds |
show details | |

|
#24
Boston Tpke
Coventry, CT 06238
|
2,416 sq. feet
|
2 baths 4 beds |
show details | |

|
#25
Woodlawn Ter
Norwich, CT 06360
|
960 sq. feet
|
1 baths 3 beds |
show details | |

|
#26
Florida Rd
East Haddam, CT 06423
|
1,734 sq. feet
|
2 baths 3 beds |
show details | |

|
#27
Pettengill Rd
Marlborough, CT 06447
|
1,796 sq. feet
|
2 baths 3 beds |
show details | |

|
#28
S Canterbury Rd
Canterbury, CT 06331
|
952 sq. feet
|
1 baths 2 beds |
show details | |

|
#29
Horse Pond Rd Apt C
Salem, CT 06420
|
840 sq. feet
|
1 baths 2 beds |
show details | |

|
#30
Mansfield Hollow Rd
Mansfield Center, CT 06250
|
1,780 sq. feet
|
1 baths 3 beds |
show details |
| Photo | Address | Area | Beds / Baths | Price | Details |
|---|---|---|---|---|---|

|
#31
School Rd
Andover, CT 06232
|
1,326 sq. feet
|
2 baths 3 beds |
show details | |

|
#32
Blvd Rd
Windham, CT 06280
|
1,322 sq. feet
|
1 baths 3 beds |
show details | |

|
#33
E Lake Rd
Oakdale, CT 06370
|
1,195 sq. feet
|
3 baths 3 beds |
show details | |

|
#34
Lennys Ln
Hampton, CT 06247
|
1,402 sq. feet
|
2 baths 4 beds |
show details | |

|
#35
Grant Ct
Norwich, CT 06360
|
1,123 sq. feet
|
1 baths 2 beds |
show details | |

|
#36
S Main St
East Hampton, CT 06424
|
1,380 sq. feet
|
1 baths 3 beds |
show details | |

|
#37
Mathewson St
Jewett City, CT 06351
|
1,680 sq. feet
|
2 baths 5 beds |
show details | |

|
#38
Mathewson St
Jewett City, CT 06351
|
2,364 sq. feet
|
2 baths 4 beds |
show details | |

|
#39
Lucas Park Rd
Norwich, CT 06360
|
1,469 sq. feet
|
2 baths 5 beds |
show details | |

|
#40
Jones Hollow Rd
Marlborough, CT 06447
|
1,984 sq. feet
|
2 baths 3 beds |
show details |
| Photo | Address | Area | Beds / Baths | Price | Details |
|---|---|---|---|---|---|

|
#41
Daly Rd
Hebron, CT 06248
|
1,008 sq. feet
|
1 baths 3 beds |
show details | |

|
#42
Ripley Hill Rd
Coventry, CT 06238
|
1,436 sq. feet
|
2 baths 2 beds |
show details | |

|
#43
Sillimanville Rd
East Hampton, CT 06424
|
1,290 sq. feet
|
2 baths 3 beds |
show details | |

|
#44
Skyline Dr
Uncasville, CT 06382
|
1,094 sq. feet
|
3 baths 3 beds |
show details | |

|
#45
Mount Parnassus Rd
East Haddam, CT 06423
|
2,328 sq. feet
|
3 baths 3 beds |
show details | |

|
#46
North St
Hebron, CT 06248
|
960 sq. feet
|
1 baths 3 beds |
show details | |

|
#47
Chapel Hill Rd
Oakdale, CT 06370
|
1,008 sq. feet
|
3 baths 2 beds |
show details | |

|
#48
Denler Dr
Marlborough, CT 06447
|
1,476 sq. feet
|
3 baths 3 beds |
show details | |

|
#49
Jackson Ln
Mansfield Center, CT 06250
|
2,790 sq. feet
|
3 baths 4 beds |
show details | |

|
Check over 1 million property listings on Foreclosure.com!
|
browse all offers | |||
Latest news about housing in Lebanon, CT collected exclusively by city-data.com from local newspapers, TV, and radio stations

 | 2024 Connecticut Town Tournament VI (Celebrating the 10-Year Anniversary & Dazzleman's Memorial) (1127 replies) |
| Does Connecticut Have the Best Pizza in America? (499 replies) |
| Connecticut TOWN TOURNAMENT V (2022) (831 replies) |
| Rental Homes in CT? (6 replies) |
| Living in southern Lebanon (15 replies) |
| Any schools in Greenwich area without DEI? (73 replies) |

Household type by relationship:
Households: 261,273- In family households: 214,652 (47,484 male householders, 22,378 female householders)
52,173 spouses, 73,395 children (67,999 natural, 1,935 adopted, 3,461 stepchildren), 4,214 grandchildren, 2,063 brothers or sisters, 2,316 parents, foster children, 2,625 other relatives, 6,387 non-relatives
- In nonfamily households: 46,621 (18,056 male householders (13,616 living alone)), 19,139 female householders (15,978 living alone)), 9,426 nonrelatives
- In group quarters: 12,782 (5,482 institutionalized population)
43,726 married couples with children.
14,569 single-parent households (3,084 men, 11,485 women).
94.0% of residents of Lebanon speak English at home.
2.3% of residents speak Spanish at home (80% speak English very well, 20% speak English well).
3.2% of residents speak other Indo-European language at home (49% speak English very well, 41% speak English well, 10% speak English not well).
0.1% of residents speak Asian or Pacific Island language at home (100% speak English well).
0.4% of residents speak other language at home (23% speak English very well, 77% speak English well).
Foreign born population: 365 (4.4%)
(91.8% of them are naturalized citizens)
| Here: | 7.2 |
| State: | 6.5 |
| Here: | 4.7 |
| State: | 4.0 |

- Bedrooms in owner-occupied houses and condos in Lebanon, Connecticut
- 7no bedroom
- 601 bedroom
- 3672 bedrooms
- 1,3223 bedrooms
- 3584 bedrooms
- 535+ bedrooms

- Bedrooms in renter-occupied apartments in Lebanon, Connecticut
- 0no bedroom
- 471 bedroom
- 1462 bedrooms
- 703 bedrooms
- 164 bedrooms
- 05+ bedrooms

- Cars and other vehicles available in Lebanon in owner-occupied houses/condos
- 50no vehicle
- 2621 vehicle
- 1,0632 vehicles
- 6033 vehicles
- 1324 vehicles
- 575+ vehicles

- Cars and other vehicles available in Lebanon in renter-occupied apartments
- 32no vehicle
- 931 vehicle
- 1172 vehicles
- 293 vehicles
- 04 vehicles
- 85+ vehicles

- Rooms in owner-occupied houses in Lebanon, Connecticut
- 01 room
- 72 rooms
- 453 rooms
- 1444 rooms
- 4955 rooms
- 5756 rooms
- 4527 rooms
- 2878 rooms
- 1629+ rooms

- Rooms in renter-occupied apartments in Lebanon, Connecticut
- 01 room
- 162 rooms
- 413 rooms
- 1144 rooms
- 475 rooms
- 326 rooms
- 167 rooms
- 68 rooms
- 79+ rooms


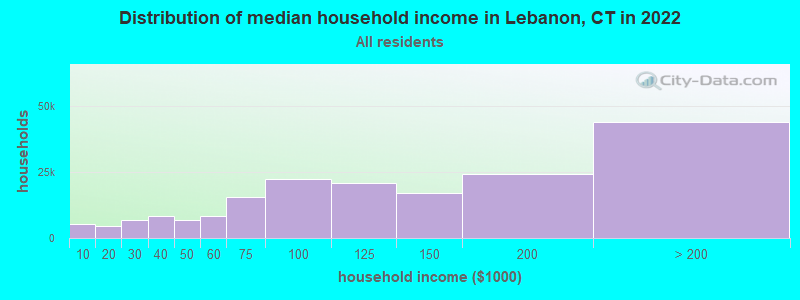
Lebanon, CT household income distribution

- 5,213Less than $10,000
- 4,438$10,000 to $19,999
- 6,621$20,000 to $29,999
- 8,210$30,000 to $39,999
- 6,786$40,000 to $49,999
- 8,048$50,000 to $59,999
- 15,184$60,000 to $74,999
- 22,056$75,000 to $99,999
- 20,754$100,000 to $124,999
- 16,720$125,000 to $149,999
- 23,998$150,000 to $199,999
- 43,657$200,000 or more
Percentage of workers working in this county: 52.2%
Number of people working at home: 832 (18.7% of all workers)
Travel time to work (commute)
- Less than 5 minutes: 128
- 5 to 9 minutes: 261
- 10 to 14 minutes: 273
- 15 to 19 minutes: 587
- 20 to 24 minutes: 377
- 25 to 29 minutes: 116
- 30 to 34 minutes: 501
- 35 to 39 minutes: 239
- 40 to 44 minutes: 330
- 45 to 59 minutes: 504
- 60 to 89 minutes: 196
- 90 or more minutes: 120
Means of transportation to work:
- Drove a car alone: 3,179 (83.9%)
- Carpooled: 326 (8.6%)
- Bus or trolley bus: 54 (1.4%)
- Railroad: 8 (0.2%)
- Walked: 65 (1.7%)
- Worked at home: 158 (4.2%)


- Year of entry for the foreign-born population in Lebanon, Connecticut
- 231995 to March 2000
- 01990 to 1994
- 51985 to 1989
- 61980 to 1984
- 251975 to 1979
- 441970 to 1974
- 161965 to 1969
- 101Before 1965

First ancestries reported:
- Irish: 1,276 (14.6%)
- English: 1,235 (14.2%)
- Italian: 1,084 (12.4%)
- German: 1,011 (11.6%)
- French: 897 (10.3%)
- Polish: 818 (9.4%)
- Other: 690 (7.9%)
- French Canadian: 439 (5.0%)
- United States: 245 (2.8%)
- Swedish: 173 (2.0%)
- Scottish: 145 (1.7%)
- Czech: 129 (1.5%)
- Russian: 99 (1.1%)
- Ukrainian: 73 (0.8%)
- Lithuanian: 62 (0.7%)
- Hungarian: 61 (0.7%)
- Norwegian: 58 (0.7%)
- Scotch-Irish: 52 (0.6%)
- Danish: 44 (0.5%)
- Portuguese: 42 (0.5%)
- Dutch: 26 (0.3%)
- Slovak: 25 (0.3%)
- Arab: 14 (0.2%)
- Swiss: 14 (0.2%)
- Subsaharan African: 6 (0.07%)
- West Indian: 6 (0.07%)
Most common places of birth for foreign-born residents (%):
| Lebanon: | 14.5% (32) |
| Connecticut: | 5.2% (19,083) |
| Lebanon: | 14.1% (31) |
| Connecticut: | 1.7% (6,247) |
| Lebanon: | 10.0% (22) |
| Connecticut: | 4.4% (16,395) |
| Lebanon: | 10.0% (22) |
| Connecticut: | 3.1% (11,432) |
| Lebanon: | 9.1% (20) |
| Connecticut: | 2.1% (7,596) |
| Lebanon: | 9.1% (20) |
| Connecticut: | 3.2% (12,009) |
| Lebanon: | 5.5% (12) |
| Connecticut: | 6.9% (25,507) |
| Lebanon: | 5.0% (11) |
| Connecticut: | 0.5% (1,983) |
| Lebanon: | 4.5% (10) |
| Connecticut: | 0.7% (2,742) |
| Lebanon: | 4.1% (9) |
| Connecticut: | 0.4% (1,374) |
| Lebanon: | 4.1% (9) |
| Connecticut: | 0.3% (1,032) |
| Lebanon: | 4.1% (9) |
| Connecticut: | 2.3% (8,500) |
| Lebanon: | 3.6% (8) |
| Connecticut: | 0.1% (327) |
| Lebanon: | 2.3% (5) |
| Connecticut: | 3.6% (13,282) |
Place of birth for U.S.-born residents:
- This state: 4,871
- Other state: 1,723
- Northeast: 1,347
- Midwest: 166
- South: 158
- West: 52
68% of Lebanon residents lived in the same house 5 years ago.
Out of people who lived in different houses, 41% lived in this county.
Out of people who lived in different counties, 86% lived in Connecticut.
Education attainment for males 25 years and older:
- No schooling: 33
- Nursery to 4th grade: 7
- 5th and 6th grade: 22
- 7th and 8th grade: 73
- 9th grade: 29
- 10th grade: 50
- 11th grade: 94
- 12th grade, no diploma: 42
- High school graduate (or equivalency): 808
- Less than 1 year of college: 86
- Some college more than 1 year, no degree: 283
- Associate degree: 171
- Bachelor's degree: 381
- Master's degree: 105
- Professional school degree: 35
- Doctorate degree: 20

Education attainment for females 25 years and older:
- No schooling: 17
- Nursery to 4th grade: 0
- 5th and 6th grade: 6
- 7th and 8th grade: 25
- 9th grade: 18
- 10th grade: 43
- 11th grade: 32
- 12th grade, no diploma: 68
- High school graduate (or equivalency): 757
- Less than 1 year of college: 216
- Some college more than 1 year, no degree: 306
- Associate degree: 198
- Bachelor's degree: 388
- Master's degree: 243
- Professional school degree: 27
- Doctorate degree: 9


Housing units in structures:
- One, detached: 2,587
- One, attached: 8
- Two: 76
- 3 or 4: 72
- 5 to 9: 8
- 10 to 19: 11
- 20 to 49: 9
- Mobile homes: 49
Median worth of mobile homes: $140,747
Housing units lacking complete kitchen facilities: 0.6%

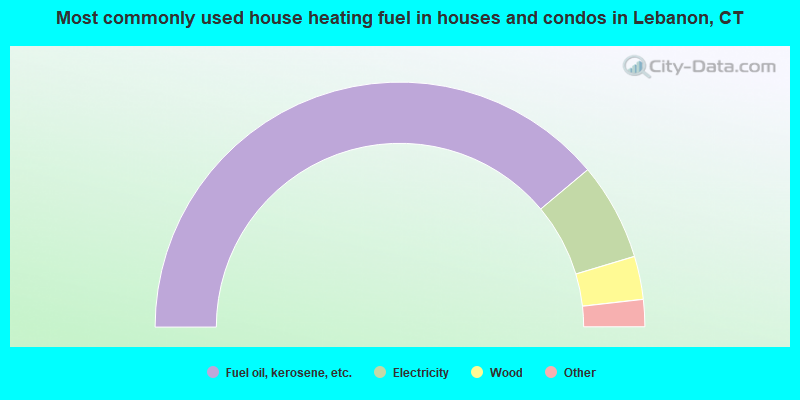
- 77.8%Fuel oil, kerosene, etc.
- 12.9%Electricity
- 5.7%Wood
- 3.2%Bottled, tank, or LP gas
- 0.4%Utility gas
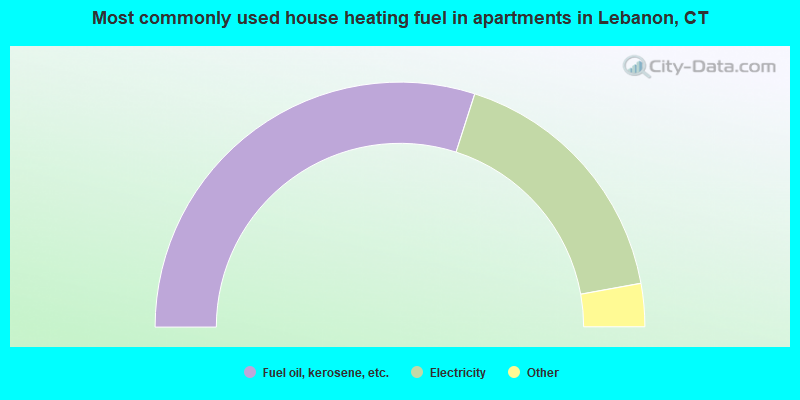
- 59.9%Fuel oil, kerosene, etc.
- 34.4%Electricity
- 2.9%Bottled, tank, or LP gas
- 2.9%Wood
Private vs. public school enrollment:
| Here: | 9.0% |
| Connecticut: | 9.9% |
| Here: | 6.7% |
| Connecticut: | 11.0% |
| Here: | 21.0% |
| Connecticut: | 33.4% |


