Land O' Lakes, FL (Florida) Houses and Residents
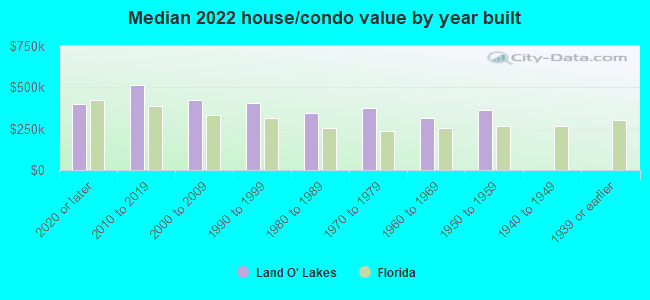
| Land O' Lakes: | $417,501 |
| Florida: | $354,100 |
Mean price in 2022:
Detached houses: $420,135
Here: $420,135 State: $500,941 Townhouses or other attached units: $255,335
Here: $255,335 State: $370,869 In 3-to-4-unit structures: $139,486
Here: $139,486 State: $309,944 In 5-or-more-unit structures: $226,315
Here: $226,315 State: $447,145 Mobile homes: $117,801
Here: $117,801 State: $113,202 Occupied boats, RVs, vans, etc.: $41,341
Here: $41,341 State: $73,933
Total population: 31,996 (Urban population: 19,141, Rural population: 1,651 (60 farm, 1,591 nonfarm))
Houses: 16,061 (15,237 occupied: 12,805 owner occupied, 2,837 renter occupied)
| % of renters here: | 18% |
| State: | 33% |
Housing density: 863 houses/condos per square mile
Median price asked for vacant for-sale houses and condos in 2022: $476,226.
Median contract rent in 2022: $1,616 (lower quartile is $1,196, upper quartile is over $2,000)
Median rent asked for vacant for-rent units in 2022: $3,632
Median gross rent in Land O' Lakes, FL in 2022: $1,750
Housing units in Land O' Lakes with a mortgage: 9,052 (773 second mortgage, 28 home equity loan, 613 both second mortgage and home equity loan)
Houses without a mortgage: 430
Median household income for houses/condos with a mortgage: $115,930
Median household income for apartments without a mortgage: $80,669
Median monthly housing costs: $1,647
Compare current foreclosures in Land O' Lakes, FL:
| Photo | Address | Area | Beds / Baths | Price | Details |
|---|---|---|---|---|---|

|
#1
Blazing Trail Way
Land O Lakes, FL 34639
|
2,486 sq. feet
|
3 baths 4 beds |
$409,900
|
show details |

|
#2
Churchill Pl
Land O Lakes, FL 34639
|
1,838 sq. feet
|
2 baths 3 beds |
show details | |

|
#3
Mayfair Rd
Land O Lakes, FL 34639
|
1,834 sq. feet
|
2 baths 4 beds |
show details | |

|
#4
Painter Dr
Land O Lakes, FL 34639
|
1,796 sq. feet
|
2 baths 3 beds |
show details | |

|
#5
Grasmere Dr
Land O Lakes, FL 34637
|
2,568 sq. feet
|
3 baths 4 beds |
show details | |

|
#6
Stillwood Dr
Land O Lakes, FL 34639
|
1,905 sq. feet
|
3 baths 4 beds |
show details | |

|
#7
Sierra Rd
Land O Lakes, FL 34639
|
1,533 sq. feet
|
2 baths 3 beds |
show details | |

|
#8
Tuckerton Dr
Land O Lakes, FL 34638
|
3,889 sq. feet
|
3 baths 17 beds |
show details | |

|
#9
Ellendale Dr
Land O Lakes, FL 34638
|
2,292 sq. feet
|
3 baths - beds |
show details | |

|
#10
Gage Loop Apt 25
Land O Lakes, FL 34639
|
1,032 sq. feet
|
2 baths - beds |
show details |
| Photo | Address | Area | Beds / Baths | Price | Details |
|---|---|---|---|---|---|

|
#11
Deer Pine Trl
Land O Lakes, FL 34638
|
1,451 sq. feet
|
2 baths - beds |
show details | |

|
#12
Deer Pine Trl
Land O Lakes, FL 34638
|
1,451 sq. feet
|
2 baths - beds |
show details | |

|
#13
New London Ave
Land O Lakes, FL 34638
|
3,390 sq. feet
|
3 baths - beds |
show details | |

|
#14
Butterfly Landing Dr
Land O Lakes, FL 34638
|
1,655 sq. feet
|
2 baths - beds |
show details | |

|
#15
Deerberry Dr
Land O Lakes, FL 34638
|
2,852 sq. feet
|
3 baths - beds |
show details | |

|
#16
Macintosh Rd
Land O Lakes, FL 34639
|
2,332 sq. feet
|
2 baths - beds |
show details | |

|
#17
Stillwood Dr
Land O Lakes, FL 34639
|
2,180 sq. feet
|
2 baths 4 beds |
show details | |

|
#18
Marsh Wren Dr
Land O Lakes, FL 34639
|
1,840 sq. feet
|
2 baths - beds |
show details | |

|
#19
Hampstead Heath Ct
Land O Lakes, FL 34638
|
2,074 sq. feet
|
2 baths - beds |
show details | |

|
#20
Terrazzo Way
Land O Lakes, FL 34638
|
2,529 sq. feet
|
3 baths - beds |
show details |
| Photo | Address | Area | Beds / Baths | Price | Details |
|---|---|---|---|---|---|

|
#21
Fenders Way
Land O Lakes, FL 34638
|
2,470 sq. feet
|
3 baths - beds |
show details | |

|
#22
Coral Ridge Ln
Land O Lakes, FL 34639
|
1,683 sq. feet
|
2 baths - beds |
show details | |

|
#23
Brighton Lake Rd
Land O Lakes, FL 34638
|
2,529 sq. feet
|
3 baths - beds |
show details | |

|
#24
Quarry Badger Rd
Land O Lakes, FL 34638
|
2,322 sq. feet
|
3 baths - beds |
show details | |

|
#25
Baton Rouge Ln
Land O Lakes, FL 34638
|
2,250 sq. feet
|
2 baths - beds |
show details | |

|
#26
Everhart Dr
Land O Lakes, FL 34639
|
2,080 sq. feet
|
2 baths - beds |
show details | |

|
#27
Dinhurst Ct
Land O Lakes, FL 34639
|
2,301 sq. feet
|
3 baths - beds |
show details | |

|
#28
Bea Ct
Land O Lakes, FL 34639
|
1,393 sq. feet
|
2 baths 3 beds |
show details | |

|
#29
Turning Leaf Cir
Land O Lakes, FL 34638
|
1,532 sq. feet
|
2 baths - beds |
show details | |

|
#30
Lake Sharon Dr
Land O Lakes, FL 34638
|
1,966 sq. feet
|
2 baths 2 beds |
show details |
| Photo | Address | Area | Beds / Baths | Price | Details |
|---|---|---|---|---|---|

|
#31
Parkway Blvd
Land O Lakes, FL 34639
|
1,622 sq. feet
|
2 baths 3 beds |
show details | |

|
#32
Bellericay Ln
Land O Lakes, FL 34638
|
1,892 sq. feet
|
3 baths - beds |
show details | |

|
#33
E Lake Dr
Land O Lakes, FL 34639
|
2,680 sq. feet
|
2 baths 5 beds |
show details | |

|
#34
Starry Eyes Way
Land O Lakes, FL 34637
|
2,775 sq. feet
|
3 baths - beds |
show details | |

|
#35
Silver Falls Dr
Land O Lakes, FL 34639
|
1,296 sq. feet
|
3 baths - beds |
show details | |

|
#36
Desert Peace Ave
Land O Lakes, FL 34639
|
1,840 sq. feet
|
2 baths - beds |
show details | |

|
#37
Frame Bnd
Land O Lakes, FL 34638
|
2,172 sq. feet
|
3 baths - beds |
show details | |

|
#38
Marchmont Blvd
Land O Lakes, FL 34638
|
1,791 sq. feet
|
2 baths - beds |
show details | |

|
#39
Heathgate Way
Land O Lakes, FL 34638
|
3,002 sq. feet
|
4 baths - beds |
show details | |

|
#40
Ballantrae Blvd
Land O Lakes, FL 34638
|
3,336 sq. feet
|
3 baths - beds |
show details |
| Photo | Address | Area | Beds / Baths | Price | Details |
|---|---|---|---|---|---|

|
#41
Shady Oak Dr
Land O Lakes, FL 34638
|
1,451 sq. feet
|
3 baths - beds |
show details | |

|
#42
Frehley Run
Land O Lakes, FL 34638
|
2,846 sq. feet
|
3 baths - beds |
show details | |

|
#43
Yachtclub Ter
Land O Lakes, FL 34639
|
2,407 sq. feet
|
3 baths - beds |
show details | |

|
#44
Turning Leaf Circle
Land O Lakes, FL 34638
|
1,532 sq. feet
|
2 baths - beds |
show details | |

|
#45
Canterbury Dr
Land O Lakes, FL 34639
|
1,566 sq. feet
|
2 baths - beds |
show details | |

|
#46
Hawks Landing Dr
Land O Lakes, FL 34638
|
1,532 sq. feet
|
2 baths - beds |
show details | |

|
#47
Shell Bay Dr
Land O Lakes, FL 34638
|
1,747 sq. feet
|
3 baths - beds |
show details | |

|
#48
Machair Ln
Land O Lakes, FL 34638
|
3,461 sq. feet
|
3 baths - beds |
show details | |

|
#49
Flat Rock Pl
Land O Lakes, FL 34639
|
2,225 sq. feet
|
2 baths 4 beds |
show details | |

|
Check over 1 million property listings on Foreclosure.com!
|
browse all offers | |||


 | just bought a house at Valencia Lakes...what to expect?? (50 replies) |
| Ryland Homes in Tampa area (0 replies) |
| Man says he did no wrong by renting out others' homes (8 replies) |
| Looking for new rental in Wesley Chapel/Zephyrhills Area (0 replies) |
| Buying a home in Temple Terrace...Help! (7 replies) |
| Trinity? Land O' Lakes? Wesley Chapel? Any suggestions? (27 replies) |

Median year apartment built: 2006
Household type by relationship:
Households: 43,683- Male householders: 7,880 (1,490 living alone), Female householders: 7,640 (1,702 living alone)
8,962 spouses (8,914 opposite-sex spouses), 1,018 unmarried partners, (998 opposite-sex unmarried partners), 13,795 children (12,732 natural, 374 adopted, 688 stepchildren), 549 grandchildren, 387 brothers or sisters, 1,380 parents, 0 foster children, 225 other relatives, 1,651 non-relatives
- In group quarters: 190
Size of family households: 4,590 2-persons, 2,635 3-persons, 2,756 4-persons, 1,082 5-persons, 157 6-persons, 157 7-or-more-persons.
Size of nonfamily households: 3,161 1-person, 932 2-persons, 73 3-persons, 19 4-persons, 117 5-persons.
6,660 married couples with children.
2,388 single-parent households (739 men, 1,649 women).
77.0% of residents of Land O' Lakes speak English at home.
17.7% of residents speak Spanish at home (56% speak English very well, 17% speak English well, 17% speak English not well, 9% don't speak English at all).
3.3% of residents speak other Indo-European language at home (75% speak English very well, 13% speak English well, 12% speak English not well).
1.5% of residents speak Asian or Pacific Island language at home (57% speak English very well, 23% speak English well, 19% speak English not well, 1% don't speak English at all).
1.7% of residents speak other language at home (97% speak English very well, 3% speak English well).
Foreign born population: 5,463 (12.5%)
(78.3% of them are naturalized citizens)
| Here: | 6.7 |
| State: | 5.9 |
| Here: | 4.8 |
| State: | 4.2 |
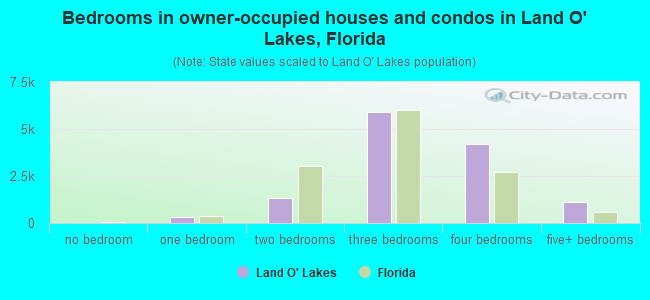
- Bedrooms in owner-occupied houses and condos in Land O' Lakes, Florida
- 0no bedroom
- 3061 bedroom
- 1,3202 bedrooms
- 5,8823 bedrooms
- 4,2054 bedrooms
- 1,0925+ bedrooms
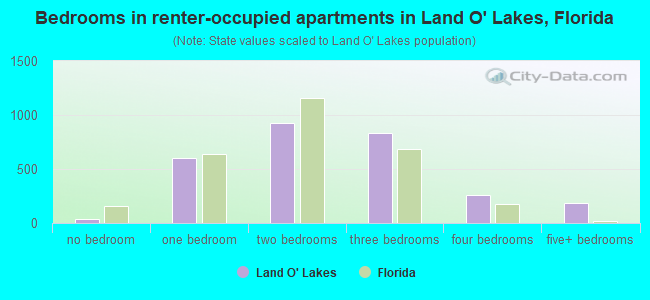
- Bedrooms in renter-occupied apartments in Land O' Lakes, Florida
- 33no bedroom
- 5991 bedroom
- 9262 bedrooms
- 8363 bedrooms
- 2604 bedrooms
- 1825+ bedrooms
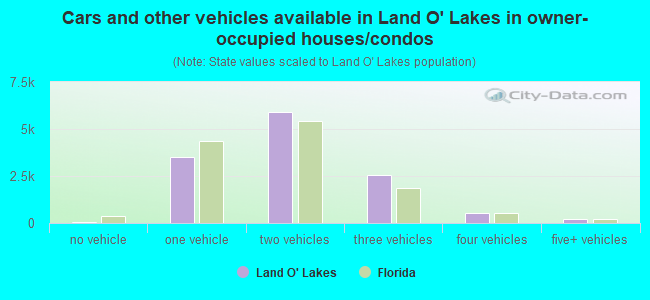
- Cars and other vehicles available in Land O' Lakes in owner-occupied houses/condos
- 51no vehicle
- 3,5191 vehicle
- 5,9272 vehicles
- 2,5633 vehicles
- 5554 vehicles
- 1905+ vehicles
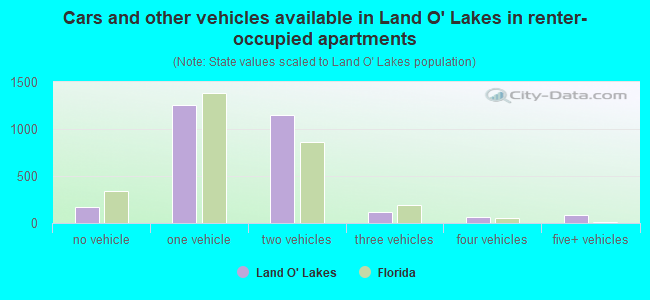
- Cars and other vehicles available in Land O' Lakes in renter-occupied apartments
- 166no vehicle
- 1,2591 vehicle
- 1,1452 vehicles
- 1223 vehicles
- 594 vehicles
- 865+ vehicles
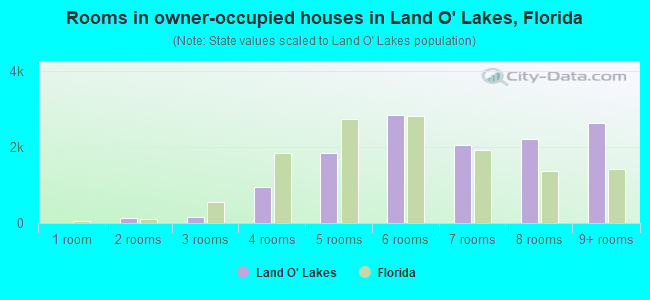
- Rooms in owner-occupied houses in Land O' Lakes, Florida
- 01 room
- 1212 rooms
- 1703 rooms
- 9384 rooms
- 1,8455 rooms
- 2,8396 rooms
- 2,0517 rooms
- 2,2008 rooms
- 2,6419+ rooms
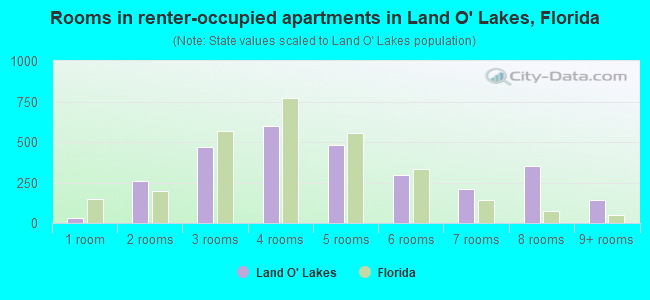
- Rooms in renter-occupied apartments in Land O' Lakes, Florida
- 331 room
- 2602 rooms
- 4693 rooms
- 5984 rooms
- 4795 rooms
- 2966 rooms
- 2097 rooms
- 3518 rooms
- 1419+ rooms
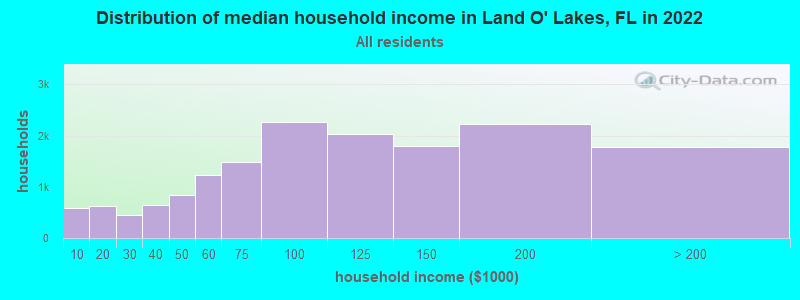
Land O' Lakes, FL household income distribution

- 583Less than $10,000
- 618$10,000 to $19,999
- 442$20,000 to $29,999
- 643$30,000 to $39,999
- 846$40,000 to $49,999
- 1,234$50,000 to $59,999
- 1,480$60,000 to $74,999
- 2,266$75,000 to $99,999
- 2,023$100,000 to $124,999
- 1,788$125,000 to $149,999
- 2,227$150,000 to $199,999
- 1,784$200,000 or more
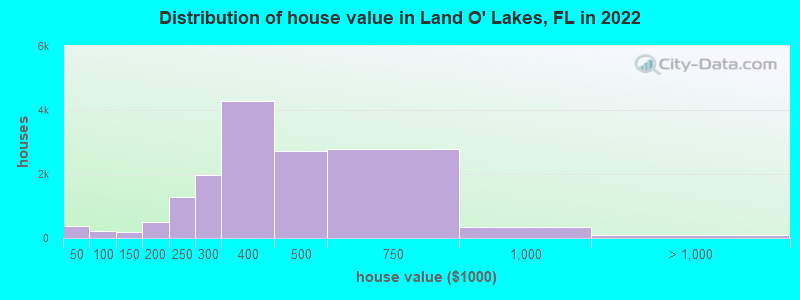
Home value of owner - occupied houses in 2022 in Land O' Lakes, FL
-
- 52Less than $10,000
- 36$10,000 to $14,999
- 37$15,000 to $19,999
- 33$20,000 to $24,999
- 40$25,000 to $29,999
- 16$30,000 to $34,999
- 124$35,000 to $39,999
- 30$40,000 to $49,999
- 68$50,000 to $59,999
- 39$60,000 to $69,999
- 11$70,000 to $79,999
- 53$80,000 to $89,999
- 28$90,000 to $99,999
- 116$100,000 to $124,999
- 84$125,000 to $149,999
- 213$150,000 to $174,999
- 286$175,000 to $199,999
- 1,267$200,000 to $249,999
- 1,977$250,000 to $299,999
- 4,274$300,000 to $399,999
- 2,726$400,000 to $499,999
- 2,789$500,000 to $749,999
- 348$750,000 to $999,999
- 57$1,000,000 to $1,499,999
- 25$1,500,000 to $1,999,999
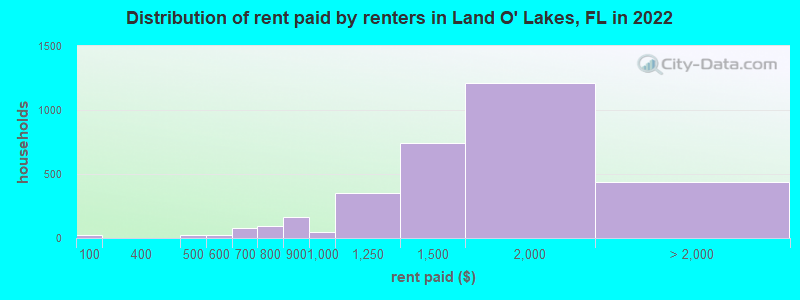
Rent paid by renters in 2022 in Land O' Lakes, FL
-
- 21Less than $100
- 21$450 to $499
- 16$500 to $549
- 3$550 to $599
- 20$600 to $649
- 55$650 to $699
- 80$700 to $749
- 9$750 to $799
- 161$800 to $899
- 45$900 to $999
- 355$1,000 to $1,249
- 745$1,250 to $1,499
- 1,210$1,500 to $1,999
- 373$2,000 to $2,499
- 34$2,500 to $2,999
- 27No cash rent
Percentage of workers working in this county: 48.7%
Number of people working at home: 5,085 (23.0% of all workers)
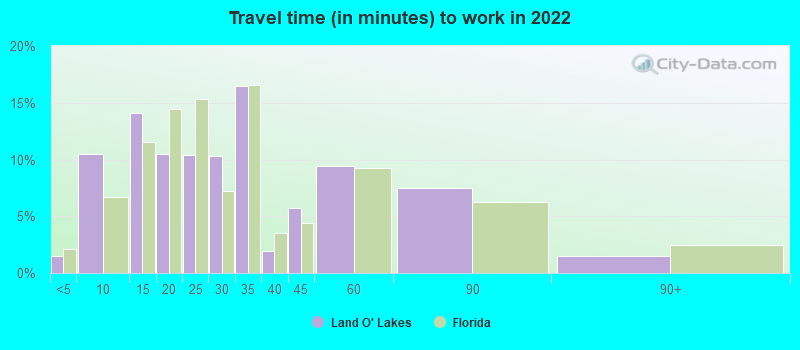
Travel time to work (commute)
- Less than 5 minutes: 124
- 5 to 9 minutes: 1,038
- 10 to 14 minutes: 1,536
- 15 to 19 minutes: 1,411
- 20 to 24 minutes: 2,032
- 25 to 29 minutes: 1,886
- 30 to 34 minutes: 3,147
- 35 to 39 minutes: 1,085
- 40 to 44 minutes: 1,105
- 45 to 59 minutes: 2,155
- 60 to 89 minutes: 1,307
- 90 or more minutes: 355
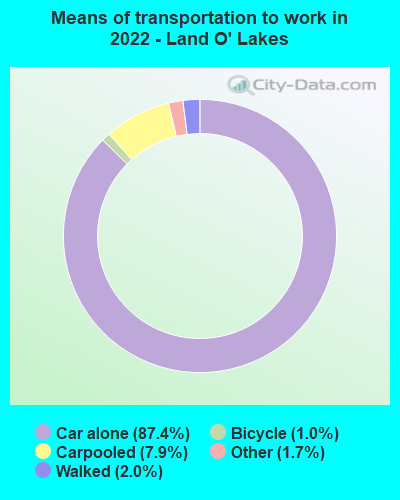
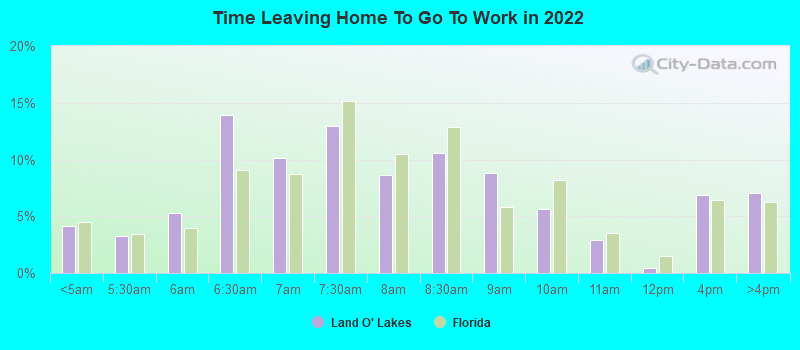
Means of transportation to work:
- Drove a car alone: 8,455 (58.9%)
- Carpooled: 676 (4.7%)
- Taxi: 152 (1.1%)
- Bicycle: 181 (1.3%)
- Walked: 195 (1.4%)
- Worked at home: 5,085 (35.4%)
- Unemployment by race in 2022
- Unemployment rate for White non-Hispanic residents
- 4.2%Males
- 2.5%Females
- Unemployment rate for Black residents
- 4.3%Males
- 32.2%Females
- Unemployment rate for other race residents
- 5.4%Females
- Unemployment rate for two or more race residents
- 3.5%Males
- 6.6%Females
- Unemployment rate for Hispanic or Latino residents
- 3.0%Males
- 1.5%Females
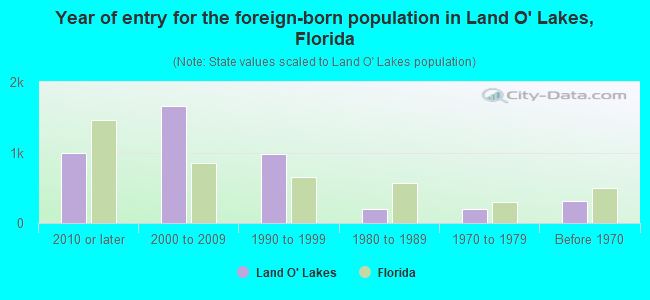
- Year of entry for the foreign-born population in Land O' Lakes, Florida
- 9872010 or later
- 1,6552000 to 2009
- 9821990 to 1999
- 2021980 to 1989
- 1991970 to 1979
- 316Before 1970
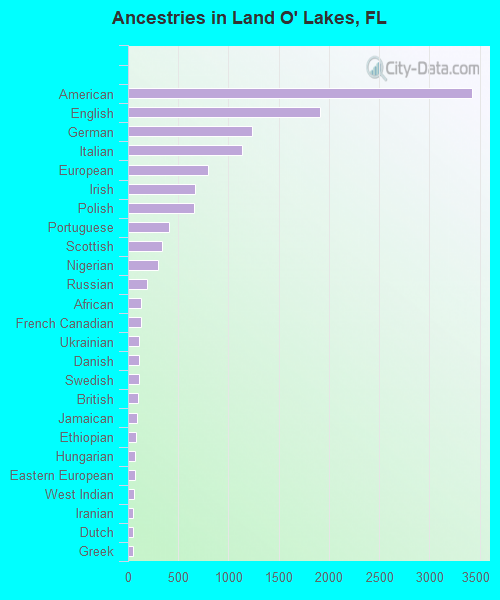
First ancestries reported:
- American: 3,422 (16.0%)
- English: 1,910 (8.9%)
- German: 1,238 (5.8%)
- Italian: 1,138 (5.3%)
- European: 797 (3.7%)
- Irish: 669 (3.1%)
- Polish: 657 (3.1%)
- Portuguese: 411 (1.9%)
- Scottish: 342 (1.6%)
- Nigerian: 295 (1.4%)
- Russian: 191 (0.9%)
- African: 126 (0.6%)
- French Canadian: 125 (0.6%)
- Ukrainian: 114 (0.5%)
- Danish: 112 (0.5%)
- Swedish: 109 (0.5%)
- British: 101 (0.5%)
- Jamaican: 87 (0.4%)
- Ethiopian: 77 (0.4%)
- Hungarian: 74 (0.3%)
- Eastern European: 65 (0.3%)
- West Indian: 58 (0.3%)
- Iranian: 53 (0.2%)
- Dutch: 51 (0.2%)
- Greek: 49 (0.2%)
- Scotch-Irish: 47 (0.2%)
- Czech: 46 (0.2%)
- Lithuanian: 44 (0.2%)
- Egyptian: 42 (0.2%)
- Trinidadian and Tobagonian: 38 (0.2%)
- Cajun: 35 (0.2%)
- Slovak: 30 (0.1%)
- Romanian: 28 (0.1%)
- Cape Verdean: 28 (0.1%)
- French: 27 (0.1%)
- Canadian: 24 (0.1%)
- Armenian: 22 (0.1%)
- Haitian: 22 (0.1%)
- Austrian: 22 (0.1%)
- Welsh: 19 (0.09%)
- Belgian: 18 (0.08%)
- Brazilian: 18 (0.08%)
- Palestinian: 16 (0.07%)
- Ghanaian: 16 (0.07%)
- Australian: 15 (0.07%)
- Turkish: 14 (0.07%)
- Latvian: 12 (0.06%)
- Guyanese: 12 (0.06%)
- Swiss: 12 (0.06%)
- Norwegian: 7 (0.03%)
- Celtic: 6 (0.03%)
Most common places of birth for foreign-born residents (%):
| Land O' Lakes: | 12.6% (603) |
| Florida: | 6.5% (298,669) |
| Land O' Lakes: | 12.5% (596) |
| Florida: | 2.1% (96,693) |
| Land O' Lakes: | 11.2% (535) |
| Florida: | 22.0% (1,006,576) |
| Land O' Lakes: | 6.7% (321) |
| Florida: | 1.8% (84,403) |
| Land O' Lakes: | 5.8% (277) |
| Florida: | 2.1% (94,349) |
| Land O' Lakes: | 3.5% (167) |
| Florida: | 0.7% (31,076) |
| Land O' Lakes: | 3.3% (156) |
| Florida: | 5.7% (262,042) |
| Land O' Lakes: | 3.2% (152) |
| Florida: | 5.6% (257,152) |
| Land O' Lakes: | 2.8% (136) |
| Florida: | 1.0% (43,642) |
| Land O' Lakes: | 2.5% (121) |
| Florida: | 0.5% (21,886) |
| Land O' Lakes: | 2.4% (113) |
| Florida: | 0.6% (25,219) |
| Land O' Lakes: | 2.2% (107) |
| Florida: | 0.1% (3,941) |
| Land O' Lakes: | 2.2% (104) |
| Florida: | 5.0% (227,319) |
| Land O' Lakes: | 2.1% (100) |
| Florida: | 0.3% (14,535) |
| Land O' Lakes: | 1.8% (87) |
| Florida: | 1.2% (54,272) |
| Land O' Lakes: | 1.7% (82) |
| Florida: | 3.0% (137,727) |
| Land O' Lakes: | 1.7% (81) |
| Florida: | 0.3% (13,998) |
| Land O' Lakes: | 1.5% (74) |
| Florida: | 1.3% (60,604) |
Place of birth for U.S.-born residents:
- This state: 17,385
- Other state: 18,959
- Northeast: 7,580
- Midwest: 5,839
- South: 4,024
- West: 1,476
91.0% of Land O' Lakes residents lived in the same house 1 years ago.
Out of people who lived in different houses, 20.1% lived in this county.
Out of people who lived in different counties, 47.6% lived in Florida.
| Land O' Lakes: | 91.0% |
| State average: | 86.3% |
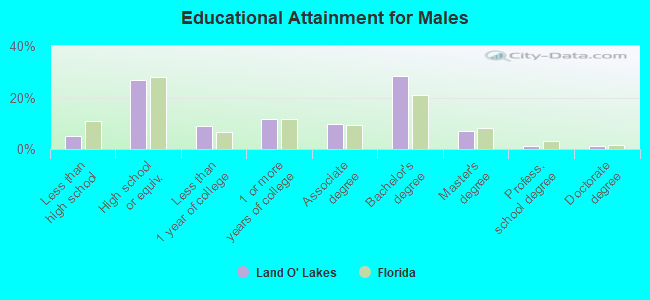
Education attainment for males 25 years and older:
- No schooling: 59
- Nursery to 4th grade: 13
- 5th and 6th grade: 65
- 7th and 8th grade: 31
- 9th grade: 69
- 10th grade: 215
- 11th grade: 103
- 12th grade, no diploma: 201
- High school graduate (or equivalency): 3,968
- Less than 1 year of college: 1,301
- Some college more than 1 year, no degree: 1,727
- Associate degree: 1,464
- Bachelor's degree: 4,210
- Master's degree: 1,051
- Professional school degree: 198
- Doctorate degree: 185
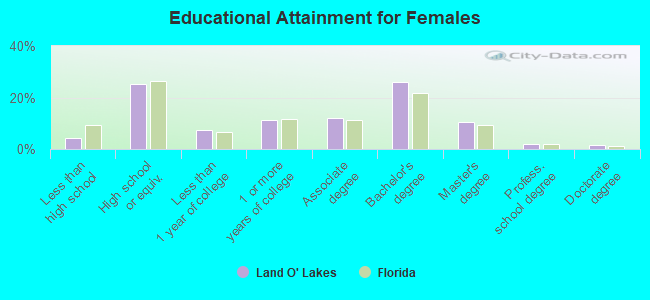
Education attainment for females 25 years and older:
- No schooling: 62
- Nursery to 4th grade: 69
- 5th and 6th grade: 20
- 7th and 8th grade: 81
- 9th grade: 102
- 10th grade: 95
- 11th grade: 49
- 12th grade, no diploma: 187
- High school graduate (or equivalency): 4,016
- Less than 1 year of college: 1,147
- Some college more than 1 year, no degree: 1,763
- Associate degree: 1,877
- Bachelor's degree: 4,098
- Master's degree: 1,687
- Professional school degree: 311
- Doctorate degree: 273


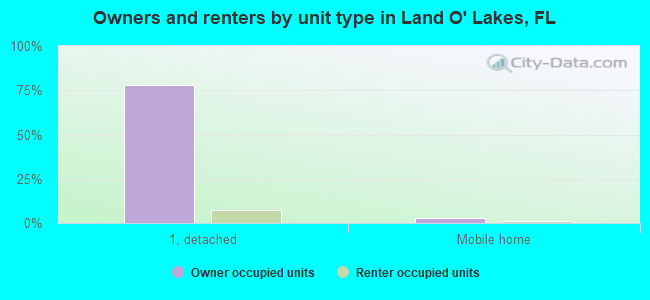
Housing units in structures:
- One, detached: 12,564
- One, attached: 641
- Two: 16
- 3 or 4: 360
- 5 to 9: 526
- 10 to 19: 571
- 20 to 49: 496
- 50 or more: 162
- Mobile homes: 703
- Boats, RVs, vans, etc.: 17
Median worth of mobile homes: $64,810
Housing units lacking complete kitchen facilities in 2022: 1.0%
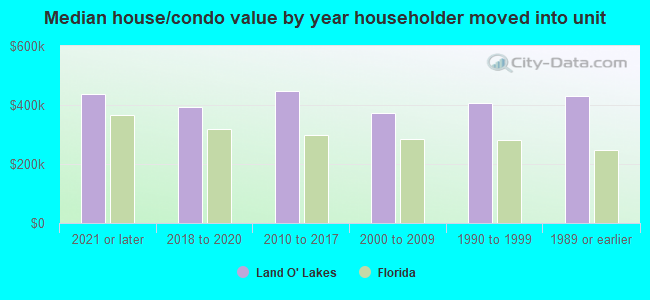
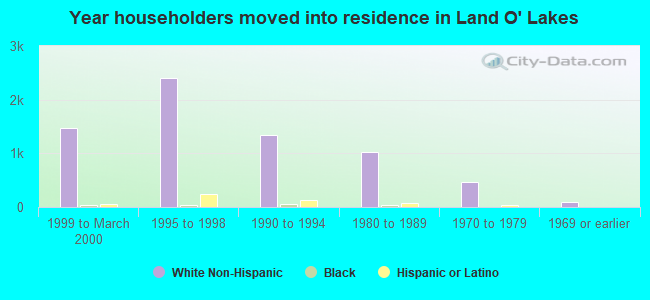
House/condo owner moved in on average 10 years ago
Renter moved in on average 2 years ago
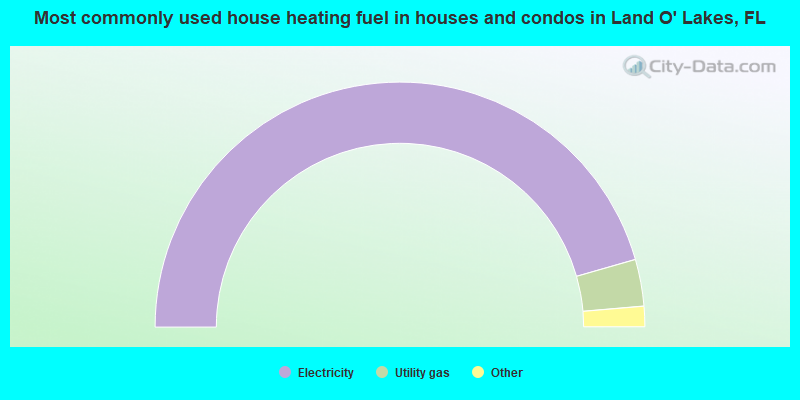
- 91.2%Electricity
- 6.2%Utility gas
- 1.3%Solar energy
- 0.6%No fuel used
- 0.5%Bottled, tank, or LP gas
- 0.2%Wood
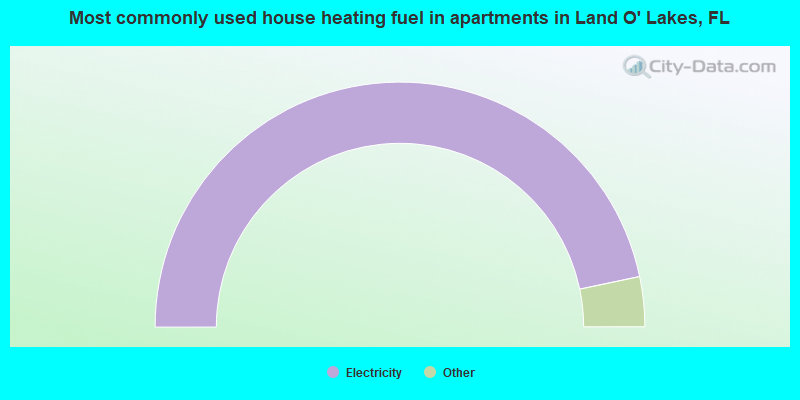
- 93.4%Electricity
- 3.0%Utility gas
- 2.2%No fuel used
- 1.4%Bottled, tank, or LP gas
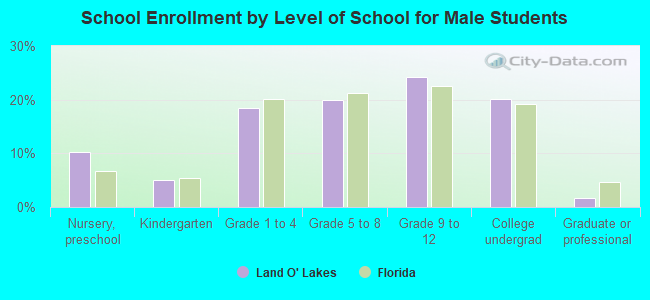
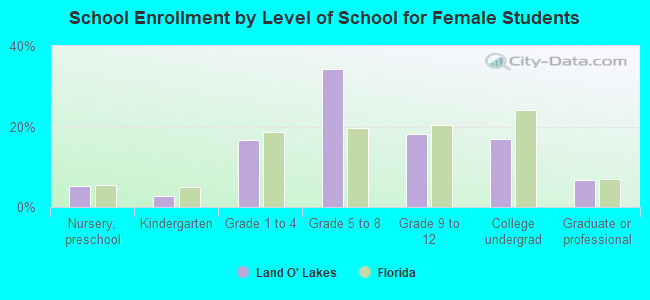
Private vs. public school enrollment:
| Here: | 7.5% |
| Florida: | 15.8% |
| Here: | 10.9% |
| Florida: | 12.9% |
| Here: | 10.3% |
| Florida: | 23.6% |