Lancaster, OH (Ohio) Houses and Residents
| Lancaster: | $184,801 |
| Ohio: | $204,100 |
Mean price in 2022:
Detached houses: $196,679
Here: $196,679 State: $254,366 Townhouses or other attached units: $230,803
Here: $230,803 State: $225,733 In 2-unit structures: $120,256
Here: $120,256 State: $144,384 In 3-to-4-unit structures: $204,489
Here: $204,489 State: $203,002 Mobile homes: $16,766
Here: $16,766 State: $62,719
Total population: 39,595 (Urban population: 34,832 (all inside urban clusters), Rural population: 434 (all nonfarm))
Houses: 18,851 (17,185 occupied: 9,917 owner occupied, 7,352 renter occupied)
| % of renters here: | 43% |
| State: | 33% |
Housing density: 1,043 houses/condos per square mile
Median price asked for vacant for-sale houses and condos in 2022: $61,615.
Median contract rent in 2022: $709 (lower quartile is $585, upper quartile is $955)
Median rent asked for vacant for-rent units in 2022: $542
Median gross rent in Lancaster, OH in 2022: $954
Housing units in Lancaster with a mortgage: 6,058 (716 second mortgage, 8 home equity loan, 594 both second mortgage and home equity loan)
Houses without a mortgage: 209
Median household income for houses/condos with a mortgage: $77,493
Median household income for apartments without a mortgage: $57,174
Median monthly housing costs: $918
Compare current foreclosures in Lancaster, OH:
| Photo | Address | Area | Beds / Baths | Price | Details |
|---|---|---|---|---|---|

|
#1
N George St
Lancaster, OH 43130
|
1,040 sq. feet
|
1 baths 3 beds |
$105,000
|
show details |

|
#2
Davis Ln SW
Lancaster, OH 43130
|
960 sq. feet
|
1 baths 1 beds |
show details | |

|
#3
E Wheeling St
Lancaster, OH 43130
|
3,520 sq. feet
|
3 baths 3 beds |
show details | |

|
#4
E 5th Ave
Lancaster, OH 43130
|
2,140 sq. feet
|
2 baths 4 beds |
show details | |

|
#5
Williamsburg Ln NW
Lancaster, OH 43130
|
888 sq. feet
|
1 baths 3 beds |
show details | |

|
#6
Mount Zion Rd NW
Lancaster, OH 43130
|
1,428 sq. feet
|
2 baths 3 beds |
show details | |

|
#7
N Ewing St
Lancaster, OH 43130
|
1,576 sq. feet
|
1 baths 3 beds |
show details | |

|
#8
W Hubert Ave
Lancaster, OH 43130
|
780 sq. feet
|
1 baths 2 beds |
show details | |

|
#9
Ridgemere Way
Lancaster, OH 43130
|
1,452 sq. feet
|
2 baths 3 beds |
show details | |

|
#10
Peters Ave
Lancaster, OH 43130
|
896 sq. feet
|
1 baths 2 beds |
show details |
| Photo | Address | Area | Beds / Baths | Price | Details |
|---|---|---|---|---|---|

|
#11
S Broad St
Lancaster, OH 43130
|
1,422 sq. feet
|
2 baths 4 beds |
show details | |

|
#12
Ross Rd SE
Lancaster, OH 43130
|
1,120 sq. feet
|
2 baths 3 beds |
show details | |

|
#13
Busby Ave
Lancaster, OH 43130
|
672 sq. feet
|
1 baths 2 beds |
show details | |

|
#14
Park St
Lancaster, OH 43130
|
1,543 sq. feet
|
2 baths 4 beds |
show details | |

|
#15
Northwood Dr NE
Lancaster, OH 43130
|
2,221 sq. feet
|
3 baths 3 beds |
show details | |

|
#16
Barr Dr SW
Lancaster, OH 43130
|
1,416 sq. feet
|
2 baths 3 beds |
show details | |

|
#17
Peters Ave
Lancaster, OH 43130
|
1,104 sq. feet
|
1 baths 3 beds |
show details | |

|
#18
Reber Ave
Lancaster, OH 43130
|
1,563 sq. feet
|
2 baths 3 beds |
show details | |

|
#19
York Town Ct
Lancaster, OH 43130
|
2,040 sq. feet
|
4 baths 3 beds |
show details | |

|
#20
Elder Rd NE
Lancaster, OH 43130
|
1,040 sq. feet
|
1 baths 3 beds |
show details |
| Photo | Address | Area | Beds / Baths | Price | Details |
|---|---|---|---|---|---|

|
#21
Royalton Rd SW
Lancaster, OH 43130
|
1,202 sq. feet
|
2 baths 3 beds |
show details | |

|
#22
E Allen St
Lancaster, OH 43130
|
936 sq. feet
|
1 baths 2 beds |
show details | |

|
#23
Royalton Rd SW
Lancaster, OH 43130
|
2,304 sq. feet
|
1 baths 2 beds |
show details | |

|
#24
Union St
Lancaster, OH 43130
|
1,008 sq. feet
|
2 baths 2 beds |
show details | |

|
#25
E Chestnut St
Lancaster, OH 43130
|
1,630 sq. feet
|
1 baths 3 beds |
show details | |

|
#26
Forest Rose Ave
Lancaster, OH 43130
|
1,120 sq. feet
|
2 baths 3 beds |
show details | |

|
#27
Rainbow Dr NE
Lancaster, OH 43130
|
1,287 sq. feet
|
1 baths 3 beds |
show details | |

|
#28
Snortin Ridge Rd SW
Lancaster, OH 43130
|
1,056 sq. feet
|
1 baths 3 beds |
show details | |

|
#29
N High St
Lancaster, OH 43130
|
2,066 sq. feet
|
2 baths 4 beds |
show details | |

|
#30
Bunker Hill Ct
Lancaster, OH 43130
|
2,016 sq. feet
|
3 baths 4 beds |
show details |
| Photo | Address | Area | Beds / Baths | Price | Details |
|---|---|---|---|---|---|

|
#31
Meda Ave
Lancaster, OH 43130
|
1,013 sq. feet
|
2 baths 3 beds |
show details | |

|
#32
Thornhill Pl
Lancaster, OH 43130
|
2,940 sq. feet
|
3 baths 3 beds |
show details | |

|
#33
Spring Grove Ave
Lancaster, OH 43130
|
2,428 sq. feet
|
3 baths 4 beds |
show details | |

|
#34
Wacker Dr
Lancaster, OH 43130
|
932 sq. feet
|
1 baths 3 beds |
show details | |

|
#35
Fox Trail Dr
Lancaster, OH 43130
|
1,457 sq. feet
|
3 baths 4 beds |
show details | |

|
#36
Heidelberg Dr
Lancaster, OH 43130
|
960 sq. feet
|
2 baths 3 beds |
show details | |

|
#37
E Chestnut St
Lancaster, OH 43130
|
1,524 sq. feet
|
2 baths 4 beds |
show details | |

|
#38
Woodland Ave
Lancaster, OH 43130
|
672 sq. feet
|
1 baths 2 beds |
show details | |

|
#39
Elder Rd NE
Lancaster, OH 43130
|
1,138 sq. feet
|
2 baths 2 beds |
show details | |

|
#40
W Hubert Ave
Lancaster, OH 43130
|
1,070 sq. feet
|
2 baths 3 beds |
show details |
| Photo | Address | Area | Beds / Baths | Price | Details |
|---|---|---|---|---|---|

|
#41
Cleveland Ave
Lancaster, OH 43130
|
1,680 sq. feet
|
2 baths 4 beds |
show details | |

|
#42
Lake St
Lancaster, OH 43130
|
756 sq. feet
|
1 baths 2 beds |
show details | |

|
#43
King St
Lancaster, OH 43130
|
1,144 sq. feet
|
1 baths 1 beds |
show details | |

|
#44
Heidelberg Dr
Lancaster, OH 43130
|
960 sq. feet
|
1 baths 3 beds |
show details | |

|
#45
E Fair Ave
Lancaster, OH 43130
|
840 sq. feet
|
1 baths 2 beds |
show details | |

|
#46
Hamburg Rd SW
Lancaster, OH 43130
|
1,044 sq. feet
|
1 baths 2 beds |
show details | |

|
#47
N Eastwood Ave
Lancaster, OH 43130
|
1,050 sq. feet
|
1 baths 3 beds |
show details | |

|
#48
Mohawk Dr
Lancaster, OH 43130
|
925 sq. feet
|
1 baths 3 beds |
show details | |

|
#49
Reese Ave
Lancaster, OH 43130
|
1,165 sq. feet
|
1 baths 3 beds |
show details | |

|
Check over 1 million property listings on Foreclosure.com!
|
browse all offers | |||

Latest news about housing in Lancaster, OH collected exclusively by city-data.com from local newspapers, TV, and radio stations


Median year apartment built: 1966
Household type by relationship:
Households: 41,514- Male householders: 8,190 (2,386 living alone), Female householders: 8,975 (3,256 living alone)
6,787 spouses (6,772 opposite-sex spouses), 1,702 unmarried partners, (1,621 opposite-sex unmarried partners), 11,101 children (10,016 natural, 295 adopted, 789 stepchildren), 741 grandchildren, 305 brothers or sisters, 448 parents, 182 foster children, 342 other relatives, 1,640 non-relatives
- In group quarters: 1,095
Size of family households: 4,574 2-persons, 2,704 3-persons, 1,617 4-persons, 706 5-persons, 536 6-persons, 314 7-or-more-persons.
Size of nonfamily households: 5,031 1-person, 1,554 2-persons, 47 3-persons, 71 4-persons, 87 5-persons.
4,868 married couples with children.
2,765 single-parent households (743 men, 2,022 women).
96.8% of residents of Lancaster speak English at home.
1.4% of residents speak Spanish at home (75% speak English very well, 20% speak English well, 5% speak English not well).
0.8% of residents speak other Indo-European language at home (54% speak English very well, 29% speak English well, 5% speak English not well, 12% don't speak English at all).
0.7% of residents speak Asian or Pacific Island language at home (90% speak English very well, 10% speak English well).
0.1% of residents speak other language at home (100% speak English very well).
Foreign born population: 1,023 (2.5%)
(46.7% of them are naturalized citizens)
| Here: | 6.3 |
| State: | 6.7 |
| Here: | 4.3 |
| State: | 4.4 |

- Bedrooms in owner-occupied houses and condos in Lancaster, Ohio
- 21no bedroom
- 2011 bedroom
- 2,4102 bedrooms
- 5,4523 bedrooms
- 1,5804 bedrooms
- 2545+ bedrooms

- Bedrooms in renter-occupied apartments in Lancaster, Ohio
- 192no bedroom
- 1,6271 bedroom
- 3,5672 bedrooms
- 1,4443 bedrooms
- 4564 bedrooms
- 675+ bedrooms

- Cars and other vehicles available in Lancaster in owner-occupied houses/condos
- 391no vehicle
- 3,0171 vehicle
- 4,2142 vehicles
- 1,3653 vehicles
- 7214 vehicles
- 2105+ vehicles

- Cars and other vehicles available in Lancaster in renter-occupied apartments
- 1,125no vehicle
- 3,1861 vehicle
- 2,2862 vehicles
- 5683 vehicles
- 1644 vehicles
- 255+ vehicles

- Rooms in owner-occupied houses in Lancaster, Ohio
- 211 room
- 02 rooms
- 483 rooms
- 9344 rooms
- 2,0545 rooms
- 2,8226 rooms
- 1,7317 rooms
- 1,0158 rooms
- 1,2949+ rooms

- Rooms in renter-occupied apartments in Lancaster, Ohio
- 1791 room
- 2492 rooms
- 1,2133 rooms
- 2,4834 rooms
- 1,2405 rooms
- 1,0486 rooms
- 3357 rooms
- 4488 rooms
- 1569+ rooms


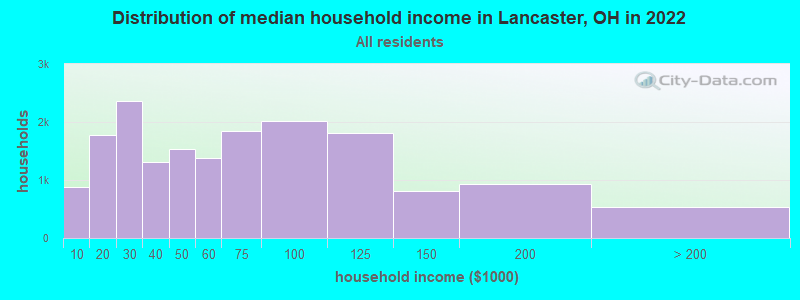
Lancaster, OH household income distribution

- 884Less than $10,000
- 1,773$10,000 to $19,999
- 2,358$20,000 to $29,999
- 1,304$30,000 to $39,999
- 1,538$40,000 to $49,999
- 1,385$50,000 to $59,999
- 1,843$60,000 to $74,999
- 2,021$75,000 to $99,999
- 1,815$100,000 to $124,999
- 813$125,000 to $149,999
- 929$150,000 to $199,999
- 542$200,000 or more
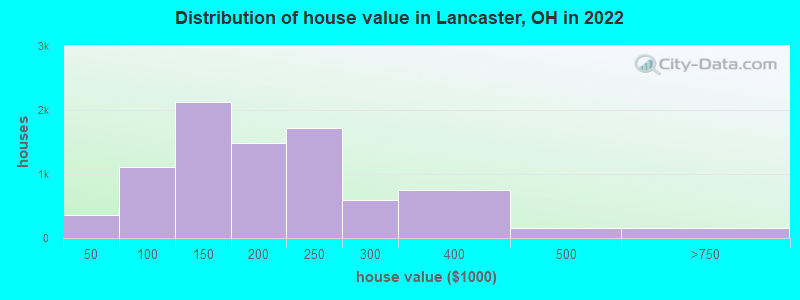
Home value of owner - occupied houses in 2022 in Lancaster, OH
-
- 31Less than $10,000
- 142$10,000 to $14,999
- 29$15,000 to $19,999
- 12$25,000 to $29,999
- 13$30,000 to $34,999
- 126$40,000 to $49,999
- 137$50,000 to $59,999
- 200$60,000 to $69,999
- 193$70,000 to $79,999
- 181$80,000 to $89,999
- 277$90,000 to $99,999
- 1,260$100,000 to $124,999
- 859$125,000 to $149,999
- 837$150,000 to $174,999
- 654$175,000 to $199,999
- 1,722$200,000 to $249,999
- 588$250,000 to $299,999
- 748$300,000 to $399,999
- 150$400,000 to $499,999
- 131$500,000 to $749,999
- 17$1,000,000 to $1,499,999
- 11$1,500,000 to $1,999,999
Rent paid by renters in 2022 in Lancaster, OH
-
- 58Less than $100
- 29$100 to $149
- 125$150 to $199
- 124$200 to $249
- 51$250 to $299
- 226$300 to $349
- 109$350 to $399
- 126$400 to $449
- 382$450 to $499
- 293$500 to $549
- 456$550 to $599
- 270$600 to $649
- 578$650 to $699
- 832$700 to $749
- 730$750 to $799
- 791$800 to $899
- 841$900 to $999
- 388$1,000 to $1,249
- 403$1,250 to $1,499
- 169$1,500 to $1,999
- 80$3,500 or more
- 280No cash rent


Percentage of workers working in this county: 61.1%
Number of people working at home: 1,591 (8.6% of all workers)
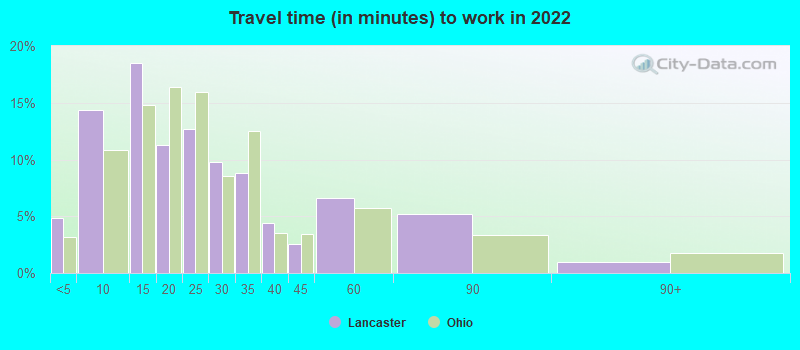
Travel time to work (commute)
- Less than 5 minutes: 898
- 5 to 9 minutes: 2,459
- 10 to 14 minutes: 2,504
- 15 to 19 minutes: 1,710
- 20 to 24 minutes: 967
- 25 to 29 minutes: 1,408
- 30 to 34 minutes: 1,785
- 35 to 39 minutes: 1,195
- 40 to 44 minutes: 788
- 45 to 59 minutes: 1,855
- 60 to 89 minutes: 814
- 90 or more minutes: 466
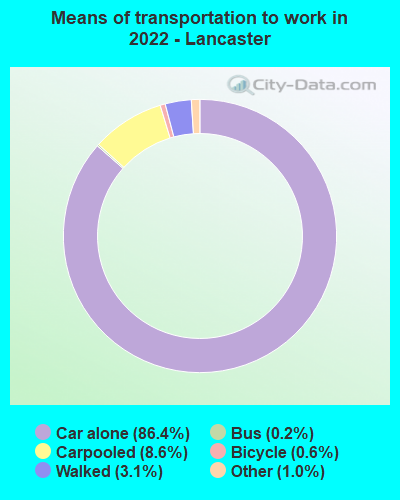
Means of transportation to work:
- Drove a car alone: 15,449 (77.7%)
- Carpooled: 1,646 (8.3%)
- Bus: 35 (0.2%)
- Taxi: 224 (1.1%)
- Bicycle: 127 (0.6%)
- Walked: 560 (2.8%)
- Worked at home: 1,591 (8.0%)

- Unemployment by race in 2022
- Unemployment rate for White non-Hispanic residents
- 3.1%Males
- 4.4%Females
- Unemployment rate for Black residents
- 4.7%Males
- Unemployment rate for Asian residents
- 12.8%Males
- Unemployment rate for other race residents
- 6.6%Males
- Unemployment rate for two or more race residents
- 4.8%Females
- Unemployment rate for Hispanic or Latino residents
- 2.8%Males

- Year of entry for the foreign-born population in Lancaster, Ohio
- 4082010 or later
- 862000 to 2009
- 1421990 to 1999
- 701980 to 1989
- 781970 to 1979
- 88Before 1970
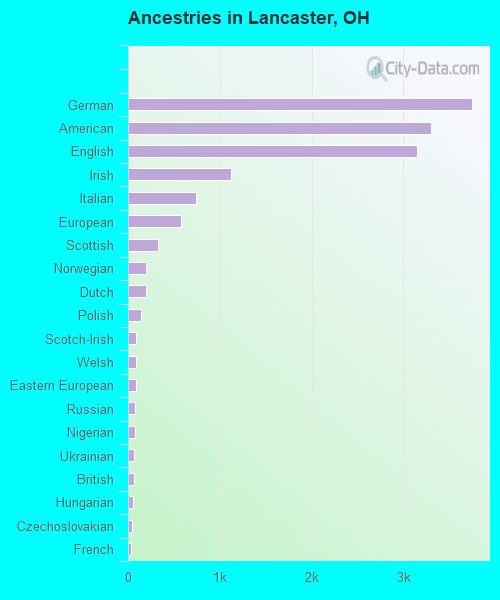
First ancestries reported:
- German: 3,746 (22.1%)
- American: 3,296 (19.5%)
- English: 3,154 (18.6%)
- Irish: 1,123 (6.6%)
- Italian: 741 (4.4%)
- European: 573 (3.4%)
- Scottish: 323 (1.9%)
- Norwegian: 198 (1.2%)
- Dutch: 196 (1.2%)
- Polish: 147 (0.9%)
- Scotch-Irish: 92 (0.5%)
- Welsh: 88 (0.5%)
- Eastern European: 88 (0.5%)
- Russian: 80 (0.5%)
- Nigerian: 71 (0.4%)
- Ukrainian: 68 (0.4%)
- British: 67 (0.4%)
- Hungarian: 57 (0.3%)
- Czechoslovakian: 39 (0.2%)
- French: 37 (0.2%)
- Swiss: 33 (0.2%)
- French Canadian: 29 (0.2%)
- Danish: 29 (0.2%)
- Lebanese: 27 (0.2%)
- Romanian: 27 (0.2%)
- Scandinavian: 27 (0.2%)
- Croatian: 25 (0.1%)
- Moroccan: 21 (0.1%)
- Czech: 17 (0.1%)
- Canadian: 14 (0.08%)
- Pennsylvania German: 12 (0.07%)
- Slavic: 12 (0.07%)
- Slovene: 9 (0.05%)
- Slovak: 7 (0.04%)
- Greek: 3 (0.02%)
- Alsatian: 3 (0.02%)
Most common places of birth for foreign-born residents (%):
| Lancaster: | 28.0% (200) |
| Ohio: | 7.8% (44,796) |
| Lancaster: | 20.1% (144) |
| Ohio: | 11.6% (66,525) |
| Lancaster: | 10.3% (74) |
| Ohio: | 2.2% (12,846) |
| Lancaster: | 8.5% (61) |
| Ohio: | 1.2% (7,029) |
| Lancaster: | 7.4% (53) |
| Ohio: | 2.6% (14,988) |
| Lancaster: | 5.0% (36) |
| Ohio: | 0.5% (2,962) |
| Lancaster: | 4.1% (29) |
| Ohio: | 0.4% (2,031) |
| Lancaster: | 3.1% (22) |
| Ohio: | 6.2% (35,703) |
| Lancaster: | 3.1% (22) |
| Ohio: | 0.3% (1,435) |
| Lancaster: | 2.9% (21) |
| Ohio: | 0.2% (1,013) |
| Lancaster: | 2.2% (16) |
| Ohio: | 0.6% (3,210) |
| Lancaster: | 1.8% (13) |
| Ohio: | 2.0% (11,398) |
Place of birth for U.S.-born residents:
- This state: 33,088
- Other state: 6,538
- Northeast: 1,169
- Midwest: 1,476
- South: 3,202
- West: 675
82.2% of Lancaster residents lived in the same house 1 years ago.
Out of people who lived in different houses, 37.6% lived in this county.
Out of people who lived in different counties, 89.8% lived in Ohio.
| Lancaster: | 82.2% |
| State average: | 87.8% |
Education attainment for males 25 years and older:
- No schooling: 55
- Nursery to 4th grade: 184
- 5th and 6th grade: 5
- 7th and 8th grade: 108
- 9th grade: 46
- 10th grade: 196
- 11th grade: 333
- 12th grade, no diploma: 456
- High school graduate (or equivalency): 6,122
- Less than 1 year of college: 1,114
- Some college more than 1 year, no degree: 1,695
- Associate degree: 988
- Bachelor's degree: 1,614
- Master's degree: 567
- Professional school degree: 292
- Doctorate degree: 262

Education attainment for females 25 years and older:
- No schooling: 88
- Nursery to 4th grade: 63
- 5th and 6th grade: 48
- 7th and 8th grade: 170
- 9th grade: 56
- 10th grade: 213
- 11th grade: 280
- 12th grade, no diploma: 154
- High school graduate (or equivalency): 6,874
- Less than 1 year of college: 964
- Some college more than 1 year, no degree: 1,453
- Associate degree: 1,472
- Bachelor's degree: 1,864
- Master's degree: 862
- Professional school degree: 242
- Doctorate degree: 47


Housing units in structures:
- One, detached: 13,010
- One, attached: 771
- Two: 801
- 3 or 4: 1,540
- 5 to 9: 1,326
- 10 to 19: 491
- 20 to 49: 398
- 50 or more: 408
- Mobile homes: 104
Housing units lacking complete kitchen facilities in 2022: 3.8%
House/condo owner moved in on average 11 years ago
Renter moved in on average 3 years ago

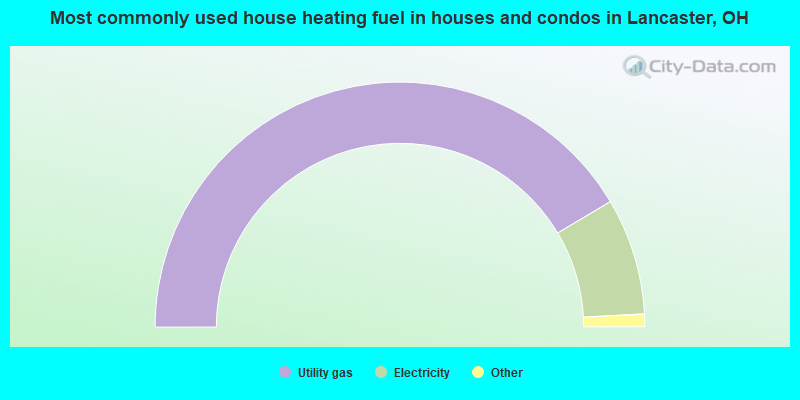
- 82.7%Utility gas
- 15.3%Electricity
- 1.0%Bottled, tank, or LP gas
- 0.3%Other fuel
- 0.3%Wood
- 0.2%Fuel oil, kerosene, etc.
- 0.1%No fuel used
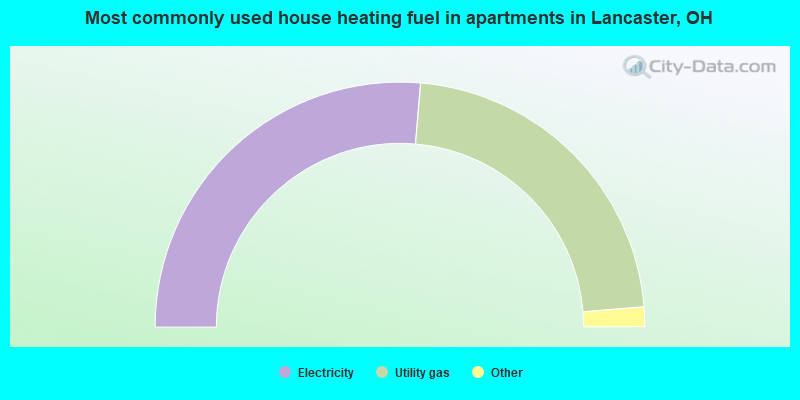
- 52.7%Electricity
- 44.7%Utility gas
- 1.5%Bottled, tank, or LP gas
- 0.6%No fuel used
- 0.5%Other fuel
Private vs. public school enrollment:
| Here: | 11.8% |
| Ohio: | 16.0% |
| Here: | 13.6% |
| Ohio: | 13.1% |
| Here: | 21.1% |
| Ohio: | 22.3% |


