Lakeland, FL (Florida) Houses and Residents
| Lakeland: | $272,300 |
| Florida: | $354,100 |
Mean price in 2022:
Detached houses: $300,461
Here: $300,461 State: $500,941 Townhouses or other attached units: $239,948
Here: $239,948 State: $370,869 In 2-unit structures: $102,176
Here: $102,176 State: $423,188 In 3-to-4-unit structures: $95,710
Here: $95,710 State: $309,944 In 5-or-more-unit structures: $249,465
Here: $249,465 State: $447,145 Mobile homes: $52,500
Here: $52,500 State: $113,202 Occupied boats, RVs, vans, etc.: $22,705
Here: $22,705 State: $73,933
Total population: 102,346 (Urban population: 76,217, Rural population: 1,945 (23 farm, 1,922 nonfarm))
Houses: 57,635 (50,058 occupied: 27,602 owner occupied, 22,456 renter occupied)
| % of renters here: | 45% |
| State: | 33% |
Housing density: 1,257 houses/condos per square mile
Median price asked for vacant for-sale houses and condos in 2022: $470,135.
Median contract rent in 2022: $1,113 (lower quartile is $855, upper quartile is $1,408)
Median rent asked for vacant for-rent units in 2022: $1,855
Median gross rent in Lakeland, FL in 2022: $1,249
Housing units in Lakeland with a mortgage: 13,900 (759 second mortgage, 0 home equity loan, 653 both second mortgage and home equity loan)
Houses without a mortgage: 48
Median household income for houses/condos with a mortgage: $95,359
Median household income for apartments without a mortgage: $53,056
Median monthly housing costs: $1,134
Compare current foreclosures in Lakeland, FL:
| Photo | Address | Area | Beds / Baths | Price | Details |
|---|---|---|---|---|---|

|
#1
Manitoba Dr
Lakeland, FL 33805
|
1,515 sq. feet
|
2 baths 3 beds |
show details | |

|
#2
Timbercreek Loop W
Lakeland, FL 33805
|
994 sq. feet
|
2 baths 3 beds |
show details | |

|
#3
N Crystal Lake Dr Apt 34
Lakeland, FL 33801
|
1,909 sq. feet
|
2 baths 2 beds |
show details | |

|
#4
Ryland Falls Dr
Lakeland, FL 33811
|
1,867 sq. feet
|
2 baths 3 beds |
show details | |

|
#5
Sunny View Dr
Lakeland, FL 33813
|
1,174 sq. feet
|
1 baths 3 beds |
show details | |

|
#6
Pinewood Ave
Lakeland, FL 33815
|
660 sq. feet
|
1 baths 2 beds |
show details | |

|
#7
Siltstone St
Lakeland, FL 33811
|
1,690 sq. feet
|
2 baths 3 beds |
show details | |

|
#8
Prairie Bend Ln
Lakeland, FL 33812
|
1,335 sq. feet
|
1 baths 3 beds |
show details | |

|
#9
Pebble Pass Loop
Lakeland, FL 33810
|
1,046 sq. feet
|
2 baths 3 beds |
show details | |

|
#10
White Marble Ct
Lakeland, FL 33811
|
2,969 sq. feet
|
3 baths 5 beds |
show details |
| Photo | Address | Area | Beds / Baths | Price | Details |
|---|---|---|---|---|---|

|
#11
Prima Lago Ter
Lakeland, FL 33810
|
2,110 sq. feet
|
3 baths 4 beds |
show details | |

|
#12
Pebble Pass Loop
Lakeland, FL 33810
|
1,636 sq. feet
|
2 baths 4 beds |
show details | |

|
#13
Winged Foot Dr
Lakeland, FL 33803
|
4,091 sq. feet
|
5 baths 4 beds |
show details | |

|
#14
Haverhill Dr
Lakeland, FL 33810
|
3,184 sq. feet
|
3 baths 4 beds |
show details | |

|
#15
Raintree Cir
Lakeland, FL 33803
|
1,567 sq. feet
|
2 baths 3 beds |
show details | |

|
#16
White Marble Ct
Lakeland, FL 33811
|
2,739 sq. feet
|
3 baths 5 beds |
show details | |

|
#17
Burrisridge Dr
Lakeland, FL 33809
|
1,602 sq. feet
|
2 baths 3 beds |
show details | |

|
#18
Bayou Bay Dr
Lakeland, FL 33811
|
2,916 sq. feet
|
3 baths 4 beds |
show details | |

|
#19
N Campbell Rd
Lakeland, FL 33810
|
2,041 sq. feet
|
2 baths 4 beds |
show details | |

|
#20
Winchester Estates Cir
Lakeland, FL 33810
|
1,835 sq. feet
|
2 baths 4 beds |
show details |
| Photo | Address | Area | Beds / Baths | Price | Details |
|---|---|---|---|---|---|

|
#21
Toni Ave
Lakeland, FL 33812
|
1,689 sq. feet
|
2 baths 3 beds |
show details | |

|
#22
Jim Kasey Dr
Lakeland, FL 33812
|
2,133 sq. feet
|
2 baths 4 beds |
show details | |

|
#23
Cindy Rd
Lakeland, FL 33810
|
2,520 sq. feet
|
3 baths 4 beds |
show details | |

|
#24
Grey Fox Dr
Lakeland, FL 33810
|
2,081 sq. feet
|
2 baths 3 beds |
show details | |

|
#25
W Crawford St
Lakeland, FL 33805
|
1,078 sq. feet
|
1 baths 2 beds |
show details | |

|
#26
Bayou Bay Dr
Lakeland, FL 33811
|
2,696 sq. feet
|
2 baths 4 beds |
show details | |

|
#27
Ivy Lake Ct
Lakeland, FL 33811
|
2,674 sq. feet
|
3 baths 4 beds |
show details | |

|
#28
Royal Ct N
Lakeland, FL 33812
|
1,600 sq. feet
|
2 baths 3 beds |
show details | |

|
#29
Spinnaker Dr
Lakeland, FL 33805
|
1,529 sq. feet
|
2 baths 3 beds |
show details | |

|
#30
Drew Ct
Lakeland, FL 33810
|
1,762 sq. feet
|
2 baths 3 beds |
show details |
| Photo | Address | Area | Beds / Baths | Price | Details |
|---|---|---|---|---|---|

|
#31
Torrens Dr
Lakeland, FL 33805
|
1,936 sq. feet
|
2 baths 4 beds |
show details | |

|
#32
Orangewood Loop E
Lakeland, FL 33813
|
2,581 sq. feet
|
2 baths 3 beds |
show details | |

|
#33
Blue Highlands Dr
Lakeland, FL 33811
|
2,696 sq. feet
|
2 baths 3 beds |
show details | |

|
#34
Bridgefield Dr
Lakeland, FL 33803
|
3,515 sq. feet
|
4 baths 4 beds |
show details | |

|
#35
Madbury Cir
Lakeland, FL 33810
|
1,533 sq. feet
|
2 baths 3 beds |
show details | |

|
#36
Hampton Hills Dr
Lakeland, FL 33810
|
1,746 sq. feet
|
2 baths 3 beds |
show details | |

|
#37
W Lake Parker Dr
Lakeland, FL 33805
|
1,175 sq. feet
|
1 baths 3 beds |
show details | |

|
#38
Pleasant Pl
Lakeland, FL 33801
|
1,522 sq. feet
|
2 baths 3 beds |
show details | |

|
#39
Forestwood Dr W
Lakeland, FL 33811
|
1,808 sq. feet
|
2 baths 3 beds |
show details | |

|
#40
Grey Fox Dr
Lakeland, FL 33810
|
1,901 sq. feet
|
2 baths 4 beds |
show details |
| Photo | Address | Area | Beds / Baths | Price | Details |
|---|---|---|---|---|---|

|
#41
W 4th St
Lakeland, FL 33805
|
1,116 sq. feet
|
2 baths 2 beds |
show details | |

|
#42
Ward Rd
Lakeland, FL 33810
|
1,365 sq. feet
|
2 baths 2 beds |
show details | |

|
#43
Idlewild St
Lakeland, FL 33801
|
1,284 sq. feet
|
2 baths 3 beds |
show details | |

|
#44
Morning Star Dr
Lakeland, FL 33810
|
2,224 sq. feet
|
2 baths 3 beds |
show details | |

|
#45
Fox Chase Dr
Lakeland, FL 33810
|
1,248 sq. feet
|
2 baths 3 beds |
show details | |

|
#46
Dolostone Dr
Lakeland, FL 33811
|
2,852 sq. feet
|
2 baths 3 beds |
show details | |

|
#47
Shepherd Oaks Pass
Lakeland, FL 33811
|
1,560 sq. feet
|
2 baths 3 beds |
show details | |

|
#48
Hidden Oaks Dr
Lakeland, FL 33811
|
1,630 sq. feet
|
2 baths 3 beds |
show details | |

|
#49
Aquilla Dr
Lakeland, FL 33810
|
3,534 sq. feet
|
3 baths 5 beds |
show details | |

|
Check over 1 million property listings on Foreclosure.com!
|
browse all offers | |||

Latest news about housing in Lakeland, FL collected exclusively by city-data.com from local newspapers, TV, and radio stations

 | Question for realtor about my rental home in Lakeland... (3 replies) |
| Lakeland tops in the nation for real estate appreciation (10 replies) |
| Info on Lakeland's apartment rentals (1 reply) |
| Apartment Rents OUTSIDE of Orlando? (7 replies) |
| Highland Homes (5 replies) |
| Lakeland house rentals - (3 replies) |

Median year apartment built: 1985
Household type by relationship:
Households: 120,044- Male householders: 22,884 (7,854 living alone), Female householders: 27,174 (10,880 living alone)
19,787 spouses (19,229 opposite-sex spouses), 3,146 unmarried partners, (3,081 opposite-sex unmarried partners), 28,167 children (26,428 natural, 274 adopted, 1,465 stepchildren), 2,941 grandchildren, 817 brothers or sisters, 933 parents, 131 foster children, 2,154 other relatives, 2,901 non-relatives
- In group quarters: 9,009
Size of family households: 15,193 2-persons, 5,179 3-persons, 3,482 4-persons, 2,919 5-persons, 1,233 6-persons, 192 7-or-more-persons.
Size of nonfamily households: 18,734 1-person, 2,639 2-persons, 440 3-persons, 47 5-persons.
12,319 married couples with children.
5,763 single-parent households (1,881 men, 3,882 women).
78.5% of residents of Lakeland speak English at home.
15.3% of residents speak Spanish at home (58% speak English very well, 16% speak English well, 22% speak English not well, 4% don't speak English at all).
2.9% of residents speak other Indo-European language at home (77% speak English very well, 15% speak English well, 7% speak English not well, 1% don't speak English at all).
1.3% of residents speak Asian or Pacific Island language at home (46% speak English very well, 44% speak English well, 10% speak English not well).
0.8% of residents speak other language at home (94% speak English very well, 4% speak English well, 1% speak English not well).
Foreign born population: 11,956 (10.0%)
(45.2% of them are naturalized citizens)
| Here: | 6.2 |
| State: | 5.9 |
| Here: | 4.2 |
| State: | 4.2 |

- Bedrooms in owner-occupied houses and condos in Lakeland, Florida
- 58no bedroom
- 1,0121 bedroom
- 7,9072 bedrooms
- 13,7463 bedrooms
- 3,1884 bedrooms
- 1,6915+ bedrooms

- Bedrooms in renter-occupied apartments in Lakeland, Florida
- 1,759no bedroom
- 5,6691 bedroom
- 9,3502 bedrooms
- 4,3093 bedrooms
- 1,3224 bedrooms
- 475+ bedrooms

- Cars and other vehicles available in Lakeland in owner-occupied houses/condos
- 1,058no vehicle
- 11,3381 vehicle
- 10,4372 vehicles
- 2,7073 vehicles
- 1,7364 vehicles
- 3265+ vehicles

- Cars and other vehicles available in Lakeland in renter-occupied apartments
- 3,334no vehicle
- 13,6151 vehicle
- 5,0992 vehicles
- 2573 vehicles
- 1084 vehicles
- 435+ vehicles

- Rooms in owner-occupied houses in Lakeland, Florida
- 581 room
- 2352 rooms
- 6563 rooms
- 4,3354 rooms
- 4,7815 rooms
- 5,5936 rooms
- 4,9177 rooms
- 3,9688 rooms
- 3,0599+ rooms

- Rooms in renter-occupied apartments in Lakeland, Florida
- 1,4811 room
- 1,5372 rooms
- 4,8553 rooms
- 4,6994 rooms
- 4,4775 rooms
- 3,6846 rooms
- 8017 rooms
- 5658 rooms
- 3579+ rooms


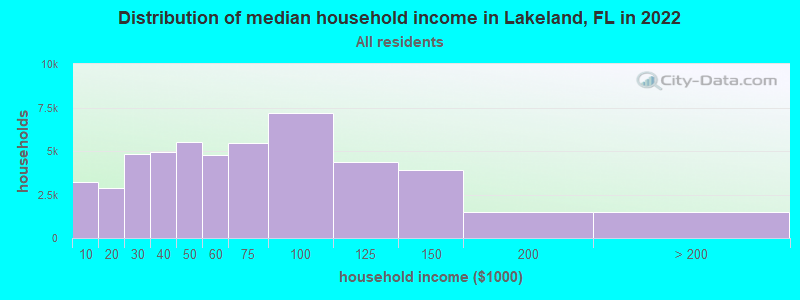
Lakeland, FL household income distribution

- 3,201Less than $10,000
- 2,854$10,000 to $19,999
- 4,839$20,000 to $29,999
- 4,946$30,000 to $39,999
- 5,514$40,000 to $49,999
- 4,774$50,000 to $59,999
- 5,448$60,000 to $74,999
- 7,196$75,000 to $99,999
- 4,351$100,000 to $124,999
- 3,894$125,000 to $149,999
- 1,521$150,000 to $199,999
- 1,520$200,000 or more
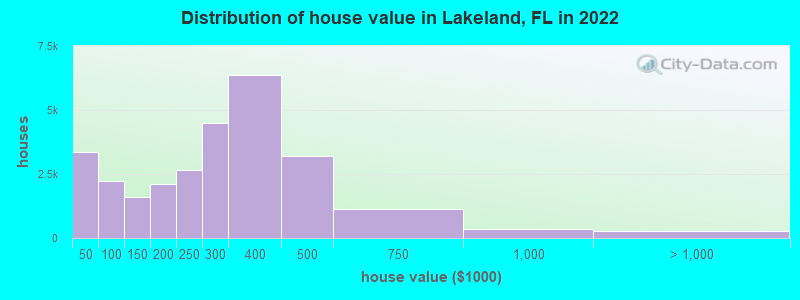
Home value of owner - occupied houses in 2022 in Lakeland, FL
-
- 679Less than $10,000
- 228$10,000 to $14,999
- 94$15,000 to $19,999
- 478$20,000 to $24,999
- 306$25,000 to $29,999
- 556$30,000 to $34,999
- 855$35,000 to $39,999
- 150$40,000 to $49,999
- 289$50,000 to $59,999
- 410$60,000 to $69,999
- 689$80,000 to $89,999
- 677$90,000 to $99,999
- 800$100,000 to $124,999
- 784$125,000 to $149,999
- 1,478$150,000 to $174,999
- 642$175,000 to $199,999
- 2,671$200,000 to $249,999
- 4,510$250,000 to $299,999
- 6,376$300,000 to $399,999
- 3,203$400,000 to $499,999
- 1,119$500,000 to $749,999
- 346$750,000 to $999,999
- 227$1,000,000 to $1,499,999
- 35$1,500,000 to $1,999,999
Rent paid by renters in 2022 in Lakeland, FL
-
- 816Less than $100
- 36$100 to $149
- 220$150 to $199
- 70$200 to $249
- 118$250 to $299
- 130$300 to $349
- 54$400 to $449
- 191$450 to $499
- 185$500 to $549
- 47$550 to $599
- 497$600 to $649
- 258$650 to $699
- 849$700 to $749
- 999$750 to $799
- 1,614$800 to $899
- 2,547$900 to $999
- 4,648$1,000 to $1,249
- 4,471$1,250 to $1,499
- 2,630$1,500 to $1,999
- 772$2,000 to $2,499
- 330$3,500 or more
- 974No cash rent


Percentage of workers working in this county: 85.5%
Number of people working at home: 6,294 (11.6% of all workers)
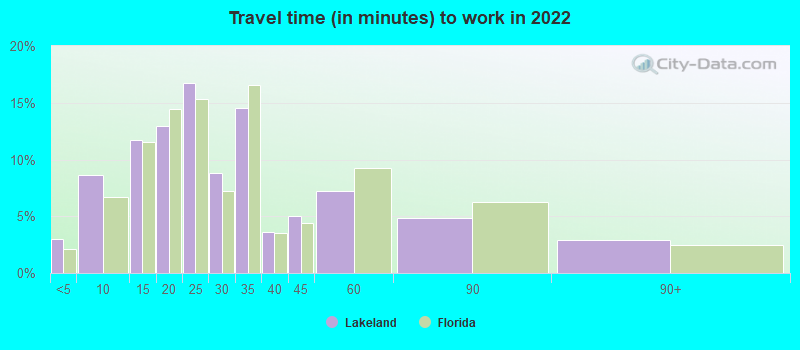
Travel time to work (commute)
- Less than 5 minutes: 1,664
- 5 to 9 minutes: 6,767
- 10 to 14 minutes: 7,600
- 15 to 19 minutes: 7,361
- 20 to 24 minutes: 7,748
- 25 to 29 minutes: 3,218
- 30 to 34 minutes: 6,445
- 35 to 39 minutes: 790
- 40 to 44 minutes: 1,903
- 45 to 59 minutes: 2,653
- 60 to 89 minutes: 2,334
- 90 or more minutes: 908
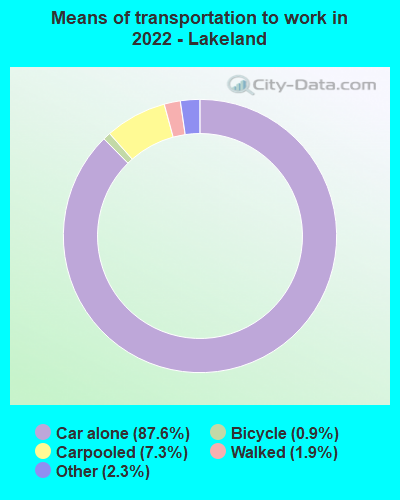
Means of transportation to work:
- Drove a car alone: 81,261 (82.4%)
- Carpooled: 6,754 (6.9%)
- Taxi: 2,100 (2.1%)
- Bicycle: 838 (0.9%)
- Walked: 1,797 (1.8%)
- Worked at home: 5,820 (5.9%)

- Unemployment by race in 2022
- Unemployment rate for White non-Hispanic residents
- 1.5%Males
- 3.6%Females
- Unemployment rate for Black residents
- 5.9%Males
- 6.3%Females
- Unemployment rate for Asian residents
- 1.7%Males
- 7.4%Females
- Unemployment rate for other race residents
- 2.2%Males
- 5.1%Females
- Unemployment rate for two or more race residents
- 1.6%Males
- 5.9%Females
- Unemployment rate for Hispanic or Latino residents
- 2.4%Males
- 6.6%Females

- Year of entry for the foreign-born population in Lakeland, Florida
- 6,9212010 or later
- 3,5962000 to 2009
- 1,4961990 to 1999
- 7521980 to 1989
- 7141970 to 1979
- 1,233Before 1970
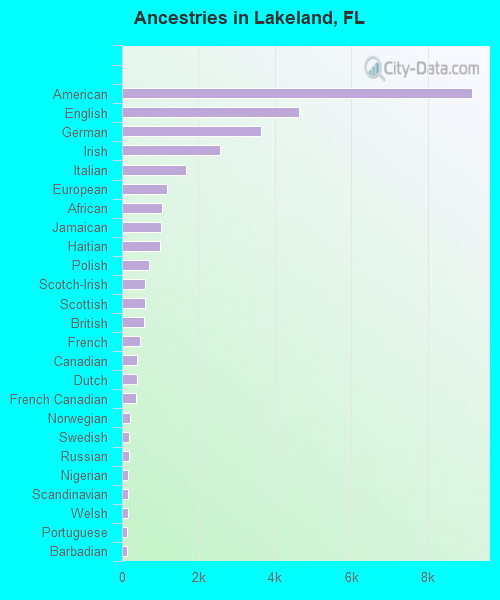
First ancestries reported:
- American: 9,146 (14.7%)
- English: 4,637 (7.4%)
- German: 3,639 (5.8%)
- Irish: 2,571 (4.1%)
- Italian: 1,664 (2.7%)
- European: 1,188 (1.9%)
- African: 1,055 (1.7%)
- Jamaican: 1,032 (1.7%)
- Haitian: 989 (1.6%)
- Polish: 696 (1.1%)
- Scotch-Irish: 591 (0.9%)
- Scottish: 591 (0.9%)
- British: 585 (0.9%)
- French: 483 (0.8%)
- Canadian: 390 (0.6%)
- Dutch: 389 (0.6%)
- French Canadian: 379 (0.6%)
- Norwegian: 222 (0.4%)
- Swedish: 194 (0.3%)
- Russian: 179 (0.3%)
- Nigerian: 164 (0.3%)
- Scandinavian: 160 (0.3%)
- Welsh: 151 (0.2%)
- Portuguese: 143 (0.2%)
- Barbadian: 122 (0.2%)
- Greek: 117 (0.2%)
- Arab: 116 (0.2%)
- Belizean: 100 (0.2%)
- Czech: 97 (0.2%)
- Hungarian: 82 (0.1%)
- Turkish: 80 (0.1%)
- Swiss: 68 (0.1%)
- British West Indian: 67 (0.1%)
- Brazilian: 59 (0.09%)
- Lebanese: 51 (0.08%)
- Romanian: 47 (0.08%)
- Moroccan: 45 (0.07%)
- Austrian: 44 (0.07%)
- Slavic: 43 (0.07%)
- Eastern European: 40 (0.06%)
- Guyanese: 36 (0.06%)
- Danish: 32 (0.05%)
- Finnish: 29 (0.05%)
- Northern European: 28 (0.04%)
- Cape Verdean: 20 (0.03%)
- Croatian: 19 (0.03%)
- Czechoslovakian: 17 (0.03%)
- Slovak: 16 (0.03%)
- Icelander: 16 (0.03%)
- Trinidadian and Tobagonian: 16 (0.03%)
- Slovene: 13 (0.02%)
- West Indian: 13 (0.02%)
- New Zealander: 11 (0.02%)
- Iranian: 10 (0.02%)
- South African: 10 (0.02%)
- Lithuanian: 9 (0.01%)
- Ukrainian: 9 (0.01%)
- Bahamian: 9 (0.01%)
- Celtic: 8 (0.01%)
- Syrian: 8 (0.01%)
- Pennsylvania German: 6 (0.01%)
- Albanian: 6 (0.01%)
Most common places of birth for foreign-born residents (%):
| Lakeland: | 12.3% (1,527) |
| Florida: | 22.0% (1,006,576) |
| Lakeland: | 8.8% (1,090) |
| Florida: | 5.6% (257,152) |
| Lakeland: | 8.3% (1,030) |
| Florida: | 5.0% (227,319) |
| Lakeland: | 7.0% (871) |
| Florida: | 5.7% (262,042) |
| Lakeland: | 6.5% (810) |
| Florida: | 3.0% (137,727) |
| Lakeland: | 6.3% (783) |
| Florida: | 2.4% (109,132) |
| Lakeland: | 6.0% (743) |
| Florida: | 2.1% (94,349) |
| Lakeland: | 5.4% (671) |
| Florida: | 7.5% (342,375) |
| Lakeland: | 3.7% (453) |
| Florida: | 6.5% (298,669) |
| Lakeland: | 3.5% (436) |
| Florida: | 1.8% (84,403) |
| Lakeland: | 2.6% (316) |
| Florida: | 2.1% (97,632) |
| Lakeland: | 1.9% (232) |
| Florida: | 0.3% (13,053) |
| Lakeland: | 1.8% (229) |
| Florida: | 0.7% (34,227) |
| Lakeland: | 1.8% (220) |
| Florida: | 2.1% (96,693) |
| Lakeland: | 1.7% (206) |
| Florida: | 0.2% (11,243) |
Place of birth for U.S.-born residents:
- This state: 53,868
- Other state: 46,951
- Northeast: 15,054
- Midwest: 13,904
- South: 14,283
- West: 3,710
78.2% of Lakeland residents lived in the same house 1 years ago.
Out of people who lived in different houses, 31.9% lived in this county.
Out of people who lived in different counties, 65.4% lived in Florida.
| Lakeland: | 78.2% |
| State average: | 86.3% |
Education attainment for males 25 years and older:
- No schooling: 485
- Nursery to 4th grade: 0
- 5th and 6th grade: 201
- 7th and 8th grade: 482
- 9th grade: 172
- 10th grade: 802
- 11th grade: 826
- 12th grade, no diploma: 1,399
- High school graduate (or equivalency): 14,300
- Less than 1 year of college: 2,813
- Some college more than 1 year, no degree: 4,422
- Associate degree: 3,351
- Bachelor's degree: 7,681
- Master's degree: 2,294
- Professional school degree: 855
- Doctorate degree: 516

Education attainment for females 25 years and older:
- No schooling: 500
- Nursery to 4th grade: 0
- 5th and 6th grade: 287
- 7th and 8th grade: 249
- 9th grade: 621
- 10th grade: 246
- 11th grade: 765
- 12th grade, no diploma: 1,220
- High school graduate (or equivalency): 13,023
- Less than 1 year of college: 4,886
- Some college more than 1 year, no degree: 5,165
- Associate degree: 4,867
- Bachelor's degree: 6,981
- Master's degree: 3,224
- Professional school degree: 504
- Doctorate degree: 335


Housing units in structures:
- One, detached: 27,614
- One, attached: 2,117
- Two: 2,020
- 3 or 4: 3,589
- 5 to 9: 2,457
- 10 to 19: 3,590
- 20 to 49: 3,389
- 50 or more: 3,741
- Mobile homes: 8,919
- Boats, RVs, vans, etc.: 199
Median worth of mobile homes: $34,700
Housing units lacking complete kitchen facilities in 2022: 1.5%
House/condo owner moved in on average 7 years ago
Renter moved in on average 2 years ago

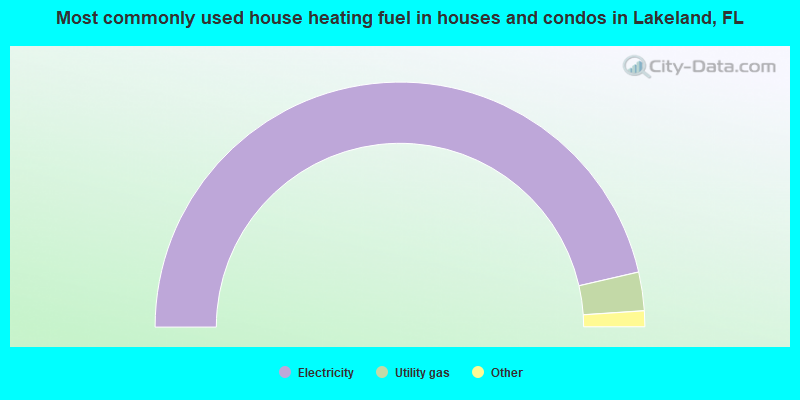
- 92.9%Electricity
- 5.1%Utility gas
- 1.2%Bottled, tank, or LP gas
- 0.6%No fuel used
- 0.2%Solar energy
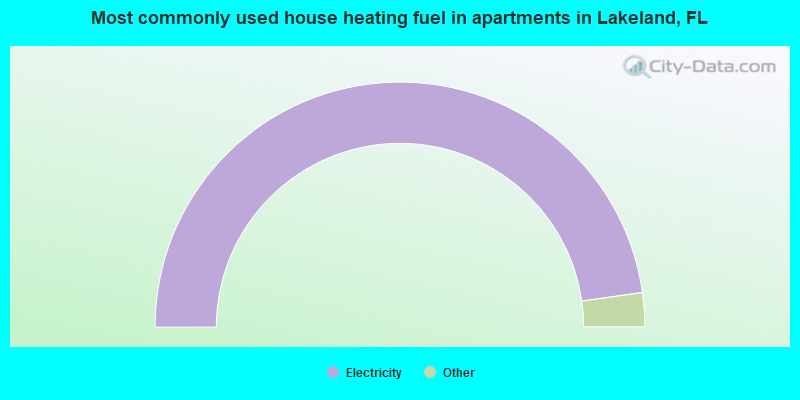
- 95.5%Electricity
- 2.9%Utility gas
- 1.5%No fuel used
- 0.1%Bottled, tank, or LP gas
Private vs. public school enrollment:
| Here: | 17.2% |
| Florida: | 15.8% |
| Here: | 11.7% |
| Florida: | 12.9% |
| Here: | 61.3% |
| Florida: | 23.6% |


