Lake Arbor, MD (Maryland) Houses and Residents
Estimated median house or condo value in 2022: $450,207 (it was $167,900 in 2000 )
Lake Arbor:
$450,207Maryland:
$398,100
Lower value quartile - upper value quartile: $340,427 - $578,771Mean price in 2022: Detached houses: $534,031 Here:
$534,031State:
$526,819
Townhouses or other attached units: $380,082 Here:
$380,082State:
$328,305
In 5-or-more-unit structures: $364,414 Here:
$364,414State:
$350,378
Total population: 9,776 (Urban population: 8,518, Rural population: 0)
Houses: 6,558 (6,262 occupied: 3,962 owner occupied, 2,329 renter occupied )
% of renters here:
37%State:
32%
Housing density: 2,115 houses/condos per square mile
Median price asked for vacant for-sale houses and condos in 2022 in this county: $422,373.
Median contract rent in 2022: $1,962
Median rent asked for vacant for-rent units in 2022: $2,281
Median gross rent in Lake Arbor, MD in 2022: over $2,000
Housing units in Lake Arbor with a mortgage: 3,585 (388 second mortgage, 7 home equity loan, 357 both second mortgage and home equity loan )Houses without a mortgage: 13
Median household income for houses/condos with a mortgage: $132,236
Median household income for apartments without a mortgage: $110,315
Median monthly housing costs: $2,173
Data:
Median house or condo value ($)
Median house or condo value ($ change since 2000)
Median house or condo value ($) - White
Median house or condo value ($) - Black or African American
Median house or condo value ($) - Asian
Median house or condo value ($) - Hispanic or Latino
Median house or condo value ($) - American Indian and Alaska Native
Median house or condo value ($) - Multirace
Median house or condo value ($) - Other Race
Median price asked for mobile homes ($)
Household density (households per square mile)
Mean house or condo value by units in structure - 1, detached ($)
Mean house or condo value by units in structure - 1, attached ($)
Mean house or condo value by units in structure - 2 ($)
Mean house or condo value by units in structure by units in structure - 3 or 4 ($)
Mean house or condo value by units in structure - 5 or more ($)
Mean house or condo value by units in structure - Boat, RV, van, etc. ($)
Mean house or condo value by units in structure - Mobile home ($)
Median contract rent ($)
Median contract rent - Lower quartile ($)
Median contract rent - Upper quartile ($)
Median gross rent ($)
Urban houses (%)
Rural houses (%)
Houses occupied (%)
Houses occupied (% change since 2000)
Houses owner occupied (%)
Houses owner occupied (% change since 2000)
Houses renter occupied (%)
Houses renter occupied (% change since 2000)
Vacant housing units - For rent (%)
Vacant housing units - For rent (% change since 2000)
Vacant housing units - For sale only (%)
Vacant housing units - For sale only (% change since 2000)
Vacant housing units - Rented or sold, not occupied (%)
Vacant housing units - Rented or sold, not occupied (% change since 2000)
Vacant housing units - For seasonal, recreational, or occasional use (%)
Vacant housing units - For seasonal, recreational, or occasional use (% change since 2000)
Vacant housing units - For migrant workers (%)
Vacant housing units - For migrant workers (% change since 2000)
Vacant housing units - Other vacant (%)
Vacant housing units - Other vacant (% change since 2000)
Median monthly housing costs ($)
Median household income for houses/condos with a mortgage ($)
Median household income for houses/condos without a mortgage ($)
Median household income ($)
Median household income ($) - White
Median household income ($) - Black or African American
Median household income ($) - Asian
Median household income ($) - Hispanic or Latino
Median household income ($) - American Indian and Alaska Native
Median household income ($) - Multirace
Median household income ($) - Other Race
Mortgage status - with mortgage (%)
Mortgage status - with second mortgage (%)
Mortgage status - with home equity loan (%)
Mortgage status - with both second mortgage and home equity loan (%)
Mortgage status - without a mortgage (%)
Median year house/condo built
Median year apartment built
Household type by relationship - Male householder living alone (%)
Household type by relationship - Male householder not living alone (%)
Household type by relationship - Female householder living alone (%)
Household type by relationship - Female householder not living alone (%)
Household type by relationship - Opposite-Sex spouse (%)
Household type by relationship - Same-Sex spouse (%)
Household type by relationship - Opposite-Sex unmarried partner (%)
Household type by relationship - Same-Sex unmarried partner (%)
Household type by relationship - In group quarters (%)
Size of family households - 2-person household (%)
Size of family households - 3-person household (%)
Size of family households - 4-person household (%)
Size of family households - 5-person household (%)
Size of family households - 6-person household (%)
Size of family households - 7-or-more-person household (%)
Size of nonfamily households - 1-person household (%)
Size of nonfamily households - 2-person household (%)
Size of nonfamily households - 3-person household (%)
Size of nonfamily households - 4-person household (%)
Size of nonfamily households - 5-person household (%)
Size of nonfamily households - 6-person household (%)
Size of nonfamily households - 7-or-moreperson household (%)
Year house built - Built 2010 or later (%)
Year house built - Built 2000 to 2009 (%)
Year house built - Built 1990 to 1999 (%)
Year house built - Built 1980 to 1989 (%)
Year house built - Built 1970 to 1979 (%)
Year house built - Built 1960 to 1969 (%)
Year house built - Built 1950 to 1959 (%)
Year house built - Built 1940 to 1949 (%)
Year house built - Built 1939 or earlier (%)
Median number of rooms in houses and condos
Median number of rooms in apartments
Median number of bedrooms in owner occupied houses
Mean number of bedrooms in owner occupied houses
Median number of bedrooms in renter occupied houses
Mean number of bedrooms in renter occupied houses
Median number of vehichles in owner occupied houses
Mean number of vehichles in owner occupied houses
Median number of vehichles in renter occupied houses
Mean number of vehichles in renter occupied houses
Rooms in owner-occupied houses - 1 room (%)
Rooms in owner-occupied houses - 2 rooms (%)
Rooms in owner-occupied houses - 3 rooms (%)
Rooms in owner-occupied houses - 4 rooms (%)
Rooms in owner-occupied houses - 5 rooms (%)
Rooms in owner-occupied houses - 6 rooms (%)
Rooms in owner-occupied houses - 7 rooms (%)
Rooms in owner-occupied houses - 8 rooms (%)
Rooms in owner-occupied houses - 9+ rooms (%)
Rooms in renter-occupied houses - 1 room (%)
Rooms in renter-occupied houses - 2 rooms (%)
Rooms in renter-occupied houses - 3 rooms (%)
Rooms in renter-occupied houses - 4 rooms (%)
Rooms in renter-occupied houses - 5 rooms (%)
Rooms in renter-occupied houses - 6 rooms (%)
Rooms in renter-occupied houses - 7 rooms (%)
Rooms in renter-occupied houses - 8 rooms (%)
Rooms in renter-occupied houses - 9+ rooms (%)
Bedrooms in owner-occupied houses - no bedrooms (%)
Bedrooms in owner-occupied houses - 1 bedroom (%)
Bedrooms in owner-occupied houses - 2 bedrooms (%)
Bedrooms in owner-occupied houses - 3 bedrooms (%)
Bedrooms in owner-occupied houses - 4 bedrooms (%)
Bedrooms in owner-occupied houses - 5+ bedrooms (%)
Bedrooms in renter-occupied houses - no bedrooms (%)
Bedrooms in renter-occupied houses - 1 bedroom (%)
Bedrooms in renter-occupied houses - 2 bedrooms (%)
Bedrooms in renter-occupied houses - 3 bedrooms (%)
Bedrooms in renter-occupied houses - 4 bedrooms (%)
Bedrooms in renter-occupied houses - 5+ bedrooms (%)
Vehicles available in owner-occupied houses - no vehicle available (%)
Vehicles available in owner-occupied houses - 1 vehicle available(%)
Vehicles available in owner-occupied houses - 2 Vehicles available (%)
Vehicles available in owner-occupied houses - 3 Vehicles available (%)
Vehicles available in owner-occupied houses - 4 Vehicles available (%)
Vehicles available in owner-occupied houses - 5+ Vehicles available (%)
Vehicles available in renter-occupied houses - no vehicle available (%)
Vehicles available in renter-occupied houses - 1 vehicle available (%)
Vehicles available in renter-occupied houses - 2 Vehicles available (%)
Vehicles available in renter-occupied houses - 3 Vehicles available (%)
Vehicles available in renter-occupied houses - 4 Vehicles available (%)
Vehicles available in renter-occupied houses - 5+ Vehicles available (%)
Housing units in structures - 1, detached (%)
Housing units in structures - 1, attached (%)
Housing units in structures - 2 (%)
Housing units in structures - 3 or 4 (%)
Housing units in structures - 5 to 9 (%)
Housing units in structures - 10 to 19 (%)
Housing units in structures - 20 to 49 (%)
Housing units in structures - 50 or more (%)
Housing units in structures - Mobile home (%)
Housing units in structures - Boat, RV, van, etc. (%)
Housing units in structures - Owners - 1, detached (%)
Housing units in structures - Owners - 1, attached (%)
Housing units in structures - Owners - 2 (%)
Housing units in structures - Owners - 3 or 4 (%)
Housing units in structures - Owners - 5 to 9 (%)
Housing units in structures - Owners - 10 to 19 (%)
Housing units in structures - Owners - 20 to 49 (%)
Housing units in structures - Owners - 50 or more (%)
Housing units in structures - Owners - Mobile home (%)
Housing units in structures - Owners - Boat, RV, van, etc. (%)
Housing units in structures - Renters - 1, detached (%)
Housing units in structures - Renters - 1, attached (%)
Housing units in structures - Renters - 2 (%)
Housing units in structures - Renters - 3 or 4 (%)
Housing units in structures - Renters - 5 to 9 (%)
Housing units in structures - Renters - 10 to 19 (%)
Housing units in structures - Renters - 20 to 49 (%)
Housing units in structures - Renters - 50 or more (%)
Housing units in structures - Renters - Mobile home (%)
Housing units in structures - Renters - Boat, RV, van, etc. (%)
House/condo owner moved in on average (years ago)
Renter moved in on average (years ago)
Year householder moved into unit - Moved in 1999 to March 2000 (%)
Year householder moved into unit - Moved in 1999 to March 2000 (%) - White
Year householder moved into unit - Moved in 1999 to March 2000 (%) - Black or African American
Year householder moved into unit - Moved in 1999 to March 2000 (%) - Asian
Year householder moved into unit - Moved in 1999 to March 2000 (%) - Hispanic or Latino
Year householder moved into unit - Moved in 1999 to March 2000 (%) - American Indian and Alaska Native
Year householder moved into unit - Moved in 1999 to March 2000 (%) - Multirace
Year householder moved into unit - Moved in 1999 to March 2000 (%) - Other Race
Year householder moved into unit - Moved in 1995 to 1998 (%)
Year householder moved into unit - Moved in 1995 to 1998 (%) - White
Year householder moved into unit - Moved in 1995 to 1998 (%) - Black or African American
Year householder moved into unit - Moved in 1995 to 1998 (%) - Asian
Year householder moved into unit - Moved in 1995 to 1998 (%) - Hispanic or Latino
Year householder moved into unit - Moved in 1995 to 1998 (%) - American Indian and Alaska Native
Year householder moved into unit - Moved in 1995 to 1998 (%) - Multirace
Year householder moved into unit - Moved in 1995 to 1998 (%) - Other Race
Year householder moved into unit - Moved in 1990 to 1994 (%)
Year householder moved into unit - Moved in 1990 to 1994 (%) - White
Year householder moved into unit - Moved in 1990 to 1994 (%) - Black or African American
Year householder moved into unit - Moved in 1990 to 1994 (%) - Asian
Year householder moved into unit - Moved in 1990 to 1994 (%) - Hispanic or Latino
Year householder moved into unit - Moved in 1990 to 1994 (%) - American Indian and Alaska Native
Year householder moved into unit - Moved in 1990 to 1994 (%) - Multirace
Year householder moved into unit - Moved in 1990 to 1994 (%) - Other Race
Year householder moved into unit - Moved in 1980 to 1989 (%)
Year householder moved into unit - Moved in 1980 to 1989 (%) - White
Year householder moved into unit - Moved in 1980 to 1989 (%) - Black or African American
Year householder moved into unit - Moved in 1980 to 1989 (%) - Asian
Year householder moved into unit - Moved in 1980 to 1989 (%) - Hispanic or Latino
Year householder moved into unit - Moved in 1980 to 1989 (%) - American Indian and Alaska Native
Year householder moved into unit - Moved in 1980 to 1989 (%) - Multirace
Year householder moved into unit - Moved in 1980 to 1989 (%) - Other Race
Year householder moved into unit - Moved in 1970 to 1979 (%)
Year householder moved into unit - Moved in 1970 to 1979 (%) - White
Year householder moved into unit - Moved in 1970 to 1979 (%) - Black or African American
Year householder moved into unit - Moved in 1970 to 1979 (%) - Asian
Year householder moved into unit - Moved in 1970 to 1979 (%) - Hispanic or Latino
Year householder moved into unit - Moved in 1970 to 1979 (%) - American Indian and Alaska Native
Year householder moved into unit - Moved in 1970 to 1979 (%) - Multirace
Year householder moved into unit - Moved in 1970 to 1979 (%) - Other Race
Year householder moved into unit - Moved in 1969 or earlier (%)
Year householder moved into unit - Moved in 1969 or earlier (%) - White
Year householder moved into unit - Moved in 1969 or earlier (%) - Black or African American
Year householder moved into unit - Moved in 1969 or earlier (%) - Asian
Year householder moved into unit - Moved in 1969 or earlier (%) - Hispanic or Latino
Year householder moved into unit - Moved in 1969 or earlier (%) - American Indian and Alaska Native
Year householder moved into unit - Moved in 1969 or earlier (%) - Multirace
Year householder moved into unit - Moved in 1969 or earlier (%) - Other Race
Housing units lacking complete plumbing facilities (%)
Housing units lacking complete kitchen facilities (%)
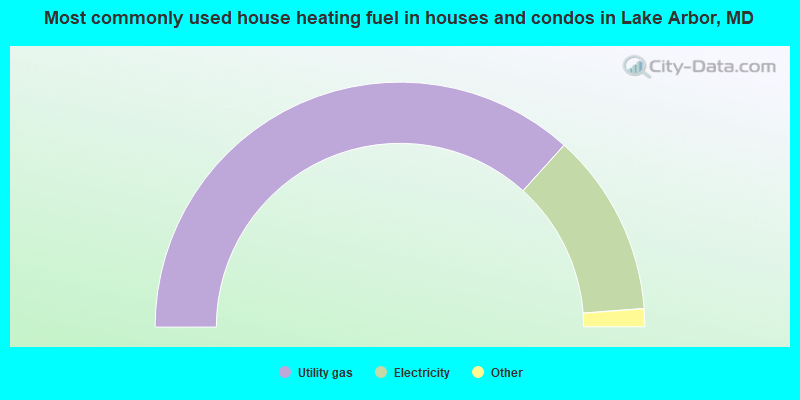
House heating fuel used in houses and condos - Utility gas (%)
House heating fuel used in houses and condos - Bottled, tank, or LP gas (%)
House heating fuel used in houses and condos - Electricity (%)
House heating fuel used in houses and condos - Fuel oil, kerosene, etc. (%)
House heating fuel used in houses and condos - Coal or coke (%)
House heating fuel used in houses and condos - Wood (%)
House heating fuel used in houses and condos - Solar energy (%)
House heating fuel used in houses and condos - Other fuel (%)
House heating fuel used in houses and condos - No fuel used (%)
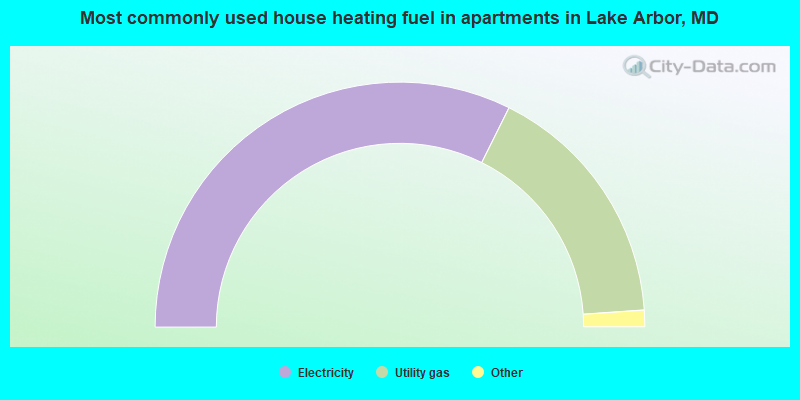
House heating fuel used in apartments - Utility gas (%)
House heating fuel used in apartments - Bottled, tank, or LP gas (%)
House heating fuel used in apartments - Electricity (%)
House heating fuel used in apartments - Fuel oil, kerosene, etc. (%)
House heating fuel used in apartments - Coal or coke (%)
House heating fuel used in apartments - Wood (%)
House heating fuel used in apartments - Solar energy (%)
House heating fuel used in apartments - Other fuel (%)
House heating fuel used in apartments - No fuel used (%)
Median year house/condo built: 1997Median year apartment built: 1999Household type by relationship:
Households: 14,741
Male householders: 2,360 (844 living alone ), Female householders: 3,753 (1,389 living alone )1,898 spouses (1,898 opposite-sex spouses ), 250 unmarried partners , (214 opposite-sex unmarried partners ), 3,739 children (3,427 natural , 134 adopted , 178 stepchildren ), 462 grandchildren , 542 brothers or sisters , 354 parents , 6 foster children , 363 other relatives , 837 non-relatives In group quarters: 173
Size of family households: 1,744 2-persons , 881 3-persons , 584 4-persons , 362 5-persons , 95 6-persons , 80 7-or-more-persons .
Size of nonfamily households: 2,198 1-person , 179 2-persons , 162 3-persons .
1,215 married couples with children. single-parent households (366 men , 684 women ).
77.9% of residents of Lake Arbor speak English at home. of residents speak Spanish at home (89% speak English very well , 6% speak English well , 5% speak English not well ).of residents speak other Indo-European language at home (59% speak English very well , 26% speak English well , 15% speak English not well ).of residents speak Asian or Pacific Island language at home (87% speak English very well , 13% speak English not well ).of residents speak other language at home (97% speak English very well , 3% speak English well ).
Foreign born population: 3,260 (22.1%)of them are naturalized citizens )
Median number of rooms in houses and condos:
Median number of rooms in apartments
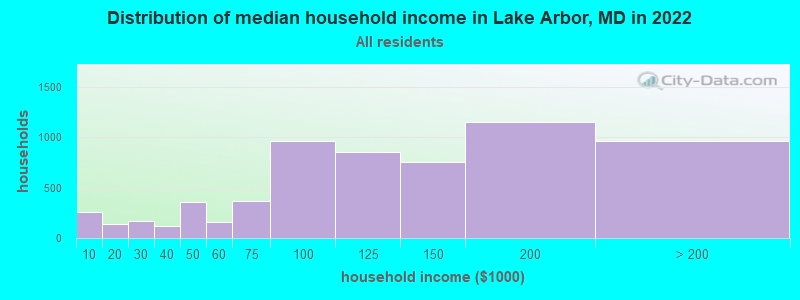
Lake Arbor, MD household income distribution 255 Less than $10,000137 $10,000 to $19,999168 $20,000 to $29,999118 $30,000 to $39,999356 $40,000 to $49,999159 $50,000 to $59,999369 $60,000 to $74,999964 $75,000 to $99,999852 $100,000 to $124,999753 $125,000 to $149,9991,151 $150,000 to $199,999958 $200,000 or more
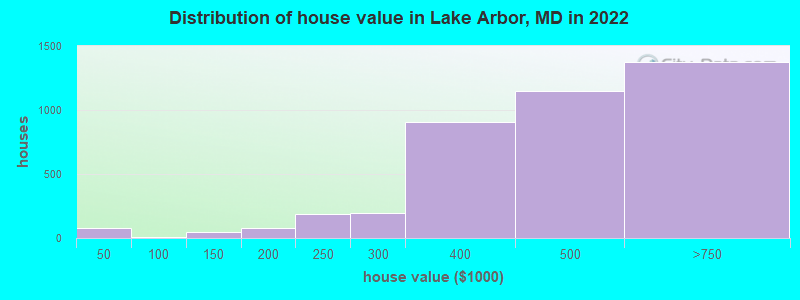
Home value of owner - occupied houses in 2022 in Lake Arbor, MD 81 Less than $10,0008 $50,000 to $59,99910 $100,000 to $124,99935 $125,000 to $149,9995 $150,000 to $174,99973 $175,000 to $199,999187 $200,000 to $249,999199 $250,000 to $299,999905 $300,000 to $399,9991,148 $400,000 to $499,9991,351 $500,000 to $749,99918 $750,000 to $999,9992 $2,000,000 or moreRent paid by renters in 2022 in Lake Arbor, MD 9 $800 to $899121 $1,000 to $1,249129 $1,250 to $1,499765 $1,500 to $1,999703 $2,000 to $2,499109 $2,500 to $2,999161 $3,000 to $3,499132 $3,500 or more43 No cash rent
Percentage of workers working in this county: 43.4%Number of people working at home: 1,451 (17.3% of all workers )
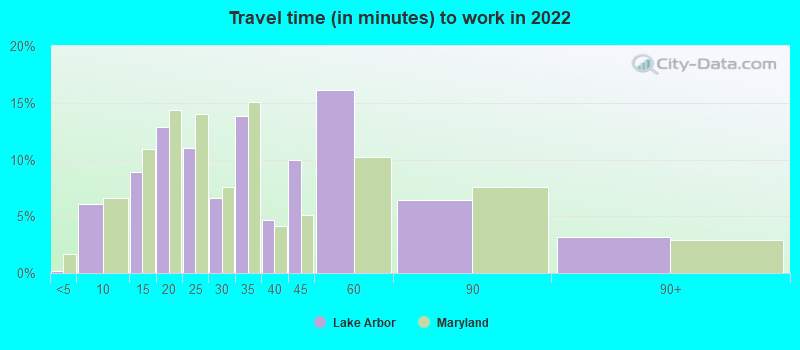
Travel time to work (commute)
Less than 5 minutes: 1555 to 9 minutes: 10010 to 14 minutes: 37515 to 19 minutes: 57920 to 24 minutes: 71225 to 29 minutes: 62630 to 34 minutes: 88635 to 39 minutes: 64340 to 44 minutes: 28945 to 59 minutes: 1,25660 to 89 minutes: 99690 or more minutes: 235
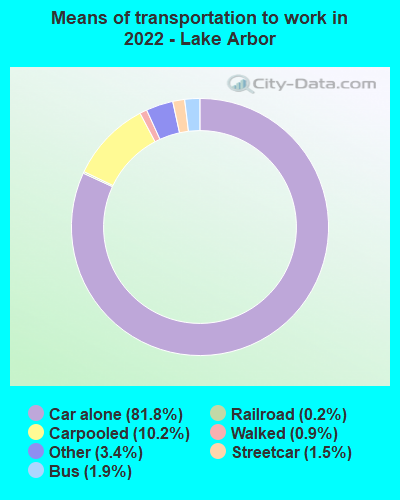
Means of transportation to work:
Drove a car alone: 5,543 (67.2%)Carpooled: 628 (7.6%)Bus : 90 (1.1%)Subway or elevated rail : 72 (0.9%)Light rail, streetcar or trolley : 13 (0.2%)Taxi: 297 (3.6%)Walked: 63 (0.8%)Worked at home: 1,451 (17.6%)
Unemployment by race in 2022
Unemployment rate for White non-Hispanic residents 9.8% MalesUnemployment rate for Black residents 7.0% Males2.4% FemalesUnemployment rate for Hispanic or Latino residents 0.8% Females
Year of entry for the foreign-born population in Lake Arbor, Maryland
1,453 2010 or later 759 2000 to 2009 371 1990 to 1999 245 1980 to 1989 188 1970 to 1979 71 Before 1970
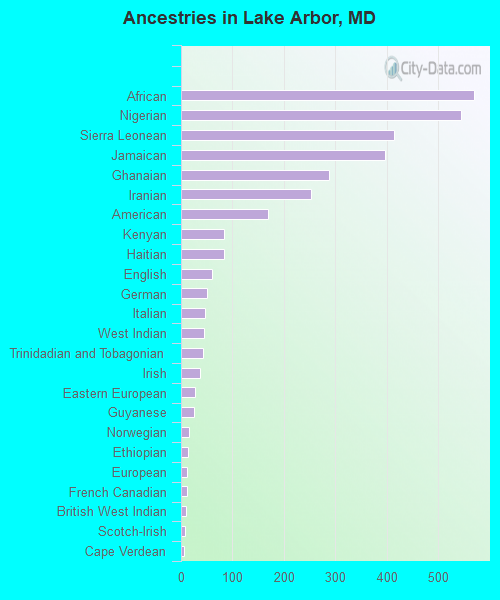
First ancestries reported:
African: 570 (5.3%)
Nigerian: 544 (5.0%)
Sierra Leonean: 413 (3.8%)
Jamaican: 396 (3.7%)
Ghanaian: 288 (2.7%)
Iranian: 253 (2.3%)
American: 170 (1.6%)
Kenyan: 83 (0.8%)
Haitian: 83 (0.8%)
English: 60 (0.6%)
German: 50 (0.5%)
Italian: 47 (0.4%)
West Indian: 45 (0.4%)
Trinidadian and Tobagonian: 43 (0.4%)
Irish: 36 (0.3%)
Eastern European: 27 (0.2%)
Guyanese: 26 (0.2%)
Norwegian: 15 (0.1%)
Ethiopian: 13 (0.1%)
European: 12 (0.1%)
French Canadian: 12 (0.1%)
British West Indian: 10 (0.09%)
Scotch-Irish: 8 (0.07%)
Cape Verdean: 6 (0.06%) Most common places of birth for foreign-born residents (%): Nigeria Lake Arbor:
17.5% (563)Maryland:
4.6% (44,825)
Jamaica Lake Arbor:
16.0% (514)Maryland:
2.8% (27,444)
Cameroon Lake Arbor:
11.9% (384)Maryland:
2.5% (23,969)
Sierra Leone Lake Arbor:
10.2% (328)Maryland:
1.1% (10,233)
Ghana Lake Arbor:
6.5% (209)Maryland:
1.8% (17,774)
Iran Lake Arbor:
5.3% (171)Maryland:
1.3% (12,074)
West Indies Lake Arbor:
3.6% (115)Maryland:
0.1% (920)
Guyana Lake Arbor:
3.4% (109)Maryland:
0.8% (8,109)
Togo Lake Arbor:
2.2% (70)Maryland:
0.5% (4,901)
Kenya Lake Arbor:
2.1% (69)Maryland:
0.8% (7,497)
Tanzania Lake Arbor:
2.1% (69)Maryland:
0.1% (1,441)
Other Southern Africa Lake Arbor:
2.1% (68)Maryland:
0.0% (345)
Dominican Republic Lake Arbor:
1.9% (60)Maryland:
1.4% (13,947)
Trinidad and Tobago Lake Arbor:
1.9% (60)Maryland:
1.2% (11,481)
England Lake Arbor:
1.8% (58)Maryland:
0.6% (5,828)
Philippines Lake Arbor:
1.8% (58)Maryland:
3.8% (36,698)
El Salvador Lake Arbor:
1.7% (54)Maryland:
12.0% (115,412)
Panama Lake Arbor:
1.6% (51)Maryland:
0.3% (2,848)
Place of birth for U.S.-born residents:
This state: 4,052Other state: 7,165Northeast: 1,178Midwest: 492South: 5,113West: 388 82.8% of Lake Arbor residents lived in the same house 1 years ago.
Out of people who lived in different houses, 39.5% lived in this county.
Out of people who lived in different counties, 37.6% lived in Maryland.
Lake Arbor:
82.8%State average:
88.5%
Education attainment for males 25 years and older:
No schooling: 59Nursery to 4th grade: 05th and 6th grade: 07th and 8th grade: 09th grade: 010th grade: 1311th grade: 3612th grade, no diploma: 219High school graduate (or equivalency): 831Less than 1 year of college: 252Some college more than 1 year, no degree: 579Associate degree: 324Bachelor's degree: 1,577Master's degree: 955Professional school degree: 172Doctorate degree: 98
Education attainment for females 25 years and older:
No schooling: 49Nursery to 4th grade: 75th and 6th grade: 167th and 8th grade: 89th grade: 2510th grade: 011th grade: 5012th grade, no diploma: 15High school graduate (or equivalency): 894Less than 1 year of college: 377Some college more than 1 year, no degree: 797Associate degree: 303Bachelor's degree: 1,815Master's degree: 1,339Professional school degree: 215Doctorate degree: 342
Housing units in structures:
One, detached: 1,852One, attached: 2,149Two: 213 or 4: 1075 to 9: 16210 to 19: 81120 to 49: 24650 or more: 1,207Housing units lacking complete plumbing facilities in 2022: 0.1%House/condo owner moved in on average 12 years ago
Renter moved in on average 2 years ago
Private vs. public school enrollment:
Students in private schools in grades 1 to 8 (elementary and middle school): 265 Students in private schools in grades 9 to 12 (high school): 150 Students in private undergraduate colleges: 237