Ladson, SC (South Carolina) Houses and Residents
| Ladson: | $252,866 |
| South Carolina: | $254,600 |
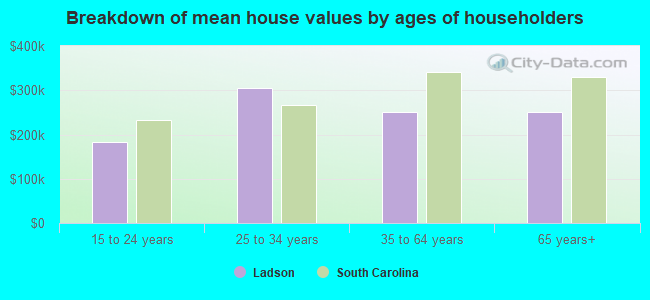
Mean price in 2022:
Detached houses: $242,205
Here: $242,205 State: $368,255 Townhouses or other attached units: $158,614
Here: $158,614 State: $292,023 Mobile homes: $59,713
Here: $59,713 State: $102,531
Total population: 13,790 (Urban population: 13,097, Rural population: 219 (all nonfarm))
Houses: 6,080 (5,594 occupied: 4,387 owner occupied, 1,265 renter occupied)
| % of renters here: | 22% |
| State: | 28% |
Housing density: 706 houses/condos per square mile
Median price asked for vacant for-sale houses and condos in 2022: $92,141.
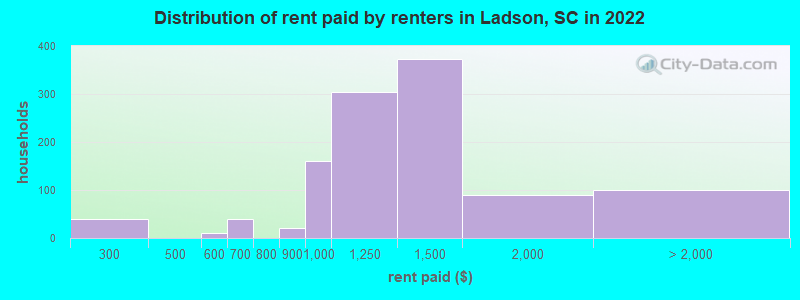
Median contract rent in 2022: $1,236 (lower quartile is $993, upper quartile is $1,440)
Median rent asked for vacant for-rent units in 2022: $601
Median gross rent in Ladson, SC in 2022: $1,417
Housing units in Ladson with a mortgage: 2,846 (178 second mortgage, 0 home equity loan, 60 both second mortgage and home equity loan)
Houses without a mortgage: 12
Median household income for houses/condos with a mortgage: $82,182
Median household income for apartments without a mortgage: $56,761
Median monthly housing costs: $1,234
Compare current foreclosures in Ladson, SC:
| Photo | Address | Area | Beds / Baths | Price | Details |
|---|---|---|---|---|---|

|
#1
Garwood Dr
Ladson, SC 29456
|
1,344 sq. feet
|
1 baths 3 beds |
show details | |

|
#2
Winged Elm St
Ladson, SC 29456
|
2,151 sq. feet
|
2 baths 4 beds |
show details | |

|
#3
Mickler Dr
Ladson, SC 29456
|
1,222 sq. feet
|
1 baths 3 beds |
show details | |

|
#4
Beverly Dr
Ladson, SC 29456
|
1,296 sq. feet
|
2 baths 3 beds |
show details | |

|
#5
Parlor Dr
Ladson, SC 29456
|
2,466 sq. feet
|
3 baths 3 beds |
show details | |

|
#6
Sweetbay Ct
Ladson, SC 29456
|
2,466 sq. feet
|
2 baths 3 beds |
show details | |

|
#7
Temple Rd # B
Ladson, SC 29456
|
1,084 sq. feet
|
4 baths 6 beds |
show details | |

|
#8
Parlor Dr
Ladson, SC 29456
|
2,617 sq. feet
|
3 baths 3 beds |
show details | |

|
#9
Parlor Dr
Ladson, SC 29456
|
2,617 sq. feet
|
3 baths 3 beds |
show details | |

|
#10
Scotch Pine Ln
Ladson, SC 29456
|
1,622 sq. feet
|
2 baths 3 beds |
show details |
| Photo | Address | Area | Beds / Baths | Price | Details |
|---|---|---|---|---|---|

|
#11
Two Pond Loop
Ladson, SC 29456
|
1,701 sq. feet
|
2 baths 3 beds |
show details | |

|
#12
Sandra Ln
Ladson, SC 29456
|
1,250 sq. feet
|
2 baths 3 beds |
show details | |

|
#13
Grand Oaks Dr
Ladson, SC 29456
|
1,685 sq. feet
|
2 baths 3 beds |
show details | |

|
#14
Parlor Dr
Ladson, SC 29456
|
2,466 sq. feet
|
3 baths 3 beds |
show details | |

|
#15
Barbara Dr
Ladson, SC 29456
|
1,631 sq. feet
|
2 baths 3 beds |
show details | |

|
#16
Jenwood St
Ladson, SC 29456
|
1,340 sq. feet
|
1 baths 3 beds |
show details | |

|
#17
Jenwood St
Ladson, SC 29456
|
1,260 sq. feet
|
1 baths 3 beds |
show details | |

|
#18
Mildred Ln
Ladson, SC 29456
|
1,235 sq. feet
|
2 baths 3 beds |
show details | |

|
#19
Hummingbird Ave
Ladson, SC 29456
|
1,336 sq. feet
|
2 baths 3 beds |
show details | |

|
#20
Parlor Dr
Ladson, SC 29456
|
2,617 sq. feet
|
3 baths 3 beds |
show details |
| Photo | Address | Area | Beds / Baths | Price | Details |
|---|---|---|---|---|---|

|
#21
Temple Rd
Ladson, SC 29456
|
1,016 sq. feet
|
2 baths 3 beds |
show details | |

|
#22
Peatwood Dr
Ladson, SC 29456
|
1,044 sq. feet
|
1 baths 3 beds |
show details | |

|
#23
Tall Pines Rd
Ladson, SC 29456
|
1,593 sq. feet
|
2 baths 3 beds |
show details | |

|
#24
Torch Pines Rd
Ladson, SC 29456
|
1,269 sq. feet
|
2 baths 3 beds |
show details | |

|
#25
Outwood Dr
Ladson, SC 29456
|
1,040 sq. feet
|
1 baths 3 beds |
show details | |

|
#26
Temple Rd
Ladson, SC 29456
|
1,174 sq. feet
|
2 baths 3 beds |
show details | |

|
#27
Atlanta Rd
Ladson, SC 29456
|
1,260 sq. feet
|
2 baths - beds |
show details | |

|
#28
Garwood Dr
Ladson, SC 29456
|
1,521 sq. feet
|
1 baths 4 beds |
show details | |

|
#29
Garwood Dr
Ladson, SC 29456
|
1,344 sq. feet
|
1 baths 3 beds |
show details | |

|
#30
Mickler Dr
Ladson, SC 29456
|
1,293 sq. feet
|
1 baths - beds |
show details |
| Photo | Address | Area | Beds / Baths | Price | Details |
|---|---|---|---|---|---|

|
#31
Mickler Dr
Ladson, SC 29456
|
1,211 sq. feet
|
2 baths - beds |
show details | |

|
#32
Ponderosa Dr
Ladson, SC 29456
|
1,854 sq. feet
|
- baths - beds |
show details | |

|
#33
Briar Rose Ln
Ladson, SC 29456
|
1,360 sq. feet
|
- baths - beds |
show details | |

|
#34
Columbia Dr
Ladson, SC 29456
|
1,230 sq. feet
|
- baths - beds |
show details | |

|
#35
Seed St
Ladson, SC 29456
|
- sq. feet
|
- baths - beds |
show details | |

|
#36
Highway 78 Bldg 700
Ladson, SC 29456
|
- sq. feet
|
- baths - beds |
show details | |

|
#37
Friartuck Trl
Ladson, SC 29456
|
1,364 sq. feet
|
- baths - beds |
show details | |

|
#38
Sanborll Landing Dr
Ladson, SC 29456
|
- sq. feet
|
- baths - beds |
show details | |

|
#39
Palmetto Commerce Pkwy # 1505
Ladson, SC 29456
|
- sq. feet
|
- baths - beds |
show details | |

|
#40
Old Fort Dr
Ladson, SC 29456
|
- sq. feet
|
- baths - beds |
show details |
| Photo | Address | Area | Beds / Baths | Price | Details |
|---|---|---|---|---|---|

|
#41
Maimi Dr, Lot 91
Ladson, SC 29456
|
- sq. feet
|
- baths - beds |
show details | |

|
#42
Haymont Ln
Ladson, SC 29456
|
- sq. feet
|
- baths - beds |
show details | |

|
#43
Coopers Ridge Blvd Apt 305
Ladson, SC 29456
|
- sq. feet
|
- baths - beds |
show details | |

|
#44
Blue House Rd Apt 5204
Ladson, SC 29456
|
- sq. feet
|
- baths - beds |
show details | |

|
#45
Cornell Dr
Ladson, SC 29456
|
1,120 sq. feet
|
- baths - beds |
show details | |

|
#46
Arnold Dr
Ladson, SC 29456
|
- sq. feet
|
- baths - beds |
show details | |

|
#47
Shortleaf Pine Dr
Ladson, SC 29456
|
- sq. feet
|
- baths - beds |
show details | |

|
#48
Furman Ln
Ladson, SC 29456
|
1,020 sq. feet
|
- baths - beds |
show details | |

|
#49
Blue House Rd
Ladson, SC 29456
|
- sq. feet
|
- baths - beds |
show details | |

|
Check over 1 million property listings on Foreclosure.com!
|
browse all offers | |||

Latest news about housing in Ladson, SC collected exclusively by city-data.com from local newspapers, TV, and radio stations

 | Apartments (1 reply) |
| Looking for Age 55+ Condo or Apartment (3 replies) |
| Recommended townhome/apartment complex for couple with 2 year old son (16 replies) |
| Charleston County the least affordable real estate market in the state, but.... (5 replies) |
| Apartments Off of 78 (14 replies) |
| Home inspector and painter / handyman recommendation (3 replies) |

Median year apartment built: 1986
Household type by relationship:
Households: 15,650- Male householders: 2,685 (826 living alone), Female householders: 2,847 (687 living alone)
2,221 spouses (2,209 opposite-sex spouses), 398 unmarried partners, (398 opposite-sex unmarried partners), 5,310 children (4,743 natural, 164 adopted, 402 stepchildren), 460 grandchildren, 279 brothers or sisters, 390 parents, 0 foster children, 498 other relatives, 538 non-relatives
- In group quarters: 20
Size of family households: 1,452 2-persons, 665 3-persons, 875 4-persons, 316 5-persons, 136 6-persons, 230 7-or-more-persons.
Size of nonfamily households: 1,605 1-person, 349 2-persons, 22 3-persons, 9 4-persons.
2,753 married couples with children.
1,206 single-parent households (567 men, 639 women).
86.8% of residents of Ladson speak English at home.
7.4% of residents speak Spanish at home (42% speak English very well, 33% speak English well, 19% speak English not well, 6% don't speak English at all).
1.2% of residents speak other Indo-European language at home (64% speak English very well, 17% speak English well, 19% speak English not well).
2.8% of residents speak Asian or Pacific Island language at home (55% speak English very well, 19% speak English well, 26% speak English not well).
0.7% of residents speak other language at home (100% speak English very well).
Foreign born population: 1,181 (7.5%)
(55.1% of them are naturalized citizens)
| Here: | 6.4 |
| State: | 6.4 |
| Here: | 5.1 |
| State: | 4.5 |
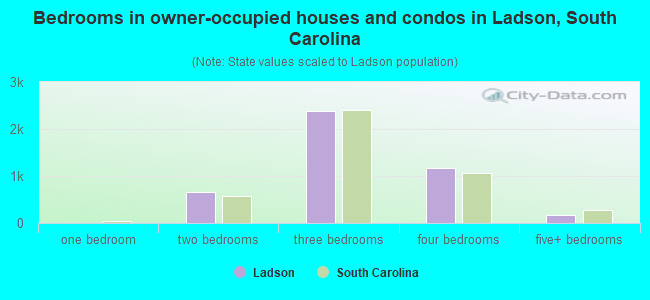
- Bedrooms in owner-occupied houses and condos in Ladson, South Carolina
- 0no bedroom
- 01 bedroom
- 6602 bedrooms
- 2,3923 bedrooms
- 1,1714 bedrooms
- 1655+ bedrooms
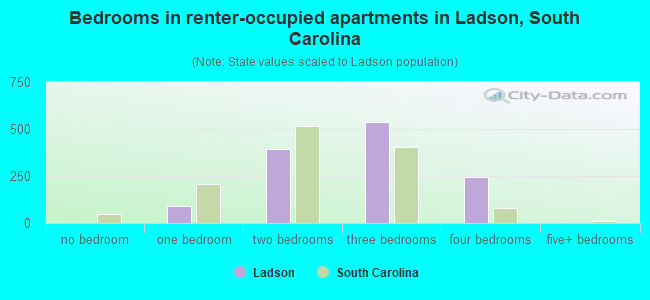
- Bedrooms in renter-occupied apartments in Ladson, South Carolina
- 0no bedroom
- 931 bedroom
- 3932 bedrooms
- 5363 bedrooms
- 2444 bedrooms
- 05+ bedrooms
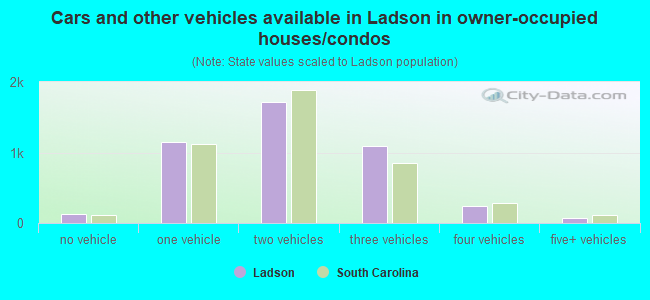
- Cars and other vehicles available in Ladson in owner-occupied houses/condos
- 128no vehicle
- 1,1431 vehicle
- 1,7202 vehicles
- 1,0943 vehicles
- 2404 vehicles
- 645+ vehicles
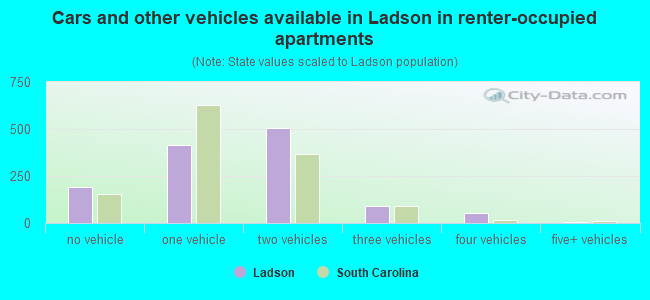
- Cars and other vehicles available in Ladson in renter-occupied apartments
- 194no vehicle
- 4141 vehicle
- 5072 vehicles
- 903 vehicles
- 554 vehicles
- 55+ vehicles
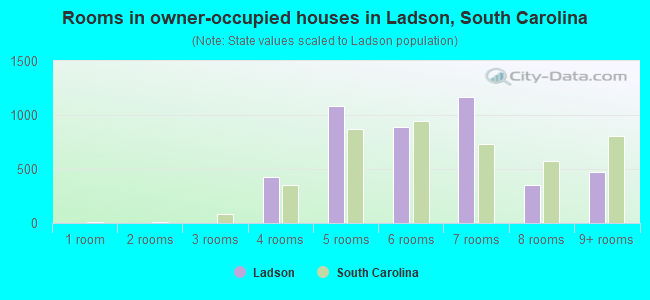
- Rooms in owner-occupied houses in Ladson, South Carolina
- 01 room
- 02 rooms
- 03 rooms
- 4224 rooms
- 1,0835 rooms
- 8856 rooms
- 1,1707 rooms
- 3528 rooms
- 4759+ rooms
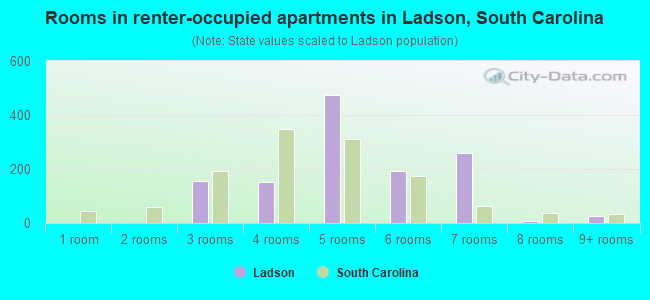
- Rooms in renter-occupied apartments in Ladson, South Carolina
- 01 room
- 02 rooms
- 1553 rooms
- 1514 rooms
- 4745 rooms
- 1936 rooms
- 2587 rooms
- 88 rooms
- 279+ rooms
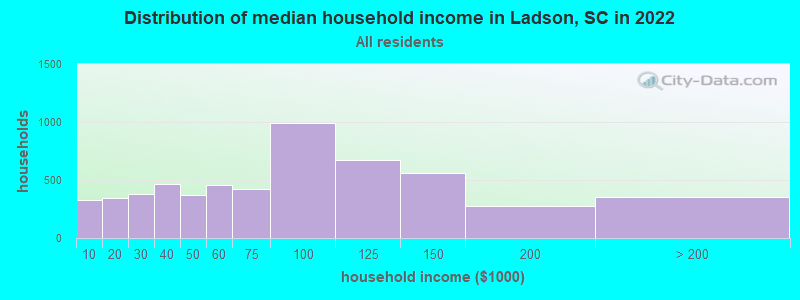
Ladson, SC household income distribution

- 329Less than $10,000
- 344$10,000 to $19,999
- 381$20,000 to $29,999
- 463$30,000 to $39,999
- 372$40,000 to $49,999
- 458$50,000 to $59,999
- 419$60,000 to $74,999
- 992$75,000 to $99,999
- 670$100,000 to $124,999
- 564$125,000 to $149,999
- 278$150,000 to $199,999
- 357$200,000 or more
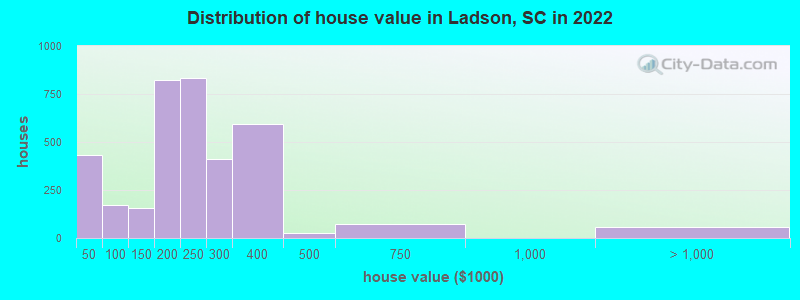
Home value of owner - occupied houses in 2022 in Ladson, SC
-
- 19Less than $10,000
- 151$10,000 to $14,999
- 48$15,000 to $19,999
- 34$20,000 to $24,999
- 62$25,000 to $29,999
- 36$30,000 to $34,999
- 80$40,000 to $49,999
- 27$50,000 to $59,999
- 23$70,000 to $79,999
- 26$80,000 to $89,999
- 14$90,000 to $99,999
- 109$100,000 to $124,999
- 46$125,000 to $149,999
- 550$150,000 to $174,999
- 272$175,000 to $199,999
- 835$200,000 to $249,999
- 410$250,000 to $299,999
- 592$300,000 to $399,999
- 28$400,000 to $499,999
- 72$500,000 to $749,999
- 15$1,000,000 to $1,499,999
- 44$1,500,000 to $1,999,999
Rent paid by renters in 2022 in Ladson, SC
-
- 39$200 to $249
- 10$550 to $599
- 40$600 to $649
- 19$800 to $899
- 161$900 to $999
- 303$1,000 to $1,249
- 371$1,250 to $1,499
- 89$1,500 to $1,999
- 65$2,000 to $2,499
- 32No cash rent
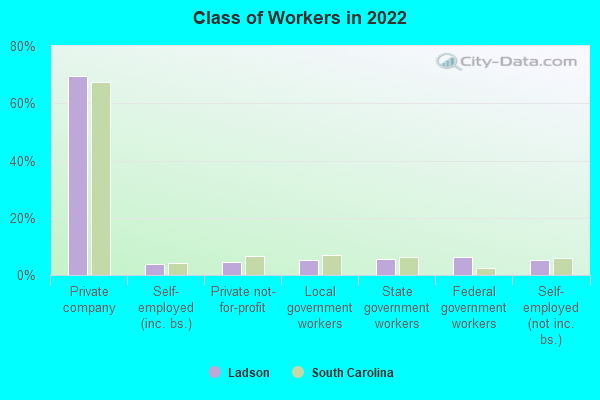
Percentage of workers working in this county: 43.6%
Number of people working at home: 427 (6.1% of all workers)
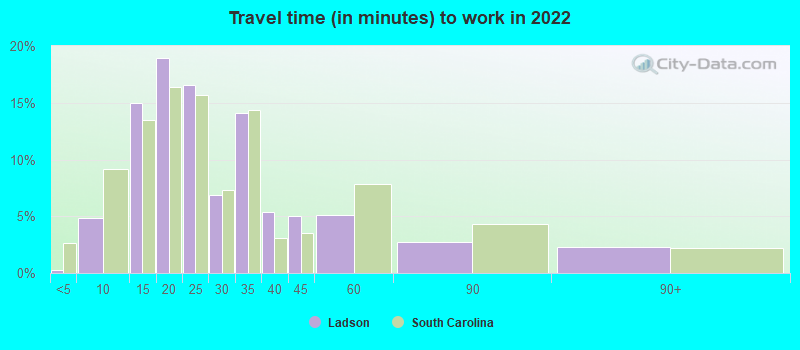
Travel time to work (commute)
- Less than 5 minutes: 22
- 5 to 9 minutes: 380
- 10 to 14 minutes: 616
- 15 to 19 minutes: 772
- 20 to 24 minutes: 797
- 25 to 29 minutes: 379
- 30 to 34 minutes: 1,677
- 35 to 39 minutes: 171
- 40 to 44 minutes: 122
- 45 to 59 minutes: 879
- 60 to 89 minutes: 406
- 90 or more minutes: 163
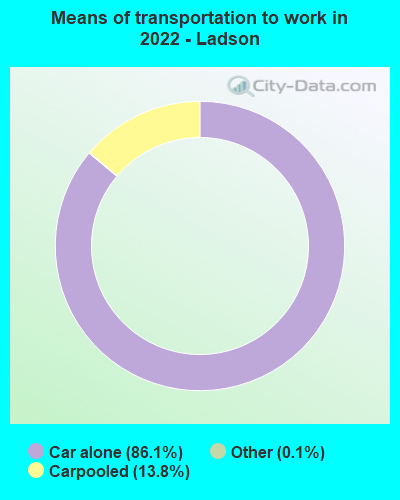
Means of transportation to work:
- Drove a car alone: 2,876 (75.0%)
- Carpooled: 523 (13.6%)
- Taxi: 3 (0.1%)
- Worked at home: 427 (11.1%)
- Unemployment by race in 2022
- Unemployment rate for White non-Hispanic residents
- 2.3%Males
- 3.4%Females
- Unemployment rate for Black residents
- 7.6%Males
- 15.4%Females
- Unemployment rate for other race residents
- 26.5%Females
- Unemployment rate for Hispanic or Latino residents
- 17.5%Females
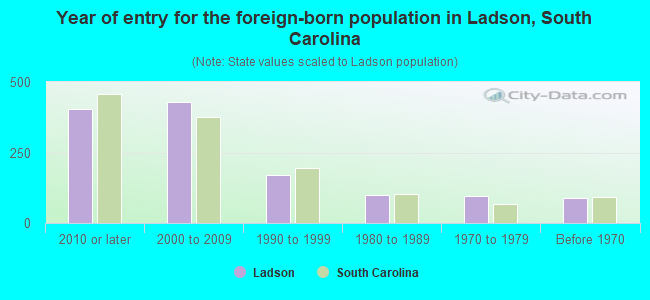
- Year of entry for the foreign-born population in Ladson, South Carolina
- 4052010 or later
- 4302000 to 2009
- 1711990 to 1999
- 1001980 to 1989
- 971970 to 1979
- 89Before 1970
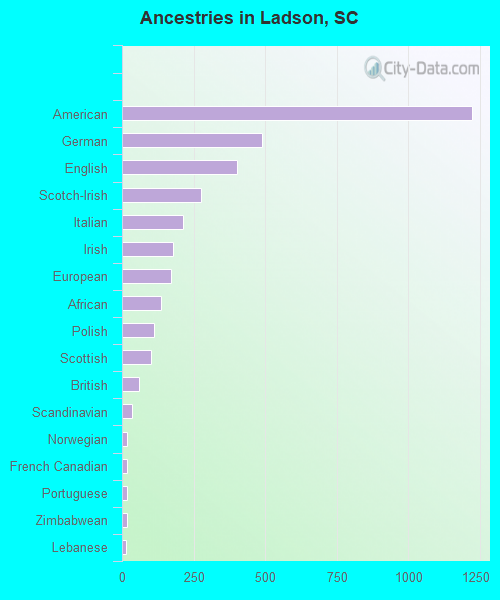
First ancestries reported:
- American: 1,222 (14.4%)
- German: 491 (5.8%)
- English: 401 (4.7%)
- Scotch-Irish: 277 (3.3%)
- Italian: 215 (2.5%)
- Irish: 177 (2.1%)
- European: 171 (2.0%)
- African: 138 (1.6%)
- Polish: 111 (1.3%)
- Scottish: 103 (1.2%)
- British: 58 (0.7%)
- Scandinavian: 36 (0.4%)
- Norwegian: 18 (0.2%)
- French Canadian: 17 (0.2%)
- Portuguese: 16 (0.2%)
- Zimbabwean: 16 (0.2%)
- Lebanese: 15 (0.2%)
- Russian: 9 (0.1%)
- Northern European: 4 (0.05%)
Most common places of birth for foreign-born residents (%):
| Ladson: | 32.0% (383) |
| South Carolina: | 4.1% (11,031) |
| Ladson: | 16.3% (195) |
| South Carolina: | 22.5% (60,774) |
| Ladson: | 13.1% (157) |
| South Carolina: | 3.7% (9,982) |
| Ladson: | 10.9% (131) |
| South Carolina: | 0.5% (1,298) |
| Ladson: | 6.4% (77) |
| South Carolina: | 0.2% (628) |
| Ladson: | 5.3% (63) |
| South Carolina: | 1.1% (2,998) |
| Ladson: | 2.3% (28) |
| South Carolina: | 0.7% (1,840) |
| Ladson: | 2.0% (24) |
| South Carolina: | 0.4% (959) |
| Ladson: | 1.9% (23) |
| South Carolina: | 4.8% (12,834) |
| Ladson: | 1.8% (22) |
| South Carolina: | 0.6% (1,691) |
| Ladson: | 1.7% (20) |
| South Carolina: | 1.7% (4,513) |
Place of birth for U.S.-born residents:
- This state: 7,885
- Other state: 6,402
- Northeast: 1,538
- Midwest: 1,501
- South: 2,425
- West: 989
85.6% of Ladson residents lived in the same house 1 years ago.
Out of people who lived in different houses, 30.8% lived in this county.
Out of people who lived in different counties, 43.7% lived in South Carolina.
| Ladson: | 85.6% |
| State average: | 86.5% |
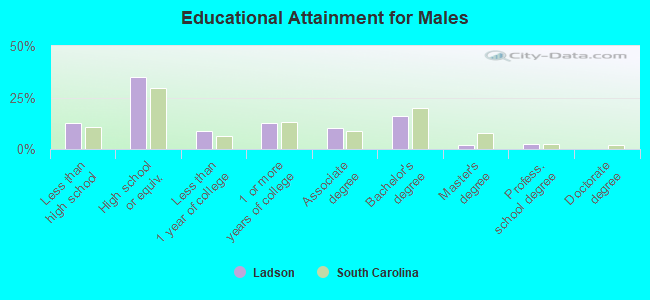
Education attainment for males 25 years and older:
- No schooling: 65
- Nursery to 4th grade: 12
- 5th and 6th grade: 71
- 7th and 8th grade: 48
- 9th grade: 0
- 10th grade: 14
- 11th grade: 182
- 12th grade, no diploma: 214
- High school graduate (or equivalency): 1,662
- Less than 1 year of college: 421
- Some college more than 1 year, no degree: 606
- Associate degree: 475
- Bachelor's degree: 765
- Master's degree: 101
- Professional school degree: 112
- Doctorate degree: 0
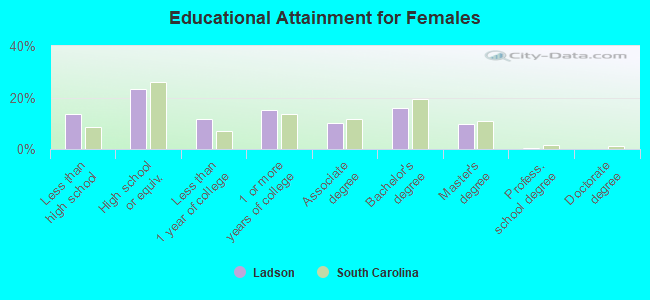
Education attainment for females 25 years and older:
- No schooling: 89
- Nursery to 4th grade: 0
- 5th and 6th grade: 26
- 7th and 8th grade: 93
- 9th grade: 45
- 10th grade: 151
- 11th grade: 97
- 12th grade, no diploma: 154
- High school graduate (or equivalency): 1,114
- Less than 1 year of college: 560
- Some college more than 1 year, no degree: 727
- Associate degree: 491
- Bachelor's degree: 755
- Master's degree: 466
- Professional school degree: 13
- Doctorate degree: 0


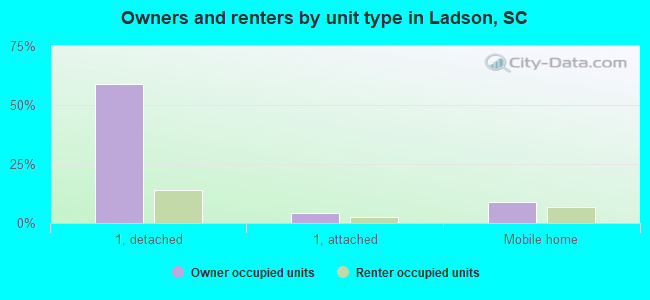
Housing units in structures:
- One, detached: 4,456
- One, attached: 218
- Two: 76
- 3 or 4: 36
- 5 to 9: 24
- 10 to 19: 116
- 50 or more: 16
- Mobile homes: 1,133
Median worth of mobile homes: $60,707
Housing units lacking complete kitchen facilities in 2022: 0.3%
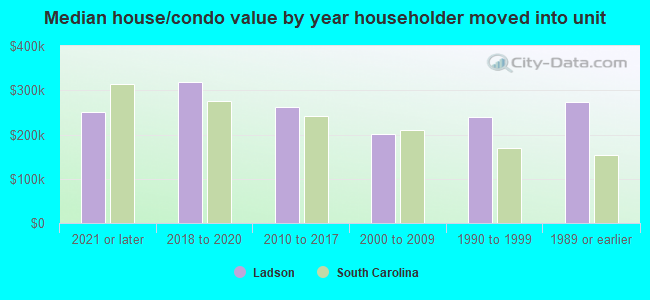
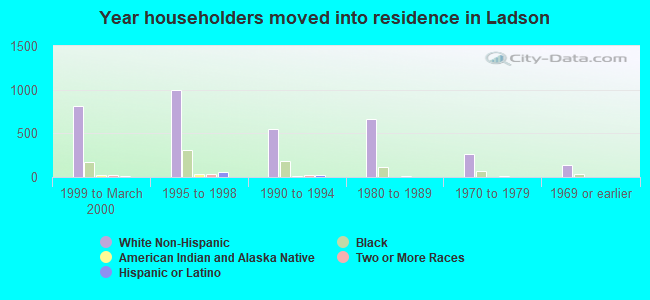
House/condo owner moved in on average 8 years ago
Renter moved in on average 3 years ago
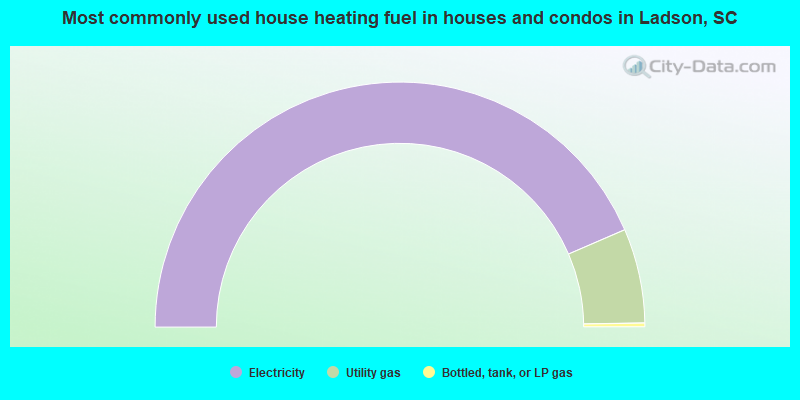
- 87.1%Electricity
- 12.5%Utility gas
- 0.5%Bottled, tank, or LP gas
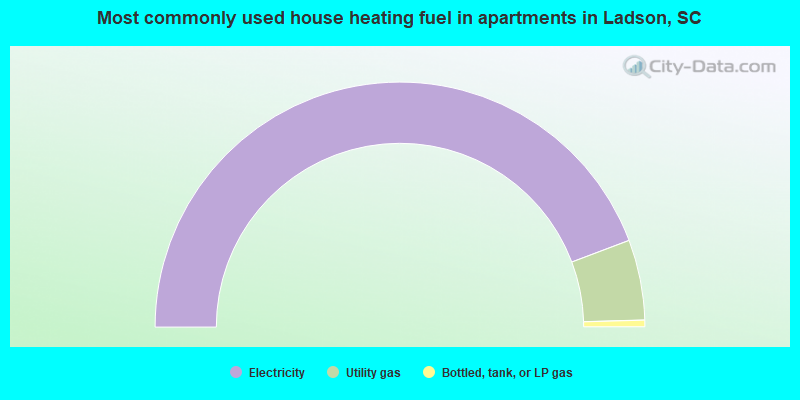
- 88.5%Electricity
- 10.6%Utility gas
- 0.9%Bottled, tank, or LP gas
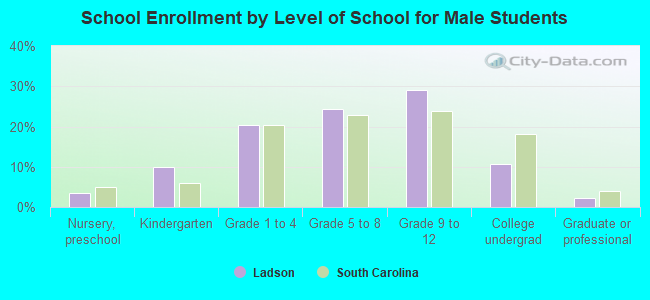
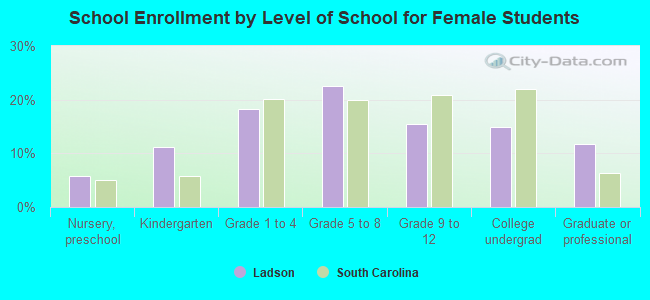
Private vs. public school enrollment:
| Here: | 2.5% |
| South Carolina: | 14.4% |
| Here: | 20.5% |
| South Carolina: | 11.1% |
| Here: | 29.8% |
| South Carolina: | 21.9% |