Kissimmee, FL (Florida) Houses and Residents
| Kissimmee: | $288,400 |
| Florida: | $354,100 |
Mean price in 2022:
Detached houses: $298,596
Here: $298,596 State: $500,941 Townhouses or other attached units: $210,860
Here: $210,860 State: $370,869 In 2-unit structures: $401,148
Here: $401,148 State: $423,188 In 3-to-4-unit structures: $145,089
Here: $145,089 State: $309,944 In 5-or-more-unit structures: $148,434
Here: $148,434 State: $447,145 Mobile homes: $154,553
Here: $154,553 State: $113,202
Total population: 66,722 (Urban population: 47,405, Rural population: 153 (all nonfarm))
Houses: 32,754 (29,541 occupied: 13,215 owner occupied, 16,326 renter occupied)
| % of renters here: | 55% |
| State: | 33% |
Housing density: 1,964 houses/condos per square mile
Median price asked for vacant for-sale houses and condos in 2022: $195,936.
Median contract rent in 2022: $1,238 (lower quartile is $972, upper quartile is $1,733)
Median rent asked for vacant for-rent units in 2022: $1,765
Median gross rent in Kissimmee, FL in 2022: $1,471
Housing units in Kissimmee with a mortgage: 8,795 (517 second mortgage, 0 home equity loan, 300 both second mortgage and home equity loan)
Houses without a mortgage: 213
Median household income for houses/condos with a mortgage: $85,620
Median household income for apartments without a mortgage: $37,518
Median monthly housing costs: $1,351
Compare current foreclosures in Kissimmee, FL:
| Photo | Address | Area | Beds / Baths | Price | Details |
|---|---|---|---|---|---|

|
#1
Lido Key Dr
Kissimmee, FL 34747
|
2,883 sq. feet
|
5 baths 7 beds |
show details | |

|
#2
Rivkin Dr
Kissimmee, FL 34758
|
2,025 sq. feet
|
2 baths 4 beds |
show details | |

|
#3
Picardy Dr
Kissimmee, FL 34759
|
1,861 sq. feet
|
2 baths 3 beds |
show details | |

|
#4
Blanc Ct
Kissimmee, FL 34759
|
1,825 sq. feet
|
2 baths 4 beds |
show details | |

|
#5
Dunmore Ln
Kissimmee, FL 34746
|
1,964 sq. feet
|
2 baths 4 beds |
show details | |

|
#6
Barrington Dr
Kissimmee, FL 34758
|
1,382 sq. feet
|
2 baths 3 beds |
show details | |

|
#7
Veterans Dr
Kissimmee, FL 34744
|
1,668 sq. feet
|
2 baths 3 beds |
show details | |

|
#8
Stone Creek Trl
Kissimmee, FL 34747
|
1,848 sq. feet
|
3 baths 3 beds |
show details | |

|
#9
Alberto Cir
Kissimmee, FL 34746
|
1,636 sq. feet
|
3 baths 4 beds |
show details | |

|
#10
Maple Dr
Kissimmee, FL 34759
|
1,264 sq. feet
|
2 baths 3 beds |
show details |
| Photo | Address | Area | Beds / Baths | Price | Details |
|---|---|---|---|---|---|

|
#11
Alencon Way
Kissimmee, FL 34759
|
2,196 sq. feet
|
2 baths 4 beds |
show details | |

|
#12
Del Prado Dr
Kissimmee, FL 34758
|
1,523 sq. feet
|
2 baths 3 beds |
show details | |

|
#13
Putt Ln
Kissimmee, FL 34759
|
1,432 sq. feet
|
2 baths 3 beds |
show details | |

|
#14
Eagle Bay Blvd
Kissimmee, FL 34743
|
1,843 sq. feet
|
2 baths 4 beds |
show details | |

|
#15
Nelson Park Ct
Kissimmee, FL 34759
|
2,094 sq. feet
|
2 baths 3 beds |
show details | |

|
#16
Commander Way
Kissimmee, FL 34746
|
2,382 sq. feet
|
4 baths 4 beds |
show details | |

|
#17
Cordona Dr Apt G
Kissimmee, FL 34758
|
1,270 sq. feet
|
3 baths 2 beds |
show details | |

|
#18
Mesilla Dr
Kissimmee, FL 34758
|
1,514 sq. feet
|
2 baths 3 beds |
show details | |

|
#19
Partin Terrace Rd
Kissimmee, FL 34744
|
2,674 sq. feet
|
3 baths 5 beds |
show details | |

|
#20
Oak Branch Cir
Kissimmee, FL 34758
|
1,854 sq. feet
|
2 baths 3 beds |
show details |
| Photo | Address | Area | Beds / Baths | Price | Details |
|---|---|---|---|---|---|

|
#21
Eagle Ridge Loop
Kissimmee, FL 34746
|
1,694 sq. feet
|
2 baths 3 beds |
show details | |

|
#22
Ridgeway Dr
Kissimmee, FL 34746
|
2,380 sq. feet
|
3 baths 4 beds |
show details | |

|
#23
Chapala Dr
Kissimmee, FL 34746
|
3,053 sq. feet
|
3 baths 4 beds |
show details | |

|
#24
Brockridge Rd
Kissimmee, FL 34744
|
2,674 sq. feet
|
3 baths 5 beds |
show details | |

|
#25
Hunley Loop
Kissimmee, FL 34743
|
2,236 sq. feet
|
2 baths 4 beds |
show details | |

|
#26
Maple Chase Trl
Kissimmee, FL 34758
|
2,847 sq. feet
|
3 baths 4 beds |
show details | |

|
#27
Koala Ct
Kissimmee, FL 34759
|
1,422 sq. feet
|
2 baths 3 beds |
show details | |

|
#28
Snook Way
Kissimmee, FL 34759
|
2,811 sq. feet
|
2 baths 4 beds |
show details | |

|
#29
S Delmonte Ct
Kissimmee, FL 34758
|
2,102 sq. feet
|
3 baths 4 beds |
show details | |

|
#30
Cambourne Dr
Kissimmee, FL 34758
|
2,166 sq. feet
|
3 baths 4 beds |
show details |
| Photo | Address | Area | Beds / Baths | Price | Details |
|---|---|---|---|---|---|

|
#31
Southbury Dr
Kissimmee, FL 34744
|
1,569 sq. feet
|
3 baths 3 beds |
show details | |

|
#32
Banbridge Dr
Kissimmee, FL 34758
|
2,384 sq. feet
|
3 baths 4 beds |
show details | |

|
#33
Aldershot Ct
Kissimmee, FL 34758
|
2,847 sq. feet
|
3 baths 4 beds |
show details | |

|
#34
E Flag Ln
Kissimmee, FL 34759
|
1,850 sq. feet
|
2 baths 3 beds |
show details | |

|
#35
Chadworth Dr
Kissimmee, FL 34758
|
1,564 sq. feet
|
2 baths 3 beds |
show details | |

|
#36
Acacia Tree Way
Kissimmee, FL 34758
|
1,876 sq. feet
|
2 baths 3 beds |
show details | |

|
#37
Roan Ct
Kissimmee, FL 34759
|
1,744 sq. feet
|
2 baths 3 beds |
show details | |

|
#38
Pinehurst Cv
Kissimmee, FL 34758
|
2,697 sq. feet
|
3 baths 4 beds |
show details | |

|
#39
Brockton Dr
Kissimmee, FL 34758
|
1,456 sq. feet
|
2 baths 3 beds |
show details | |

|
#40
Bay Brook Dr
Kissimmee, FL 34746
|
1,609 sq. feet
|
2 baths 4 beds |
show details |
| Photo | Address | Area | Beds / Baths | Price | Details |
|---|---|---|---|---|---|

|
#41
Tawny Ridge Rd
Kissimmee, FL 34744
|
2,674 sq. feet
|
3 baths 5 beds |
show details | |

|
#42
Heliotrope Loop
Kissimmee, FL 34746
|
3,707 sq. feet
|
3 baths 5 beds |
show details | |

|
#43
Miami Ln
Kissimmee, FL 34759
|
1,933 sq. feet
|
2 baths 3 beds |
show details | |

|
#44
Laparelle Dr
Kissimmee, FL 34746
|
2,190 sq. feet
|
3 baths 4 beds |
show details | |

|
#45
Sunshine Ridge Loop
Kissimmee, FL 34747
|
4,363 sq. feet
|
7 baths 9 beds |
show details | |

|
#46
Drifting Lilly Loop
Kissimmee, FL 34747
|
1,852 sq. feet
|
2 baths 3 beds |
show details | |

|
#47
Sage Dr
Kissimmee, FL 34758
|
2,165 sq. feet
|
2 baths 3 beds |
show details | |

|
#48
Abbotsbury Dr
Kissimmee, FL 34758
|
2,847 sq. feet
|
3 baths 4 beds |
show details | |

|
#49
Hacienda Cir
Kissimmee, FL 34741
|
2,295 sq. feet
|
3 baths 4 beds |
show details | |

|
Check over 1 million property listings on Foreclosure.com!
|
browse all offers | |||

Latest news about housing in Kissimmee, FL collected exclusively by city-data.com from local newspapers, TV, and radio stations

 | Windermere Rentals (apts, condos, houses) (2 replies) |
| kissimmee houses for rent (12 replies) |
| The Loop Apartments in Kissimmee (6 replies) |
| Apartments near WDW-blind rental (0 replies) |
| Kissimmee? (12 replies) |
| Apartments around Orlando (2 replies) |

Median year apartment built: 1994
Household type by relationship:
Households: 80,009- Male householders: 14,783 (5,198 living alone), Female householders: 14,758 (3,442 living alone)
10,619 spouses (10,619 opposite-sex spouses), 1,930 unmarried partners, (1,796 opposite-sex unmarried partners), 23,911 children (22,376 natural, 767 adopted, 768 stepchildren), 2,512 grandchildren, 1,912 brothers or sisters, 2,816 parents, 0 foster children, 3,386 other relatives, 2,567 non-relatives
- In group quarters: 815
Size of family households: 4,744 2-persons, 6,412 3-persons, 5,067 4-persons, 2,286 5-persons, 976 6-persons, 199 7-or-more-persons.
Size of nonfamily households: 8,640 1-person, 1,111 2-persons, 34 3-persons, 72 5-persons.
8,803 married couples with children.
6,119 single-parent households (657 men, 5,462 women).
30.7% of residents of Kissimmee speak English at home.
63.0% of residents speak Spanish at home (57% speak English very well, 20% speak English well, 13% speak English not well, 9% don't speak English at all).
3.4% of residents speak other Indo-European language at home (64% speak English very well, 29% speak English well, 7% speak English not well).
1.5% of residents speak Asian or Pacific Island language at home (81% speak English very well, 13% speak English well, 4% speak English not well, 2% don't speak English at all).
1.8% of residents speak other language at home (62% speak English very well, 20% speak English well, 17% speak English not well).
Foreign born population: 33,638 (42.0%)
(38.7% of them are naturalized citizens)
| Here: | 6.0 |
| State: | 5.9 |
| Here: | 4.0 |
| State: | 4.2 |

- Bedrooms in owner-occupied houses and condos in Kissimmee, Florida
- 42no bedroom
- 1101 bedroom
- 1,4272 bedrooms
- 7,7853 bedrooms
- 3,6734 bedrooms
- 1785+ bedrooms

- Bedrooms in renter-occupied apartments in Kissimmee, Florida
- 977no bedroom
- 2,7801 bedroom
- 6,2312 bedrooms
- 3,5793 bedrooms
- 2,6664 bedrooms
- 935+ bedrooms

- Cars and other vehicles available in Kissimmee in owner-occupied houses/condos
- 596no vehicle
- 3,4541 vehicle
- 5,8302 vehicles
- 2,3753 vehicles
- 7354 vehicles
- 2255+ vehicles

- Cars and other vehicles available in Kissimmee in renter-occupied apartments
- 1,989no vehicle
- 7,0101 vehicle
- 5,7722 vehicles
- 1,5553 vehicles
- 04 vehicles
- 05+ vehicles

- Rooms in owner-occupied houses in Kissimmee, Florida
- 421 room
- 02 rooms
- 4003 rooms
- 1,3694 rooms
- 2,5255 rooms
- 4,7166 rooms
- 1,9757 rooms
- 1,5888 rooms
- 6009+ rooms

- Rooms in renter-occupied apartments in Kissimmee, Florida
- 9771 room
- 1,2022 rooms
- 3,7603 rooms
- 4,4904 rooms
- 2,9055 rooms
- 1,7456 rooms
- 7277 rooms
- 4088 rooms
- 1129+ rooms


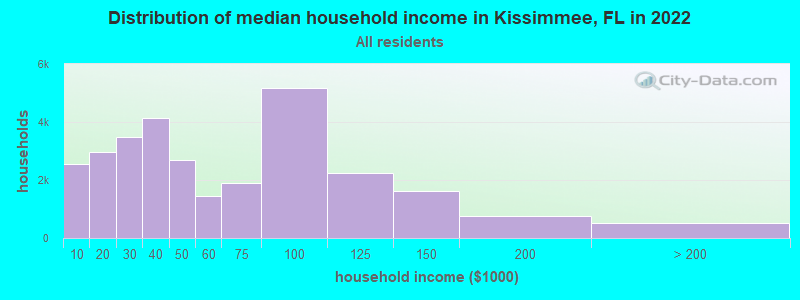
Kissimmee, FL household income distribution

- 2,542Less than $10,000
- 2,973$10,000 to $19,999
- 3,498$20,000 to $29,999
- 4,154$30,000 to $39,999
- 2,694$40,000 to $49,999
- 1,452$50,000 to $59,999
- 1,911$60,000 to $74,999
- 5,157$75,000 to $99,999
- 2,252$100,000 to $124,999
- 1,613$125,000 to $149,999
- 773$150,000 to $199,999
- 522$200,000 or more
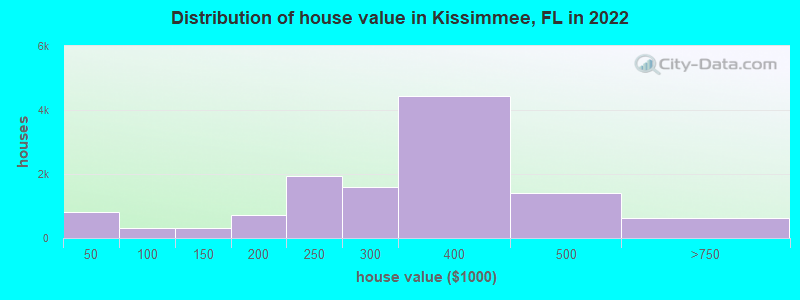
Home value of owner - occupied houses in 2022 in Kissimmee, FL
-
- 503Less than $10,000
- 26$10,000 to $14,999
- 74$15,000 to $19,999
- 100$20,000 to $24,999
- 48$25,000 to $29,999
- 10$30,000 to $34,999
- 20$35,000 to $39,999
- 20$40,000 to $49,999
- 30$50,000 to $59,999
- 9$60,000 to $69,999
- 230$80,000 to $89,999
- 29$90,000 to $99,999
- 135$100,000 to $124,999
- 192$125,000 to $149,999
- 318$150,000 to $174,999
- 388$175,000 to $199,999
- 1,921$200,000 to $249,999
- 1,589$250,000 to $299,999
- 4,433$300,000 to $399,999
- 1,416$400,000 to $499,999
- 576$500,000 to $749,999
- 26$1,000,000 to $1,499,999
- 17$2,000,000 or more
Rent paid by renters in 2022 in Kissimmee, FL
-
- 204$100 to $149
- 22$150 to $199
- 177$200 to $249
- 39$250 to $299
- 29$300 to $349
- 30$350 to $399
- 15$400 to $449
- 30$450 to $499
- 69$500 to $549
- 108$550 to $599
- 135$600 to $649
- 113$650 to $699
- 248$700 to $749
- 295$750 to $799
- 1,105$800 to $899
- 987$900 to $999
- 2,284$1,000 to $1,249
- 2,843$1,250 to $1,499
- 3,309$1,500 to $1,999
- 533$2,000 to $2,499
- 243No cash rent


Percentage of workers working in this county: 48.0%
Number of people working at home: 3,803 (9.4% of all workers)
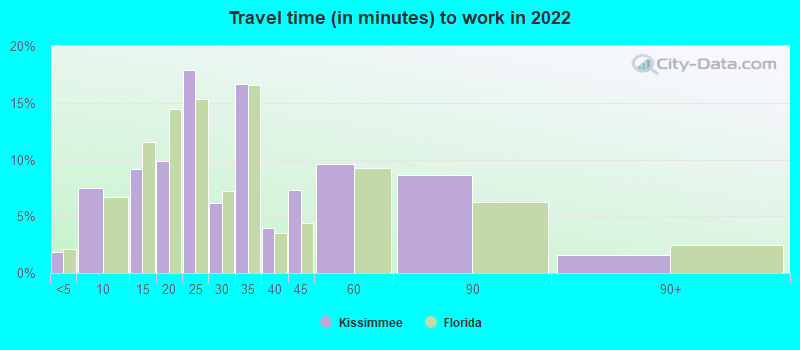
Travel time to work (commute)
- Less than 5 minutes: 0
- 5 to 9 minutes: 2,400
- 10 to 14 minutes: 1,161
- 15 to 19 minutes: 3,880
- 20 to 24 minutes: 3,066
- 25 to 29 minutes: 2,797
- 30 to 34 minutes: 8,913
- 35 to 39 minutes: 1,139
- 40 to 44 minutes: 3,140
- 45 to 59 minutes: 3,437
- 60 to 89 minutes: 4,567
- 90 or more minutes: 1,042
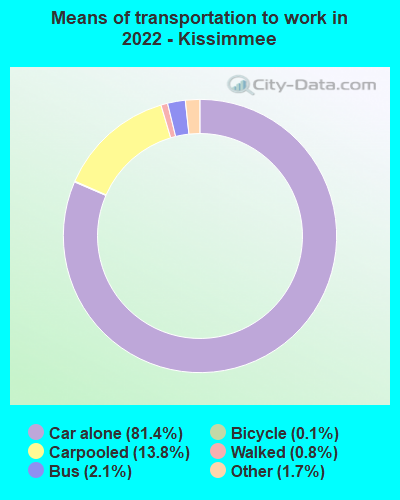
Means of transportation to work:
- Drove a car alone: 34,802 (72.8%)
- Carpooled: 6,261 (13.1%)
- Bus: 850 (1.8%)
- Long-distance train or commuter rail: 44 (0.1%)
- Taxi: 819 (1.7%)
- Bicycle: 53 (0.1%)
- Walked: 361 (0.8%)
- Worked at home: 3,170 (6.6%)

- Unemployment by race in 2022
- Unemployment rate for White non-Hispanic residents
- 3.6%Males
- 4.6%Females
- Unemployment rate for Black residents
- 1.7%Males
- 15.3%Females
- Unemployment rate for Asian residents
- 3.1%Males
- 4.7%Females
- Unemployment rate for other race residents
- 5.5%Males
- 8.7%Females
- Unemployment rate for two or more race residents
- 3.7%Males
- 1.2%Females
- Unemployment rate for Hispanic or Latino residents
- 5.7%Males
- 9.2%Females

- Year of entry for the foreign-born population in Kissimmee, Florida
- 19,1452010 or later
- 3,7272000 to 2009
- 3,9411990 to 1999
- 2,2211980 to 1989
- 7461970 to 1979
- 1,041Before 1970
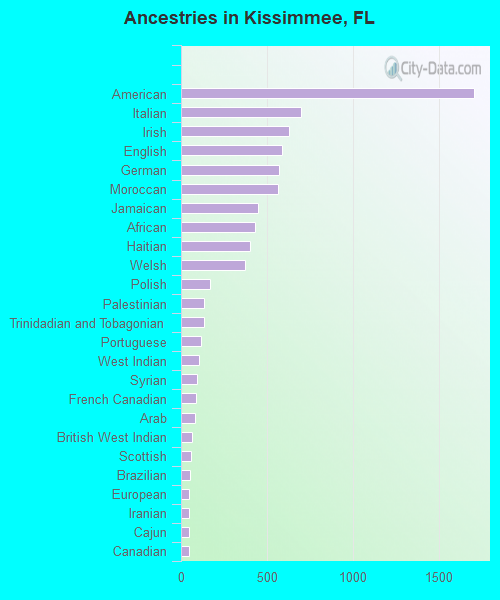
First ancestries reported:
- American: 1,707 (3.2%)
- Italian: 699 (1.3%)
- Irish: 629 (1.2%)
- English: 590 (1.1%)
- German: 572 (1.1%)
- Moroccan: 562 (1.0%)
- Jamaican: 448 (0.8%)
- African: 430 (0.8%)
- Haitian: 403 (0.7%)
- Welsh: 374 (0.7%)
- Polish: 168 (0.3%)
- Palestinian: 135 (0.2%)
- Trinidadian and Tobagonian: 134 (0.2%)
- Portuguese: 114 (0.2%)
- West Indian: 103 (0.2%)
- Syrian: 92 (0.2%)
- French Canadian: 85 (0.2%)
- Arab: 80 (0.1%)
- British West Indian: 65 (0.1%)
- Scottish: 57 (0.1%)
- Brazilian: 51 (0.09%)
- European: 49 (0.09%)
- Iranian: 47 (0.09%)
- Cajun: 44 (0.08%)
- Canadian: 44 (0.08%)
- Egyptian: 41 (0.08%)
- British: 37 (0.07%)
- Guyanese: 36 (0.07%)
- French: 35 (0.06%)
- Lithuanian: 34 (0.06%)
- Swedish: 32 (0.06%)
- Dutch: 31 (0.06%)
- Norwegian: 29 (0.05%)
- Scotch-Irish: 29 (0.05%)
- Hungarian: 23 (0.04%)
- Dutch West Indian: 21 (0.04%)
- Ukrainian: 20 (0.04%)
- Cape Verdean: 15 (0.03%)
- Slovak: 9 (0.02%)
Most common places of birth for foreign-born residents (%):
| Kissimmee: | 35.5% (9,561) |
| Florida: | 5.7% (262,042) |
| Kissimmee: | 10.7% (2,873) |
| Florida: | 6.5% (298,669) |
| Kissimmee: | 10.3% (2,786) |
| Florida: | 3.0% (137,727) |
| Kissimmee: | 5.9% (1,599) |
| Florida: | 22.0% (1,006,576) |
| Kissimmee: | 4.1% (1,097) |
| Florida: | 2.1% (96,693) |
| Kissimmee: | 3.9% (1,060) |
| Florida: | 1.8% (84,403) |
| Kissimmee: | 3.1% (838) |
| Florida: | 5.6% (257,152) |
| Kissimmee: | 3.0% (817) |
| Florida: | 1.2% (54,585) |
| Kissimmee: | 2.6% (709) |
| Florida: | 2.3% (107,160) |
| Kissimmee: | 2.4% (648) |
| Florida: | 0.4% (20,008) |
| Kissimmee: | 2.2% (600) |
| Florida: | 0.5% (22,972) |
| Kissimmee: | 2.0% (545) |
| Florida: | 2.3% (105,066) |
| Kissimmee: | 1.9% (502) |
| Florida: | 5.0% (227,319) |
| Kissimmee: | 1.7% (467) |
| Florida: | 1.1% (49,838) |
| Kissimmee: | 1.6% (439) |
| Florida: | 0.3% (13,569) |
| Kissimmee: | 1.6% (423) |
| Florida: | 0.2% (9,164) |
Place of birth for U.S.-born residents:
- This state: 14,642
- Other state: 20,761
- Northeast: 12,279
- Midwest: 3,182
- South: 3,616
- West: 1,684
80.8% of Kissimmee residents lived in the same house 1 years ago.
Out of people who lived in different houses, 23.4% lived in this county.
Out of people who lived in different counties, 52.5% lived in Florida.
| Kissimmee: | 80.8% |
| State average: | 86.3% |
Education attainment for males 25 years and older:
- No schooling: 404
- Nursery to 4th grade: 203
- 5th and 6th grade: 828
- 7th and 8th grade: 558
- 9th grade: 500
- 10th grade: 307
- 11th grade: 329
- 12th grade, no diploma: 1,949
- High school graduate (or equivalency): 5,882
- Less than 1 year of college: 1,323
- Some college more than 1 year, no degree: 2,129
- Associate degree: 3,184
- Bachelor's degree: 8,504
- Master's degree: 1,129
- Professional school degree: 0
- Doctorate degree: 421

Education attainment for females 25 years and older:
- No schooling: 750
- Nursery to 4th grade: 503
- 5th and 6th grade: 72
- 7th and 8th grade: 955
- 9th grade: 529
- 10th grade: 84
- 11th grade: 640
- 12th grade, no diploma: 379
- High school graduate (or equivalency): 7,826
- Less than 1 year of college: 1,209
- Some college more than 1 year, no degree: 3,451
- Associate degree: 2,174
- Bachelor's degree: 6,175
- Master's degree: 910
- Professional school degree: 436
- Doctorate degree: 64


Housing units in structures:
- One, detached: 15,294
- One, attached: 3,959
- Two: 641
- 3 or 4: 1,194
- 5 to 9: 3,123
- 10 to 19: 5,556
- 20 to 49: 1,315
- 50 or more: 669
- Mobile homes: 1,003
Median worth of mobile homes: $9,999
House/condo owner moved in on average 8 years ago
Renter moved in on average 2 years ago

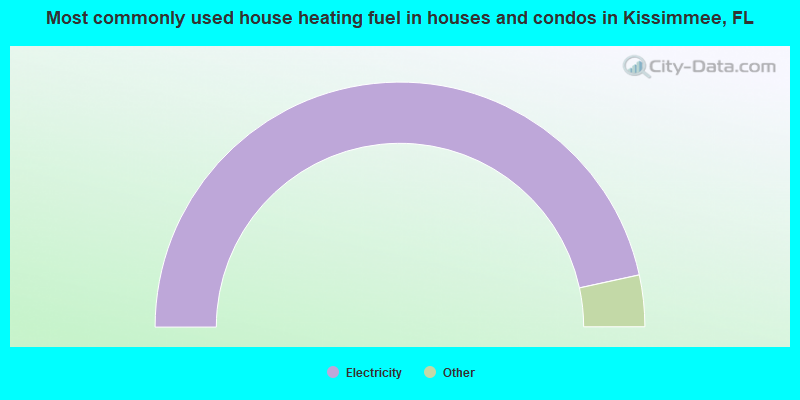
- 93.2%Electricity
- 2.5%Utility gas
- 2.2%No fuel used
- 1.1%Solar energy
- 0.5%Bottled, tank, or LP gas
- 0.3%Fuel oil, kerosene, etc.
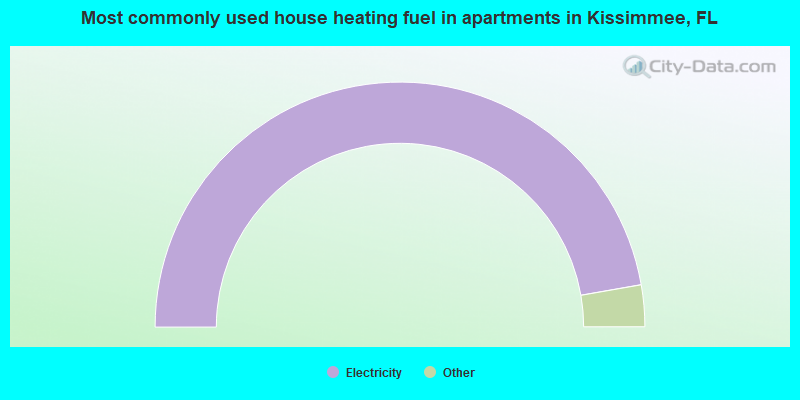
- 94.5%Electricity
- 3.9%Utility gas
- 0.9%Bottled, tank, or LP gas
- 0.6%No fuel used
Private vs. public school enrollment:
| Here: | 17.9% |
| Florida: | 15.8% |
| Here: | 4.8% |
| Florida: | 12.9% |
| Here: | 26.3% |
| Florida: | 23.6% |


