Keyport, NJ (New Jersey) Houses and Residents
| Keyport: | $394,308 |
| New Jersey: | $428,900 |
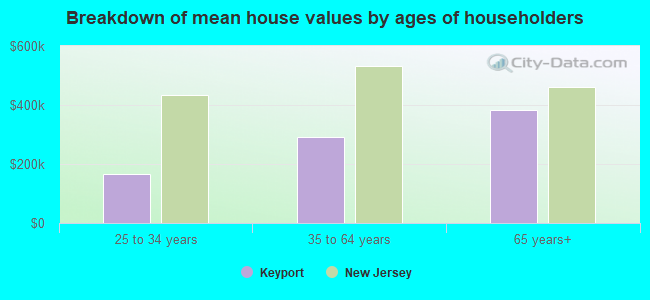
Mean price in 2022:
Detached houses: $329,969
Here: $329,969 State: $537,591 Townhouses or other attached units: $377,410
Here: $377,410 State: $381,113 In 2-unit structures: $637,311
Here: $637,311 State: $444,476 In 5-or-more-unit structures: $291,318
Here: $291,318 State: $368,745
Total population: 7,162 (All urban)
Houses: 3,685 (3,381 occupied: 1,920 owner occupied, 1,519 renter occupied)
| % of renters here: | 44% |
| State: | 35% |
Housing density: 2,609 houses/condos per square mile
Median price asked for vacant for-sale houses and condos in 2022 in this county: $430,351.
Median contract rent in 2022: $1,117 (lower quartile is $495, upper quartile is $1,431)
Median rent asked for vacant for-rent units in 2022: $814
Median gross rent in Keyport, NJ in 2022: $1,233
Housing units in Keyport with a mortgage: 1,399 (189 second mortgage, 11 home equity loan, 111 both second mortgage and home equity loan)
Houses without a mortgage: 42
Median household income for houses/condos with a mortgage: $107,437
Median household income for apartments without a mortgage: $87,443
Median monthly housing costs: $1,539
Compare current foreclosures in Keyport, NJ:
| Photo | Address | Area | Beds / Baths | Price | Details |
|---|---|---|---|---|---|

|
#1
Henry St
Keyport, NJ 07735
|
800 sq. feet
|
1 baths 2 beds |
$219,350
|
show details |

|
#2
Warren Street
Keyport, NJ 07735
|
2,889 sq. feet
|
2 baths 7 beds |
$459,900
|
show details |

|
#3
Lorillard Ave
Keyport, NJ 07735
|
762 sq. feet
|
1 baths 2 beds |
show details | |

|
#4
Netherwood Dr
Keyport, NJ 07735
|
876 sq. feet
|
1 baths 3 beds |
show details | |

|
#5
Dock St
Keyport, NJ 07735
|
1,362 sq. feet
|
2 baths 3 beds |
show details | |

|
#6
Heckleman St
Keyport, NJ 07735
|
1,224 sq. feet
|
2 baths 3 beds |
show details | |

|
#7
Dock St
Keyport, NJ 07735
|
1,536 sq. feet
|
1 baths 3 beds |
show details | |

|
#8
Morningside Ave
Keyport, NJ 07735
|
1,228 sq. feet
|
2 baths 3 beds |
show details | |

|
#9
Woodshore W
Keyport, NJ 07735
|
1,614 sq. feet
|
- baths - beds |
show details | |

|
#10
Boulevard E
Keyport, NJ 07735
|
1,442 sq. feet
|
- baths - beds |
show details |
| Photo | Address | Area | Beds / Baths | Price | Details |
|---|---|---|---|---|---|

|
#11
Sunset Blvd
Keyport, NJ 07735
|
932 sq. feet
|
- baths - beds |
show details | |

|
#12
Beers St Apt 9p
Keyport, NJ 07735
|
- sq. feet
|
- baths - beds |
show details | |

|
#13
3rd St
Keyport, NJ 07735
|
1,548 sq. feet
|
- baths - beds |
show details | |

|
#14
Pershing Pl
Keyport, NJ 07735
|
1,852 sq. feet
|
- baths - beds |
show details | |

|
#15
Marshall Concourse
Keyport, NJ 07735
|
960 sq. feet
|
- baths - beds |
show details | |

|
#16
Elmwood Dr
Keyport, NJ 07735
|
1,632 sq. feet
|
- baths - beds |
show details | |

|
#17
Shore Rd
Keyport, NJ 07735
|
2,065 sq. feet
|
- baths - beds |
show details | |

|
#18
Birchwood Dr
Keyport, NJ 07735
|
722 sq. feet
|
- baths - beds |
show details | |

|
#19
8th St
Keyport, NJ 07735
|
1,705 sq. feet
|
- baths - beds |
show details | |

|
#20
3rd St
Keyport, NJ 07735
|
2,786 sq. feet
|
- baths - beds |
show details |
| Photo | Address | Area | Beds / Baths | Price | Details |
|---|---|---|---|---|---|

|
#21
Florence Ave
Keyport, NJ 07735
|
- sq. feet
|
- baths - beds |
show details | |

|
#22
Florence Ave
Keyport, NJ 07735
|
1,241 sq. feet
|
- baths - beds |
show details | |

|
#23
1st St # 9
Keyport, NJ 07735
|
- sq. feet
|
- baths - beds |
show details | |

|
#24
Woodmere Dr
Keyport, NJ 07735
|
1,155 sq. feet
|
- baths - beds |
show details | |

|
#25
Boulevard E
Keyport, NJ 07735
|
- sq. feet
|
- baths - beds |
show details | |

|
#26
3rd St
Keyport, NJ 07735
|
810 sq. feet
|
- baths - beds |
show details | |

|
#27
Atlantic Street, Apt 61
Keyport, NJ 07735
|
- sq. feet
|
- baths - beds |
show details | |

|
#28
Central Ave
Keyport, NJ 07735
|
990 sq. feet
|
- baths - beds |
show details | |

|
#29
W Prospect Ave
Keyport, NJ 07735
|
743 sq. feet
|
- baths - beds |
show details | |

|
#30
Beers St Apt 9l
Keyport, NJ 07735
|
- sq. feet
|
- baths - beds |
show details |
| Photo | Address | Area | Beds / Baths | Price | Details |
|---|---|---|---|---|---|

|
#31
Center St
Keyport, NJ 07735
|
576 sq. feet
|
- baths - beds |
show details | |

|
#32
Lorillard Ave
Keyport, NJ 07735
|
1,564 sq. feet
|
- baths - beds |
show details | |

|
#33
Sydney Ave
Keyport, NJ 07735
|
676 sq. feet
|
- baths - beds |
show details | |

|
#34
Lorillard Ave
Keyport, NJ 07735
|
1,564 sq. feet
|
- baths - beds |
show details | |

|
#35
Beverly Dr
Keyport, NJ 07735
|
840 sq. feet
|
- baths - beds |
show details | |

|
#36
Washington Ave
Keyport, NJ 07735
|
1,439 sq. feet
|
- baths - beds |
show details | |

|
#37
Broad St
Keyport, NJ 07735
|
- sq. feet
|
- baths - beds |
show details | |

|
#38
Prospect Ave
Keyport, NJ 07735
|
1,120 sq. feet
|
- baths - beds |
show details | |

|
#39
Hilltop Blvd
Keyport, NJ 07735
|
8,000 sq. feet
|
- baths - beds |
show details | |

|
#40
H Street
Keyport, NJ 07735
|
- sq. feet
|
- baths - beds |
show details |
| Photo | Address | Area | Beds / Baths | Price | Details |
|---|---|---|---|---|---|

|
#41
Cliffwood Ave
Keyport, NJ 07735
|
796 sq. feet
|
- baths - beds |
show details | |

|
#42
Main St
Keyport, NJ 07735
|
2,057 sq. feet
|
- baths - beds |
show details | |

|
#43
Beers St
Keyport, NJ 07735
|
2,043 sq. feet
|
- baths - beds |
show details | |

|
#44
Heckelmann St
Keyport, NJ 07735
|
1,170 sq. feet
|
- baths - beds |
show details | |

|
#45
Beers St
Keyport, NJ 07735
|
1,450 sq. feet
|
- baths - beds |
show details | |

|
#46
Central Ave
Keyport, NJ 07735
|
1,350 sq. feet
|
- baths - beds |
show details | |

|
#47
Hurley St # 5
Keyport, NJ 07735
|
- sq. feet
|
- baths - beds |
show details | |

|
#48
Lorillard Ave
Keyport, NJ 07735
|
762 sq. feet
|
- baths - beds |
show details | |

|
#49
Woodmere Dr
Keyport, NJ 07735
|
1,260 sq. feet
|
- baths - beds |
show details | |

|
Check over 1 million property listings on Foreclosure.com!
|
browse all offers | |||

Latest news about housing in Keyport, NJ collected exclusively by city-data.com from local newspapers, TV, and radio stations

 | Keyport Apartments (2 replies) |
| buying a Mobile home/Trailer in NJ. dont laugh (29 replies) |
| I'm searching for a house to rent/rent to own in Middletown,NJ area??? (4 replies) |
| New Job in Perth Amboy. What area is near to live? no kids,1500-2000 rent,within 30min Perth Amboy (21 replies) |
| Opinions on Keyport, NJ (30 replies) |
| Keyport Condos? (7 replies) |

Median year apartment built: 1965
Household type by relationship:
Households: 7,199- Male householders: 1,468 (549 living alone), Female householders: 1,901 (1,007 living alone)
1,227 spouses (1,188 opposite-sex spouses), 229 unmarried partners, (229 opposite-sex unmarried partners), 1,788 children (1,762 natural, 19 adopted, 7 stepchildren), 155 grandchildren, 37 brothers or sisters, 58 parents, 0 foster children, 136 other relatives, 162 non-relatives
- In group quarters: 35
Size of family households: 598 2-persons, 567 3-persons, 251 4-persons, 244 5-persons, 10 6-persons, 31 7-or-more-persons.
Size of nonfamily households: 1,553 1-person, 179 2-persons.
917 married couples with children.
209 single-parent households (87 men, 122 women).
81.8% of residents of Keyport speak English at home.
11.3% of residents speak Spanish at home (56% speak English very well, 37% speak English well, 6% speak English not well, 1% don't speak English at all).
2.7% of residents speak other Indo-European language at home (46% speak English very well, 54% speak English not well).
1.7% of residents speak Asian or Pacific Island language at home (34% speak English very well, 40% speak English well, 21% speak English not well, 5% don't speak English at all).
1.0% of residents speak other language at home (83% speak English very well, 17% speak English well).
Foreign born population: 913 (12.7%)
(71.7% of them are naturalized citizens)
| Here: | 6.3 |
| State: | 6.8 |
| Here: | 2.9 |
| State: | 3.9 |
- Bedrooms in owner-occupied houses and condos in Keyport, New Jersey
- 0no bedroom
- 681 bedroom
- 3902 bedrooms
- 9203 bedrooms
- 4494 bedrooms
- 945+ bedrooms
- Bedrooms in renter-occupied apartments in Keyport, New Jersey
- 362no bedroom
- 7781 bedroom
- 3052 bedrooms
- 703 bedrooms
- 54 bedrooms
- 05+ bedrooms
- Cars and other vehicles available in Keyport in owner-occupied houses/condos
- 45no vehicle
- 6631 vehicle
- 7242 vehicles
- 3053 vehicles
- 1454 vehicles
- 395+ vehicles
- Cars and other vehicles available in Keyport in renter-occupied apartments
- 470no vehicle
- 7691 vehicle
- 2402 vehicles
- 403 vehicles
- 04 vehicles
- 05+ vehicles
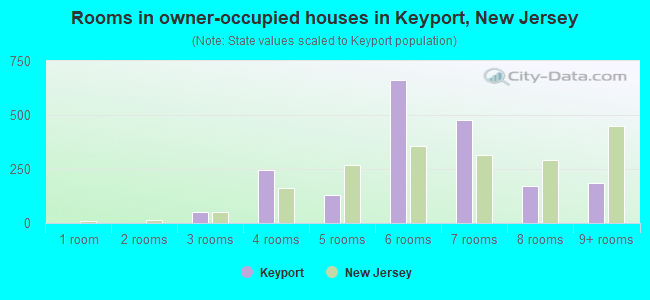
- Rooms in owner-occupied houses in Keyport, New Jersey
- 01 room
- 02 rooms
- 523 rooms
- 2454 rooms
- 1285 rooms
- 6606 rooms
- 4787 rooms
- 1738 rooms
- 1859+ rooms
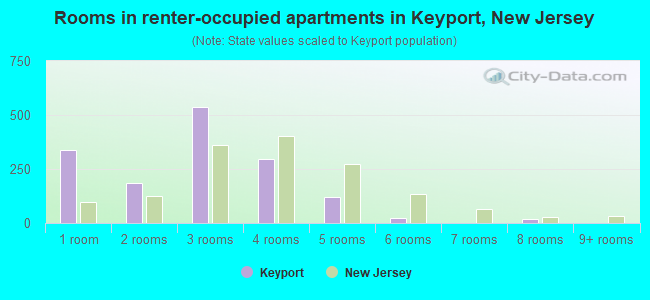
- Rooms in renter-occupied apartments in Keyport, New Jersey
- 3381 room
- 1852 rooms
- 5393 rooms
- 2974 rooms
- 1195 rooms
- 256 rooms
- 07 rooms
- 188 rooms
- 09+ rooms
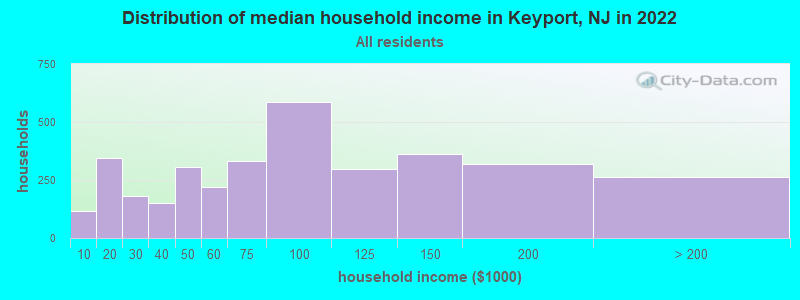
Keyport, NJ household income distribution

- 118Less than $10,000
- 344$10,000 to $19,999
- 183$20,000 to $29,999
- 149$30,000 to $39,999
- 304$40,000 to $49,999
- 220$50,000 to $59,999
- 332$60,000 to $74,999
- 587$75,000 to $99,999
- 298$100,000 to $124,999
- 360$125,000 to $149,999
- 318$150,000 to $199,999
- 264$200,000 or more
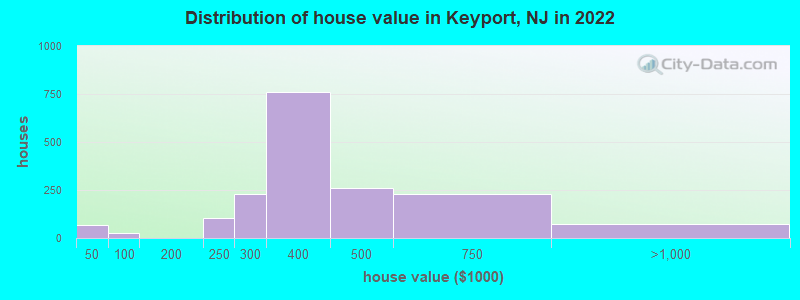
Home value of owner - occupied houses in 2022 in Keyport, NJ
-
- 41Less than $10,000
- 24$30,000 to $34,999
- 14$70,000 to $79,999
- 11$90,000 to $99,999
- 104$200,000 to $249,999
- 228$250,000 to $299,999
- 761$300,000 to $399,999
- 262$400,000 to $499,999
- 230$500,000 to $749,999
- 72$750,000 to $999,999
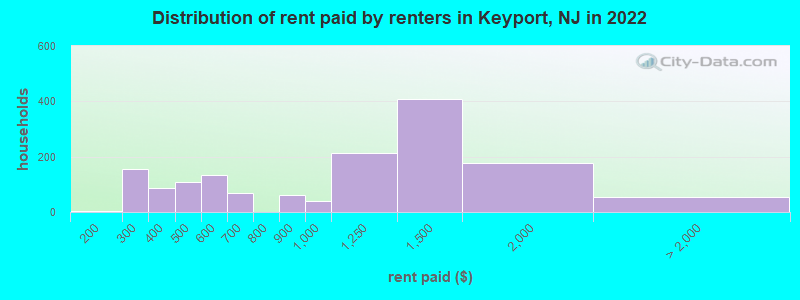
Rent paid by renters in 2022 in Keyport, NJ
-
- 4$150 to $199
- 155$250 to $299
- 65$300 to $349
- 22$350 to $399
- 40$400 to $449
- 70$450 to $499
- 119$500 to $549
- 15$550 to $599
- 66$600 to $649
- 61$800 to $899
- 41$900 to $999
- 214$1,000 to $1,249
- 408$1,250 to $1,499
- 175$1,500 to $1,999
- 48$2,000 to $2,499
- 5$3,500 or more
Percentage of workers working in this county: 64.8%
Number of people working at home: 428 (12.1% of all workers)
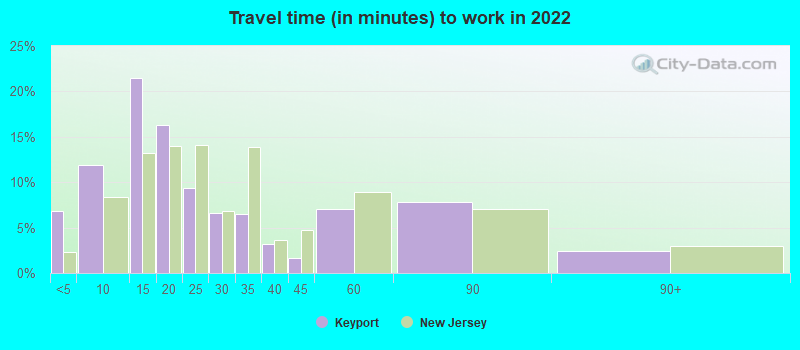
Travel time to work (commute)
- Less than 5 minutes: 132
- 5 to 9 minutes: 339
- 10 to 14 minutes: 490
- 15 to 19 minutes: 275
- 20 to 24 minutes: 368
- 25 to 29 minutes: 236
- 30 to 34 minutes: 332
- 35 to 39 minutes: 69
- 40 to 44 minutes: 95
- 45 to 59 minutes: 332
- 60 to 89 minutes: 292
- 90 or more minutes: 95
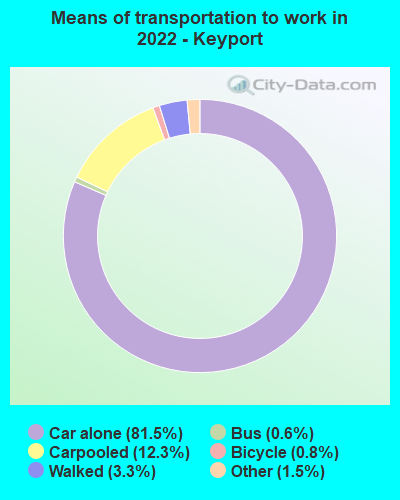
Means of transportation to work:
- Drove a car alone: 1,551 (63.5%)
- Carpooled: 277 (11.3%)
- Bus: 19 (0.8%)
- Taxi: 42 (1.7%)
- Bicycle: 11 (0.5%)
- Walked: 95 (3.9%)
- Worked at home: 428 (17.5%)
- Unemployment by race in 2022
- Unemployment rate for White non-Hispanic residents
- 7.2%Males
- 5.5%Females
- Unemployment rate for Black residents
- 45.3%Males
- Unemployment rate for Asian residents
- 14.2%Females
- Unemployment rate for other race residents
- 17.3%Males
- Unemployment rate for two or more race residents
- 11.7%Males
- 2.8%Females
- Unemployment rate for Hispanic or Latino residents
- 3.5%Males
- 1.8%Females
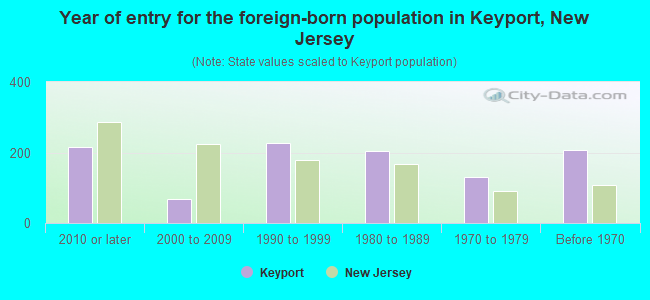
- Year of entry for the foreign-born population in Keyport, New Jersey
- 2172010 or later
- 692000 to 2009
- 2281990 to 1999
- 2041980 to 1989
- 1311970 to 1979
- 206Before 1970
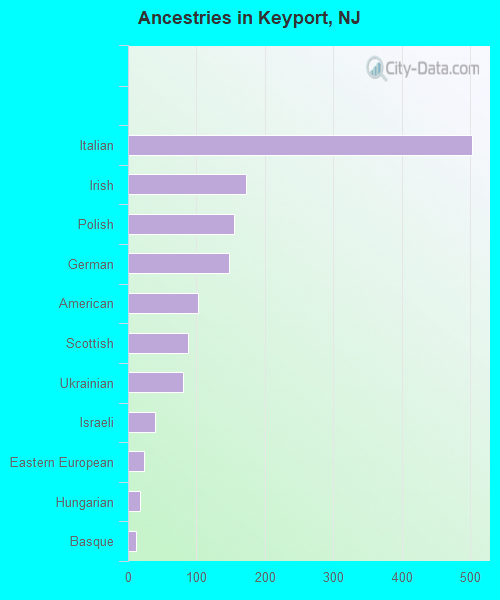
First ancestries reported:
- Italian: 502 (19.3%)
- Irish: 172 (6.6%)
- Polish: 155 (5.9%)
- German: 148 (5.7%)
- American: 102 (3.9%)
- Scottish: 87 (3.3%)
- Ukrainian: 80 (3.1%)
- Israeli: 40 (1.5%)
- Eastern European: 23 (0.9%)
- Hungarian: 17 (0.7%)
- Basque: 11 (0.4%)
- Greek: 4 (0.2%)
- Norwegian: 4 (0.2%)
- Scotch-Irish: 4 (0.2%)
Most common places of birth for foreign-born residents (%):
| Keyport: | 21.8% (198) |
| New Jersey: | 4.2% (90,817) |
| Keyport: | 15.8% (144) |
| New Jersey: | 9.7% (209,055) |
| Keyport: | 8.8% (80) |
| New Jersey: | 1.1% (22,760) |
| Keyport: | 6.7% (61) |
| New Jersey: | 4.4% (95,275) |
| Keyport: | 6.4% (58) |
| New Jersey: | 12.8% (274,609) |
| Keyport: | 5.5% (50) |
| New Jersey: | 0.8% (17,217) |
| Keyport: | 4.7% (43) |
| New Jersey: | 0.5% (10,975) |
| Keyport: | 4.6% (42) |
| New Jersey: | 4.0% (85,934) |
| Keyport: | 4.6% (42) |
| New Jersey: | 1.5% (33,198) |
| Keyport: | 4.0% (36) |
| New Jersey: | 2.1% (45,435) |
| Keyport: | 4.0% (36) |
| New Jersey: | 4.8% (102,527) |
| Keyport: | 3.1% (28) |
| New Jersey: | 3.7% (78,969) |
| Keyport: | 2.7% (25) |
| New Jersey: | 3.3% (70,512) |
| Keyport: | 2.1% (19) |
| New Jersey: | 0.2% (4,324) |
| Keyport: | 1.8% (16) |
| New Jersey: | 0.4% (8,146) |
| Keyport: | 1.6% (15) |
| New Jersey: | 2.7% (58,563) |
Place of birth for U.S.-born residents:
- This state: 4,407
- Other state: 1,822
- Northeast: 1,310
- Midwest: 166
- South: 177
- West: 187
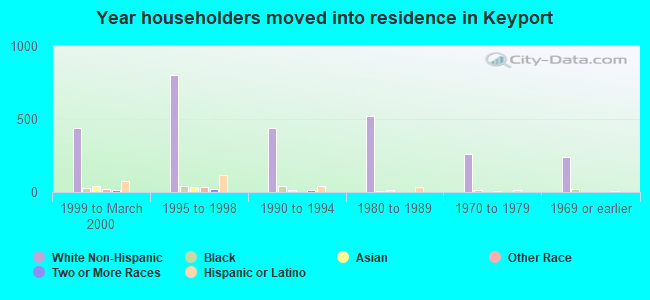
93.5% of Keyport residents lived in the same house 1 years ago.
Out of people who lived in different houses, 20.8% lived in this county.
Out of people who lived in different counties, 61.2% lived in New Jersey.
| Keyport: | 93.5% |
| State average: | 90.4% |
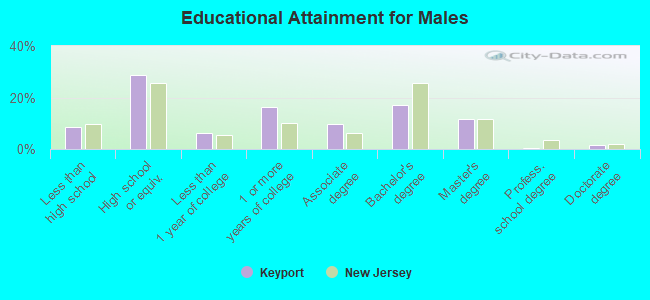
Education attainment for males 25 years and older:
- No schooling: 13
- Nursery to 4th grade: 0
- 5th and 6th grade: 11
- 7th and 8th grade: 38
- 9th grade: 11
- 10th grade: 5
- 11th grade: 46
- 12th grade, no diploma: 68
- High school graduate (or equivalency): 653
- Less than 1 year of college: 139
- Some college more than 1 year, no degree: 367
- Associate degree: 215
- Bachelor's degree: 388
- Master's degree: 265
- Professional school degree: 7
- Doctorate degree: 31
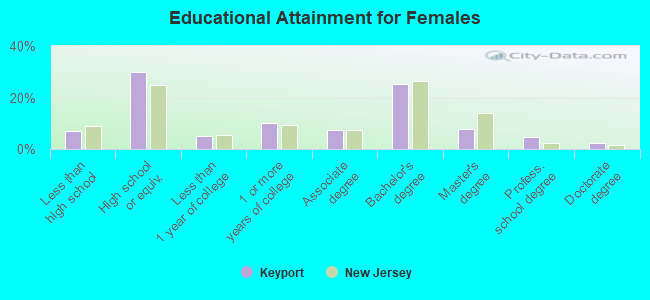
Education attainment for females 25 years and older:
- No schooling: 27
- Nursery to 4th grade: 21
- 5th and 6th grade: 14
- 7th and 8th grade: 7
- 9th grade: 0
- 10th grade: 74
- 11th grade: 0
- 12th grade, no diploma: 62
- High school graduate (or equivalency): 873
- Less than 1 year of college: 150
- Some college more than 1 year, no degree: 293
- Associate degree: 220
- Bachelor's degree: 737
- Master's degree: 222
- Professional school degree: 137
- Doctorate degree: 68


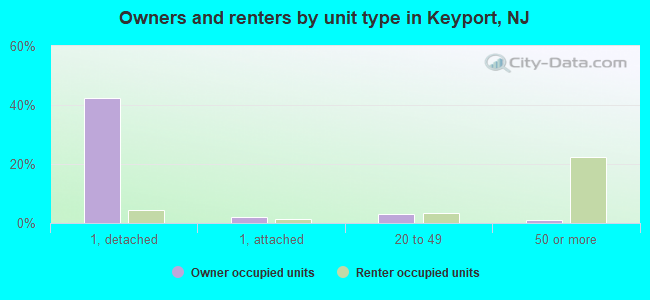
Housing units in structures:
- One, detached: 1,739
- One, attached: 235
- Two: 340
- 3 or 4: 215
- 5 to 9: 12
- 10 to 19: 115
- 20 to 49: 167
- 50 or more: 851
- Mobile homes: 8
Housing units lacking complete kitchen facilities in 2022: 2.6%
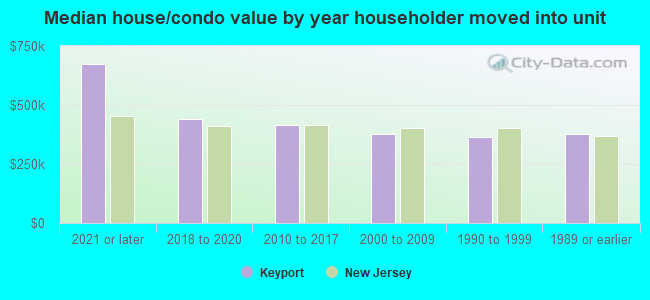
House/condo owner moved in on average 14 years ago
Renter moved in on average 5 years ago
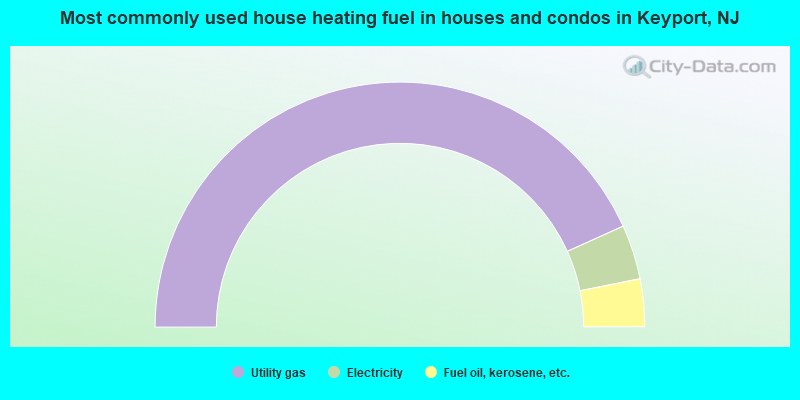
- 86.5%Utility gas
- 7.2%Electricity
- 6.3%Fuel oil, kerosene, etc.
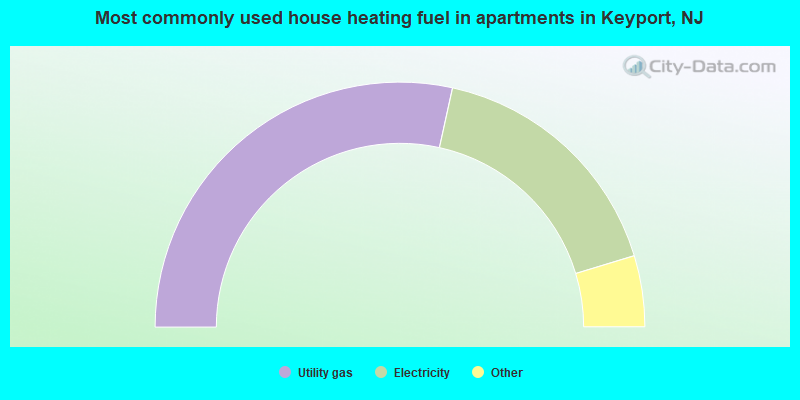
- 56.9%Utility gas
- 33.7%Electricity
- 4.0%Fuel oil, kerosene, etc.
- 3.9%Bottled, tank, or LP gas
- 1.5%No fuel used
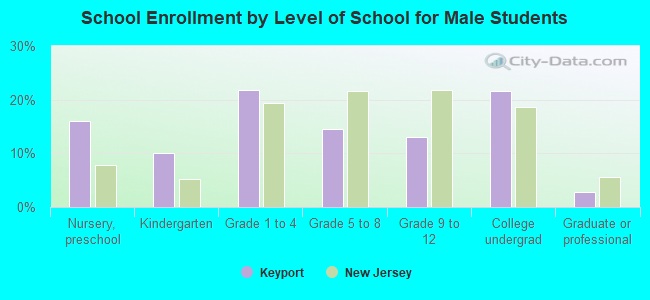
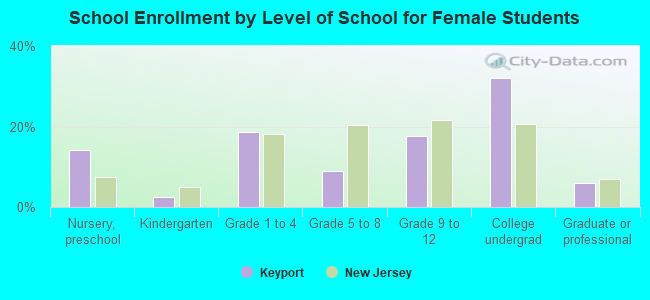
Private vs. public school enrollment:
| Here: | 13.4% |
| New Jersey: | 12.3% |
| Here: | 30.0% |
| New Jersey: | 13.1% |
| Here: | 45.4% |
| New Jersey: | 33.2% |