Ken Caryl, CO (Colorado) Houses and Residents
| Ken Caryl: | $569,815 |
| Colorado: | $531,100 |
Total population: 32,438 (Urban population: 30,694, Rural population: 144 (all nonfarm))
Houses: 14,101 (13,930 occupied: 11,483 owner occupied, 2,338 renter occupied)
| % of renters here: | 17% |
| State: | 34% |
Housing density: 1,447 houses/condos per square mile
Median price asked for vacant for-sale houses and condos in 2022: $713,852.
Median contract rent in 2022: $1,844 (lower quartile is $1,610, upper quartile is over $2,000)
Median rent asked for vacant for-rent units in 2022: $9,058
Median gross rent in Ken Caryl, CO in 2022: $1,900
Housing units in Ken Caryl with a mortgage: 8,703 (1,193 second mortgage, 13 home equity loan, 1,022 both second mortgage and home equity loan)
Houses without a mortgage: 128
Median household income for houses/condos with a mortgage: $131,246
Median household income for apartments without a mortgage: $80,178
Median monthly housing costs: $1,874
Compare current foreclosures near Ken Caryl, CO:
| Photo | Address | Area | Beds / Baths | Price | Details |
|---|---|---|---|---|---|

|
#1
Curtis St
Denver, CO 80205
|
822 sq. feet
|
3 baths 4 beds |
$499,900
|
show details |

|
#2
S Columbine Dr
Morrison, CO 80465
|
2,280 sq. feet
|
2 baths 3 beds |
$529,900
|
show details |

|
#3
S Ammons St
Denver, CO 80227
|
1,100 sq. feet
|
2 baths 2 beds |
show details | |

|
#4
E Kentucky Ave Unit D
Denver, CO 80246
|
745 sq. feet
|
1 baths 2 beds |
show details | |

|
#5
S Lowell Blvd Apt B
Denver, CO 80236
|
673 sq. feet
|
1 baths 1 beds |
show details | |

|
#6
S Fillmore Cir
Littleton, CO 80122
|
1,036 sq. feet
|
3 baths 3 beds |
show details | |

|
#7
E Maplewood Cir
Englewood, CO 80111
|
3,873 sq. feet
|
4 baths 4 beds |
show details | |

|
#8
W Dartmouth Ave
Denver, CO 80227
|
1,351 sq. feet
|
3 baths 3 beds |
show details | |

|
#9
Yosemite St Unit 113
Denver, CO 80220
|
720 sq. feet
|
1 baths 2 beds |
show details | |

|
#10
W 11th Ave Apt 1102
Denver, CO 80204
|
771 sq. feet
|
1 baths 1 beds |
show details |
| Photo | Address | Area | Beds / Baths | Price | Details |
|---|---|---|---|---|---|

|
#11
S Holland Ct
Denver, CO 80226
|
2,015 sq. feet
|
3 baths 3 beds |
show details | |

|
#12
S Newland St
Denver, CO 80227
|
1,760 sq. feet
|
2 baths 2 beds |
show details | |

|
#13
S Newark Ct
Aurora, CO 80012
|
864 sq. feet
|
2 baths 2 beds |
show details | |

|
#14
Heatherwood Pl
Littleton, CO 80126
|
2,875 sq. feet
|
4 baths 3 beds |
show details | |

|
#15
E Girard Ave Apt 102
Denver, CO 80231
|
1,050 sq. feet
|
2 baths 2 beds |
show details | |

|
#16
S Nelson St
Denver, CO 80226
|
1,213 sq. feet
|
2 baths 4 beds |
show details | |

|
#17
E Center Ave Apt 1a
Denver, CO 80247
|
870 sq. feet
|
1 baths 2 beds |
show details | |

|
#18
Vivian Ct
Arvada, CO 80004
|
1,463 sq. feet
|
1 baths 3 beds |
show details | |

|
#19
E Peakview Ave Apt G10
Englewood, CO 80111
|
1,069 sq. feet
|
1 baths 2 beds |
show details | |

|
#20
N Madison St
Denver, CO 80205
|
863 sq. feet
|
1 baths 2 beds |
show details |
| Photo | Address | Area | Beds / Baths | Price | Details |
|---|---|---|---|---|---|

|
#21
S Sherman St
Denver, CO 80210
|
1,482 sq. feet
|
1 baths 4 beds |
show details | |

|
#22
W 12th Ave
Denver, CO 80204
|
1,788 sq. feet
|
2 baths 3 beds |
show details | |

|
#23
W 61st Ave
Arvada, CO 80004
|
1,183 sq. feet
|
1 baths 5 beds |
show details | |

|
#24
S Upham St
Denver, CO 80227
|
2,750 sq. feet
|
3 baths 3 beds |
show details | |

|
#25
S Blackhawk Way
Aurora, CO 80014
|
3,021 sq. feet
|
2 baths 3 beds |
show details | |

|
#26
W 55th Ave
Denver, CO 80221
|
1,178 sq. feet
|
2 baths 3 beds |
show details | |

|
#27
Fillmore St
Denver, CO 80216
|
1,529 sq. feet
|
3 baths 3 beds |
show details | |

|
#28
Lewis St
Arvada, CO 80004
|
1,402 sq. feet
|
1 baths 3 beds |
show details | |

|
#29
S Hickory St
Littleton, CO 80120
|
1,012 sq. feet
|
2 baths 2 beds |
show details | |

|
#30
W Lakeside Dr
Littleton, CO 80125
|
1,772 sq. feet
|
2 baths 2 beds |
show details |
| Photo | Address | Area | Beds / Baths | Price | Details |
|---|---|---|---|---|---|

|
#31
S Harlan St Unit 171
Denver, CO 80235
|
983 sq. feet
|
2 baths 2 beds |
show details | |

|
#32
Garland St
Denver, CO 80215
|
1,595 sq. feet
|
2 baths 3 beds |
show details | |

|
#33
W Hampden Ave
Denver, CO 80227
|
922 sq. feet
|
1 baths 2 beds |
show details | |

|
#34
E Virginia Ave
Denver, CO 80209
|
654 sq. feet
|
1 baths 1 beds |
show details | |

|
#35
E Maplewood Pl
Aurora, CO 80016
|
4,801 sq. feet
|
4 baths 4 beds |
show details | |

|
#36
S Glencoe Ct
Littleton, CO 80121
|
1,528 sq. feet
|
2 baths 2 beds |
show details | |

|
#37
Florence St
Aurora, CO 80010
|
839 sq. feet
|
1 baths 2 beds |
show details | |

|
#38
S Xenia Cir Apt C
Englewood, CO 80112
|
1,120 sq. feet
|
2 baths 2 beds |
show details | |

|
#39
S Quebec St Apt T107
Denver, CO 80237
|
904 sq. feet
|
2 baths 2 beds |
show details | |

|
#40
S Stuart St
Denver, CO 80219
|
639 sq. feet
|
1 baths 2 beds |
show details |
| Photo | Address | Area | Beds / Baths | Price | Details |
|---|---|---|---|---|---|

|
#41
S Depew St
Denver, CO 80226
|
1,097 sq. feet
|
1 baths 4 beds |
show details | |

|
#42
W Canal Cir Unit 1031
Littleton, CO 80120
|
706 sq. feet
|
1 baths 2 beds |
show details | |

|
#43
W Alaska Pl
Denver, CO 80219
|
1,646 sq. feet
|
2 baths 2 beds |
show details | |

|
#44
S Jasmine St
Denver, CO 80222
|
1,599 sq. feet
|
3 baths 3 beds |
show details | |

|
#45
S Windermere St
Littleton, CO 80120
|
1,992 sq. feet
|
4 baths 1 beds |
show details | |

|
#46
E Temple Pl
Aurora, CO 80015
|
1,164 sq. feet
|
3 baths 2 beds |
show details | |

|
#47
S Marshall St
Denver, CO 80226
|
2,400 sq. feet
|
3 baths 5 beds |
show details | |

|
#48
S Field St Apt 164
Denver, CO 80227
|
860 sq. feet
|
1 baths 2 beds |
show details | |

|
#49
E Temple Pl # 75
Aurora, CO 80015
|
1,164 sq. feet
|
2 baths 2 beds |
show details | |

|
Check over 1 million property listings on Foreclosure.com!
|
browse all offers | |||


 | Ken Caryl homes (4 replies) |
| Looking at Denver real estate - a little torn between the city and the burbs (107 replies) |
| Closing on home soon and need opinion on neighborhood (37 replies) |
| Finding Apartments in Littleton/Englewood (12 replies) |
| Experience living in Ken Caryl Valley? Younger family (10 replies) |
| Where to look for homes - job in Englewood 80112 (14 replies) |

Median year apartment built: 1994
Household type by relationship:
Households: 33,252- Male householders: 7,011 (1,797 living alone), Female householders: 6,532 (1,713 living alone)
7,385 spouses (7,346 opposite-sex spouses), 919 unmarried partners, (892 opposite-sex unmarried partners), 9,444 children (8,748 natural, 362 adopted, 333 stepchildren), 353 grandchildren, 224 brothers or sisters, 208 parents, 24 foster children, 322 other relatives, 783 non-relatives
- In group quarters: 42
Size of family households: 4,280 2-persons, 2,161 3-persons, 1,657 4-persons, 629 5-persons, 310 6-persons, 47 7-or-more-persons.
Size of nonfamily households: 3,690 1-person, 838 2-persons, 86 3-persons, 11 4-persons, 8 5-persons.
5,320 married couples with children.
1,162 single-parent households (360 men, 802 women).
92.0% of residents of Ken Caryl speak English at home.
3.5% of residents speak Spanish at home (80% speak English very well, 8% speak English well, 12% speak English not well, 1% don't speak English at all).
3.1% of residents speak other Indo-European language at home (78% speak English very well, 17% speak English well, 5% don't speak English at all).
1.8% of residents speak Asian or Pacific Island language at home (71% speak English very well, 19% speak English well, 7% speak English not well, 2% don't speak English at all).
0.1% of residents speak other language at home (100% speak English very well).
Foreign born population: 1,536 (4.6%)
(54.3% of them are naturalized citizens)
| Here: | 7.2 |
| State: | 6.8 |
| Here: | 5.0 |
| State: | 4.0 |

- Bedrooms in owner-occupied houses and condos in Ken Caryl, Colorado
- 55no bedroom
- 2411 bedroom
- 2,3002 bedrooms
- 4,0443 bedrooms
- 3,2424 bedrooms
- 1,6015+ bedrooms

- Bedrooms in renter-occupied apartments in Ken Caryl, Colorado
- 18no bedroom
- 2471 bedroom
- 1,2602 bedrooms
- 5883 bedrooms
- 2134 bedrooms
- 125+ bedrooms

- Cars and other vehicles available in Ken Caryl in owner-occupied houses/condos
- 98no vehicle
- 2,7551 vehicle
- 4,7892 vehicles
- 2,5923 vehicles
- 8944 vehicles
- 3545+ vehicles

- Cars and other vehicles available in Ken Caryl in renter-occupied apartments
- 64no vehicle
- 9641 vehicle
- 9192 vehicles
- 2873 vehicles
- 294 vehicles
- 765+ vehicles

- Rooms in owner-occupied houses in Ken Caryl, Colorado
- 171 room
- 532 rooms
- 5843 rooms
- 8334 rooms
- 1,4415 rooms
- 1,7236 rooms
- 1,6267 rooms
- 1,6458 rooms
- 3,5629+ rooms

- Rooms in renter-occupied apartments in Ken Caryl, Colorado
- 181 room
- 1092 rooms
- 4103 rooms
- 4834 rooms
- 3725 rooms
- 4616 rooms
- 1607 rooms
- 2148 rooms
- 1119+ rooms


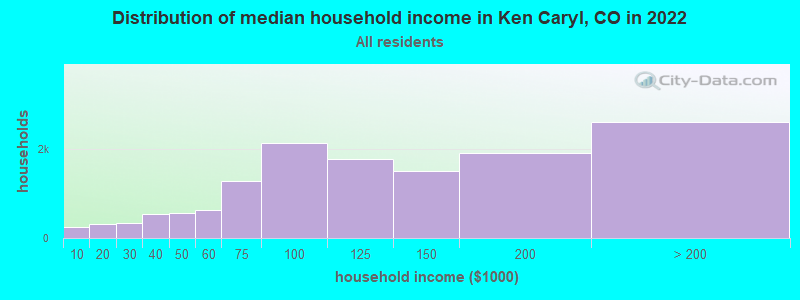
Ken Caryl, CO household income distribution

- 237Less than $10,000
- 322$10,000 to $19,999
- 334$20,000 to $29,999
- 539$30,000 to $39,999
- 562$40,000 to $49,999
- 619$50,000 to $59,999
- 1,281$60,000 to $74,999
- 2,126$75,000 to $99,999
- 1,781$100,000 to $124,999
- 1,514$125,000 to $149,999
- 1,906$150,000 to $199,999
- 2,606$200,000 or more
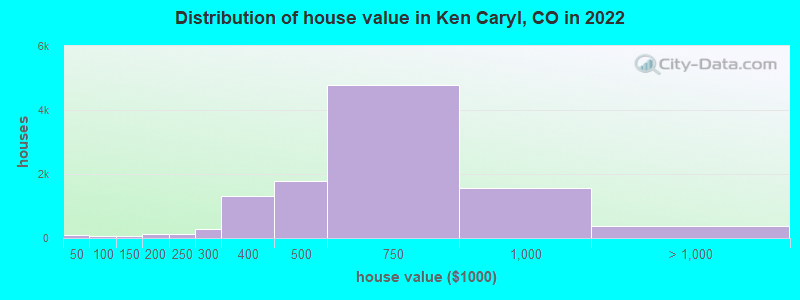
Home value of owner - occupied houses in 2022 in Ken Caryl, CO
-
- 86Less than $10,000
- 15$35,000 to $39,999
- 3$40,000 to $49,999
- 56$50,000 to $59,999
- 8$70,000 to $79,999
- 67$100,000 to $124,999
- 7$125,000 to $149,999
- 111$150,000 to $174,999
- 13$175,000 to $199,999
- 115$200,000 to $249,999
- 269$250,000 to $299,999
- 1,297$300,000 to $399,999
- 1,774$400,000 to $499,999
- 4,787$500,000 to $749,999
- 1,550$750,000 to $999,999
- 305$1,000,000 to $1,499,999
- 63$2,000,000 or more
Rent paid by renters in 2022 in Ken Caryl, CO
-
- 4$800 to $899
- 27$900 to $999
- 134$1,000 to $1,249
- 195$1,250 to $1,499
- 1,285$1,500 to $1,999
- 506$2,000 to $2,499
- 132$2,500 to $2,999
- 51$3,000 to $3,499
- 26No cash rent


Percentage of workers working in this county: 57.2%
Number of people working at home: 5,004 (25.8% of all workers)
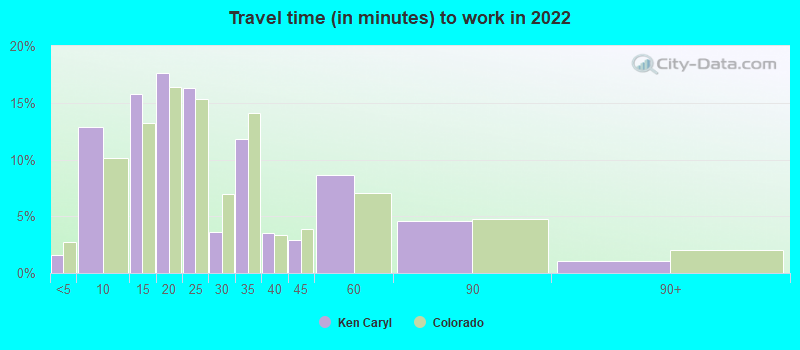
Travel time to work (commute)
- Less than 5 minutes: 176
- 5 to 9 minutes: 1,214
- 10 to 14 minutes: 1,316
- 15 to 19 minutes: 1,704
- 20 to 24 minutes: 2,464
- 25 to 29 minutes: 855
- 30 to 34 minutes: 2,525
- 35 to 39 minutes: 716
- 40 to 44 minutes: 780
- 45 to 59 minutes: 1,515
- 60 to 89 minutes: 883
- 90 or more minutes: 175
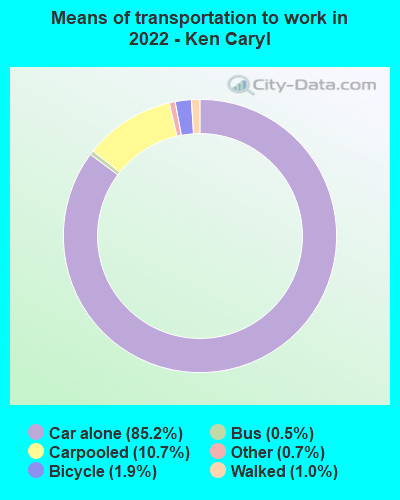
Means of transportation to work:
- Drove a car alone: 7,488 (55.7%)
- Carpooled: 922 (6.9%)
- Bus: 47 (0.3%)
- Taxi: 67 (0.5%)
- Bicycle: 103 (0.8%)
- Walked: 91 (0.7%)
- Worked at home: 5,004 (37.2%)

- Unemployment by race in 2022
- Unemployment rate for White non-Hispanic residents
- 2.4%Males
- 2.4%Females
- Unemployment rate for Asian residents
- 7.0%Males
- Unemployment rate for two or more race residents
- 6.8%Males
- 2.3%Females
- Unemployment rate for Hispanic or Latino residents
- 6.9%Males
- 0.7%Females

- Year of entry for the foreign-born population in Ken Caryl, Colorado
- 3962010 or later
- 4202000 to 2009
- 3611990 to 1999
- 2841980 to 1989
- 2591970 to 1979
- 275Before 1970

First ancestries reported:
- German: 2,296 (17.8%)
- English: 1,624 (12.6%)
- American: 1,299 (10.0%)
- Irish: 933 (7.2%)
- Italian: 700 (5.4%)
- European: 694 (5.4%)
- Polish: 594 (4.6%)
- Norwegian: 414 (3.2%)
- Dutch: 231 (1.8%)
- Scottish: 190 (1.5%)
- Swedish: 146 (1.1%)
- French: 119 (0.9%)
- Ukrainian: 92 (0.7%)
- Scotch-Irish: 75 (0.6%)
- Portuguese: 60 (0.5%)
- Scandinavian: 58 (0.4%)
- British: 55 (0.4%)
- Bulgarian: 37 (0.3%)
- Welsh: 36 (0.3%)
- Danish: 33 (0.3%)
- Hungarian: 32 (0.2%)
- Romanian: 32 (0.2%)
- Russian: 32 (0.2%)
- Serbian: 29 (0.2%)
- Northern European: 26 (0.2%)
- Lithuanian: 23 (0.2%)
- Brazilian: 23 (0.2%)
- Czech: 22 (0.2%)
- Turkish: 22 (0.2%)
- French Canadian: 17 (0.1%)
- Croatian: 17 (0.1%)
- Iranian: 16 (0.1%)
- Australian: 15 (0.1%)
- Basque: 13 (0.1%)
- Lebanese: 11 (0.09%)
- Austrian: 9 (0.07%)
- Slovene: 9 (0.07%)
- Greek: 7 (0.05%)
- Swiss: 7 (0.05%)
- Finnish: 5 (0.04%)
- Czechoslovakian: 5 (0.04%)
- Slovak: 5 (0.04%)
- African: 4 (0.03%)
- Nigerian: 1 (0.01%)
Most common places of birth for foreign-born residents (%):
| Ken Caryl: | 10.6% (180) |
| Colorado: | 38.3% (209,491) |
| Ken Caryl: | 9.2% (157) |
| Colorado: | 1.2% (6,672) |
| Ken Caryl: | 9.0% (154) |
| Colorado: | 0.9% (4,772) |
| Ken Caryl: | 8.6% (147) |
| Colorado: | 2.9% (15,981) |
| Ken Caryl: | 8.0% (136) |
| Colorado: | 0.2% (1,349) |
| Ken Caryl: | 6.6% (113) |
| Colorado: | 3.0% (16,616) |
| Ken Caryl: | 5.8% (98) |
| Colorado: | 2.7% (15,026) |
| Ken Caryl: | 5.6% (96) |
| Colorado: | 0.9% (4,810) |
| Ken Caryl: | 4.1% (69) |
| Colorado: | 0.7% (4,075) |
| Ken Caryl: | 3.7% (63) |
| Colorado: | 4.0% (21,689) |
| Ken Caryl: | 3.6% (62) |
| Colorado: | 0.4% (1,985) |
| Ken Caryl: | 3.5% (60) |
| Colorado: | 0.3% (1,615) |
| Ken Caryl: | 2.8% (47) |
| Colorado: | 0.3% (1,640) |
| Ken Caryl: | 2.3% (39) |
| Colorado: | 2.5% (13,706) |
| Ken Caryl: | 1.9% (33) |
| Colorado: | 0.6% (3,144) |
| Ken Caryl: | 1.9% (32) |
| Colorado: | 1.1% (5,971) |
| Ken Caryl: | 1.8% (30) |
| Colorado: | 0.4% (1,938) |
| Ken Caryl: | 1.7% (29) |
| Colorado: | 0.5% (2,651) |
| Ken Caryl: | 1.5% (26) |
| Colorado: | 0.8% (4,267) |
Place of birth for U.S.-born residents:
- This state: 15,091
- Other state: 16,245
- Northeast: 2,676
- Midwest: 5,559
- South: 3,210
- West: 4,789
87.4% of Ken Caryl residents lived in the same house 1 years ago.
Out of people who lived in different houses, 26.2% lived in this county.
Out of people who lived in different counties, 51.9% lived in Colorado.
| Ken Caryl: | 87.4% |
| State average: | 83.6% |
Education attainment for males 25 years and older:
- No schooling: 43
- Nursery to 4th grade: 0
- 5th and 6th grade: 0
- 7th and 8th grade: 30
- 9th grade: 24
- 10th grade: 91
- 11th grade: 55
- 12th grade, no diploma: 129
- High school graduate (or equivalency): 1,916
- Less than 1 year of college: 764
- Some college more than 1 year, no degree: 2,115
- Associate degree: 1,313
- Bachelor's degree: 3,916
- Master's degree: 1,568
- Professional school degree: 255
- Doctorate degree: 114

Education attainment for females 25 years and older:
- No schooling: 64
- Nursery to 4th grade: 0
- 5th and 6th grade: 3
- 7th and 8th grade: 16
- 9th grade: 44
- 10th grade: 42
- 11th grade: 53
- 12th grade, no diploma: 96
- High school graduate (or equivalency): 1,809
- Less than 1 year of college: 718
- Some college more than 1 year, no degree: 1,495
- Associate degree: 959
- Bachelor's degree: 4,220
- Master's degree: 1,991
- Professional school degree: 167
- Doctorate degree: 132


Housing units in structures:
- One, detached: 8,864
- One, attached: 2,603
- Two: 39
- 3 or 4: 215
- 5 to 9: 555
- 10 to 19: 955
- 20 to 49: 641
- 50 or more: 190
- Mobile homes: 18
- Boats, RVs, vans, etc.: 17
Housing units lacking complete kitchen facilities in 2022: 0.3%
House/condo owner moved in on average 10 years ago
Renter moved in on average 4 years ago

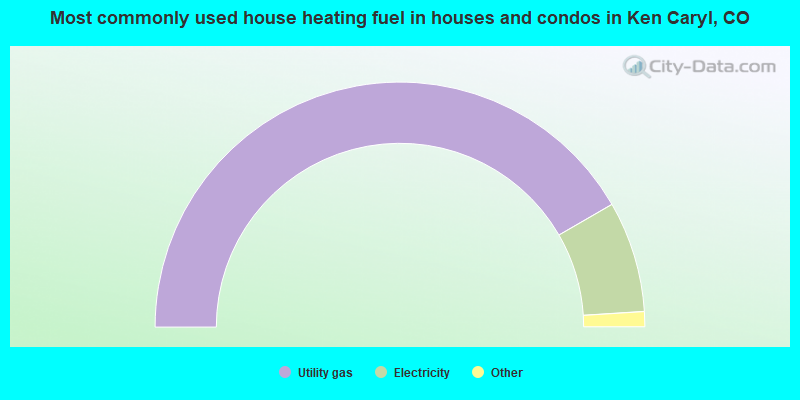
- 83.4%Utility gas
- 14.7%Electricity
- 0.6%Bottled, tank, or LP gas
- 0.4%Other fuel
- 0.3%Solar energy
- 0.3%No fuel used
- 0.2%Wood
- 0.1%Fuel oil, kerosene, etc.
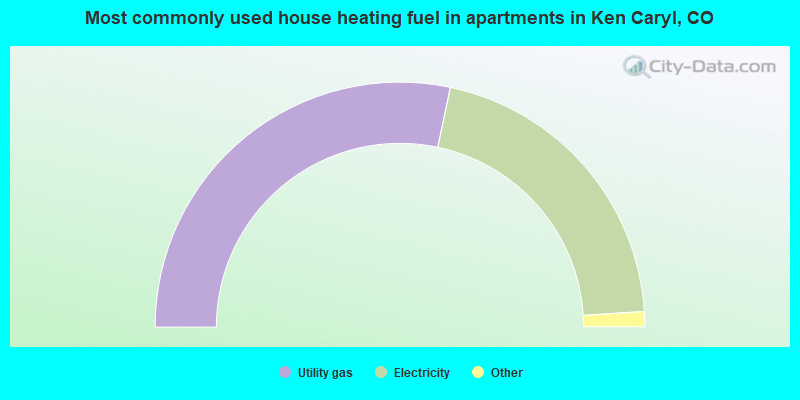
- 56.6%Utility gas
- 41.4%Electricity
- 0.8%No fuel used
- 0.7%Bottled, tank, or LP gas
- 0.4%Wood
Private vs. public school enrollment:
| Here: | 8.2% |
| Colorado: | 11.4% |
| Here: | 8.9% |
| Colorado: | 8.5% |
| Here: | 18.2% |
| Colorado: | 14.0% |


