Jupiter, FL (Florida) Houses and Residents
| Jupiter: | $584,236 |
| Florida: | $354,100 |
Mean price in 2022:
Detached houses: $1,058,593
Here: $1,058,593 State: $500,941 Townhouses or other attached units: $495,489
Here: $495,489 State: $370,869 In 2-unit structures: $954,533
Here: $954,533 State: $423,188 In 3-to-4-unit structures: $429,935
Here: $429,935 State: $309,944 In 5-or-more-unit structures: $514,926
Here: $514,926 State: $447,145 Mobile homes: $246,416
Here: $246,416 State: $113,202
Total population: 60,681 (Urban population: 39,314, Rural population: 0)
Houses: 31,728 (25,455 occupied: 19,965 owner occupied, 5,805 renter occupied)
| % of renters here: | 23% |
| State: | 33% |
Housing density: 1,587 houses/condos per square mile
Median price asked for vacant for-sale houses and condos in 2022: $765,024.
Median contract rent in 2022: $1,980 (lower quartile is $1,466, upper quartile is over $2,000)
Median rent asked for vacant for-rent units in 2022: $3,354
Median gross rent in Jupiter, FL in 2022: over $2,000
Housing units in Jupiter with a mortgage: 11,845 (1,317 second mortgage, 3 home equity loan, 1,003 both second mortgage and home equity loan)
Houses without a mortgage: 514
Median household income for houses/condos with a mortgage: $132,204
Median household income for apartments without a mortgage: $88,857
Median monthly housing costs: $1,847
Compare current foreclosures in Jupiter, FL:
| Photo | Address | Area | Beds / Baths | Price | Details |
|---|---|---|---|---|---|

|
#1
Chancellor Dr Apt 23
Jupiter, FL 33458
|
1,454 sq. feet
|
3 baths 3 beds |
show details | |

|
#2
SE Island Dr
Jupiter, FL 33469
|
3,022 sq. feet
|
3 baths 4 beds |
show details | |

|
#3
152nd Rd N
Jupiter, FL 33478
|
1,272 sq. feet
|
2 baths 3 beds |
show details | |

|
#4
Alexander Run
Jupiter, FL 33478
|
2,549 sq. feet
|
2 baths 3 beds |
show details | |

|
#5
SE Courtview Cir
Jupiter, FL 33469
|
1,626 sq. feet
|
2 baths 2 beds |
show details | |

|
#6
Oriole Cir
Jupiter, FL 33458
|
3,286 sq. feet
|
3 baths 5 beds |
show details | |

|
#7
Magnolia Way
Jupiter, FL 33469
|
2,371 sq. feet
|
3 baths 3 beds |
show details | |

|
#8
Spyglass Ln
Jupiter, FL 33477
|
4,622 sq. feet
|
7 baths 5 beds |
show details | |

|
#9
179th Ct N
Jupiter, FL 33478
|
2,132 sq. feet
|
3 baths 3 beds |
show details | |

|
#10
158th St N
Jupiter, FL 33478
|
2,667 sq. feet
|
3 baths 4 beds |
show details |
| Photo | Address | Area | Beds / Baths | Price | Details |
|---|---|---|---|---|---|

|
#11
98th Trl N
Jupiter, FL 33478
|
2,548 sq. feet
|
2 baths 3 beds |
show details | |

|
#12
Wingfoot Dr Apt D
Jupiter, FL 33458
|
1,387 sq. feet
|
2 baths 2 beds |
show details | |

|
#13
129th Pl N
Jupiter, FL 33478
|
2,472 sq. feet
|
3 baths 4 beds |
show details | |

|
#14
N Village Way
Jupiter, FL 33458
|
2,775 sq. feet
|
4 baths 4 beds |
show details | |

|
#15
Bent Arrow Dr
Jupiter, FL 33458
|
1,188 sq. feet
|
2 baths 2 beds |
show details | |

|
#16
Sunfish Ln
Jupiter, FL 33477
|
1,756 sq. feet
|
2 baths 2 beds |
show details | |

|
#17
Seashore Dr
Jupiter, FL 33477
|
1,889 sq. feet
|
2 baths 3 beds |
show details | |

|
#18
Launch Club Cir
Jupiter, FL 33458
|
1,159 sq. feet
|
2 baths 3 beds |
show details | |

|
#19
Caravelle Dr
Jupiter, FL 33458
|
2,947 sq. feet
|
4 baths 5 beds |
show details | |

|
#20
Thrush Dr
Jupiter, FL 33458
|
1,092 sq. feet
|
2 baths 3 beds |
show details |
| Photo | Address | Area | Beds / Baths | Price | Details |
|---|---|---|---|---|---|

|
#21
Helios Dr Apt 106
Jupiter, FL 33477
|
1,893 sq. feet
|
2 baths 3 beds |
show details | |

|
#22
Jupiter Farms Rd
Jupiter, FL 33478
|
3,266 sq. feet
|
4 baths 5 beds |
show details | |

|
#23
Lighthouse Dr
Jupiter, FL 33469
|
4,103 sq. feet
|
6 baths 4 beds |
show details | |

|
#24
2nd St
Jupiter, FL 33458
|
884 sq. feet
|
1 baths 2 beds |
show details | |

|
#25
121st Ter N
Jupiter, FL 33478
|
1,344 sq. feet
|
2 baths 3 beds |
show details | |

|
#26
Ocean Grande Blvd Apt 703
Jupiter, FL 33477
|
2,362 sq. feet
|
2 baths 2 beds |
show details | |

|
#27
S Seas Dr Apt 105
Jupiter, FL 33477
|
1,385 sq. feet
|
2 baths 2 beds |
show details | |

|
#28
SE Robert Dr
Jupiter, FL 33469
|
1,272 sq. feet
|
2 baths 3 beds |
show details | |

|
#29
Seabreeze Cir
Jupiter, FL 33477
|
1,620 sq. feet
|
2 baths 3 beds |
show details | |

|
#30
Jupiter Lakes Blvd Apt 2133a
Jupiter, FL 33458
|
1,102 sq. feet
|
2 baths 3 beds |
show details |
| Photo | Address | Area | Beds / Baths | Price | Details |
|---|---|---|---|---|---|

|
#31
Bay St
Jupiter, FL 33477
|
2,009 sq. feet
|
2 baths 2 beds |
show details | |

|
#32
Captains Way
Jupiter, FL 33477
|
1,866 sq. feet
|
2 baths 2 beds |
show details | |

|
#33
Randolph Siding Rd
Jupiter, FL 33478
|
11,444 sq. feet
|
2 baths 3 beds |
show details | |

|
#34
SE Wood Haven Ln Apt D
Jupiter, FL 33469
|
1,230 sq. feet
|
3 baths 2 beds |
show details | |

|
#35
2nd St
Jupiter, FL 33458
|
1,754 sq. feet
|
2 baths 4 beds |
show details | |

|
#36
Sioux St
Jupiter, FL 33458
|
1,204 sq. feet
|
2 baths 3 beds |
show details | |

|
#37
Hemlock Ln
Jupiter, FL 33469
|
1,777 sq. feet
|
3 baths 3 beds |
show details | |

|
#38
Riverwalk Ln Unit 4
Jupiter, FL 33458
|
1,564 sq. feet
|
2 baths 3 beds |
show details | |

|
#39
Fairway Dr N
Jupiter, FL 33477
|
1,195 sq. feet
|
2 baths 2 beds |
show details | |

|
#40
County Line Rd Apt 8a
Jupiter, FL 33469
|
1,325 sq. feet
|
2 baths 2 beds |
show details |
| Photo | Address | Area | Beds / Baths | Price | Details |
|---|---|---|---|---|---|

|
#41
SE Wood Haven Ln Apt H
Jupiter, FL 33469
|
1,230 sq. feet
|
3 baths 2 beds |
show details | |

|
#42
Jupiter Woods Dr
Jupiter, FL 33458
|
1,521 sq. feet
|
2 baths 4 beds |
show details | |

|
#43
Pawnee St
Jupiter, FL 33458
|
1,232 sq. feet
|
2 baths 3 beds |
show details | |

|
#44
N Pennock Ln
Jupiter, FL 33458
|
1,498 sq. feet
|
1 baths 4 beds |
show details | |

|
#45
Lauderdale St
Jupiter, FL 33458
|
1,693 sq. feet
|
2 baths 3 beds |
show details | |

|
#46
Grande Cull Way
Jupiter, FL 33458
|
1,938 sq. feet
|
2 baths 2 beds |
show details | |

|
#47
Felter St
Jupiter, FL 33458
|
1,352 sq. feet
|
2 baths 3 beds |
show details | |

|
#48
SE Ranch Acres Cir
Jupiter, FL 33478
|
2,573 sq. feet
|
3 baths 4 beds |
show details | |

|
#49
Cinder Dunes Pt
Jupiter, FL 33478
|
4,885 sq. feet
|
5 baths 4 beds |
show details | |

|
Check over 1 million property listings on Foreclosure.com!
|
browse all offers | |||

Latest news about housing in Jupiter, FL collected exclusively by city-data.com from local newspapers, TV, and radio stations

 | buying a condo/apartment/townhome in Jupiter/tequesta area and 2 dogs (9 replies) |
| Jupiter reasonable housing for 3 adults retired (5 replies) |
| House vs. Condo in PBG/Jupiter (19 replies) |
| Prado Development by Standard Pacific Homes in Jupiter (1 reply) |
| Recommend RE agency or RE agent(s) for Jupiter up to Stuart (4 replies) |
| Jupiter rental (9 replies) |

Median year apartment built: 1992
Household type by relationship:
Households: 61,890- Male householders: 13,221 (3,065 living alone), Female householders: 12,189 (4,513 living alone)
13,197 spouses (13,157 opposite-sex spouses), 1,538 unmarried partners, (1,473 opposite-sex unmarried partners), 16,341 children (15,479 natural, 342 adopted, 520 stepchildren), 611 grandchildren, 953 brothers or sisters, 652 parents, 0 foster children, 800 other relatives, 1,690 non-relatives
- In group quarters: 693
Size of family households: 8,371 2-persons, 3,517 3-persons, 3,202 4-persons, 624 5-persons, 261 6-persons, 268 7-or-more-persons.
Size of nonfamily households: 7,794 1-person, 1,486 2-persons, 85 3-persons, 53 4-persons, 70 5-persons.
8,631 married couples with children.
2,010 single-parent households (479 men, 1,531 women).
81.4% of residents of Jupiter speak English at home.
12.4% of residents speak Spanish at home (56% speak English very well, 17% speak English well, 8% speak English not well, 18% don't speak English at all).
4.2% of residents speak other Indo-European language at home (83% speak English very well, 11% speak English well, 5% speak English not well, 1% don't speak English at all).
1.0% of residents speak Asian or Pacific Island language at home (53% speak English very well, 22% speak English well, 25% speak English not well).
1.0% of residents speak other language at home (39% speak English very well, 2% speak English well, 20% speak English not well, 40% don't speak English at all).
Foreign born population: 9,397 (15.2%)
(53.8% of them are naturalized citizens)
| Here: | 5.9 |
| State: | 5.9 |
| Here: | 4.1 |
| State: | 4.2 |

- Bedrooms in owner-occupied houses and condos in Jupiter, Florida
- 26no bedroom
- 2471 bedroom
- 5,5442 bedrooms
- 9,1663 bedrooms
- 3,5904 bedrooms
- 1,3935+ bedrooms

- Bedrooms in renter-occupied apartments in Jupiter, Florida
- 27no bedroom
- 1,0411 bedroom
- 3,0532 bedrooms
- 1,3543 bedrooms
- 2854 bedrooms
- 465+ bedrooms

- Cars and other vehicles available in Jupiter in owner-occupied houses/condos
- 411no vehicle
- 7,1361 vehicle
- 8,5442 vehicles
- 3,1183 vehicles
- 5864 vehicles
- 1715+ vehicles

- Cars and other vehicles available in Jupiter in renter-occupied apartments
- 486no vehicle
- 2,5411 vehicle
- 2,1992 vehicles
- 4213 vehicles
- 1594 vehicles
- 05+ vehicles

- Rooms in owner-occupied houses in Jupiter, Florida
- 01 room
- 1242 rooms
- 7013 rooms
- 3,2844 rooms
- 4,7265 rooms
- 3,9486 rooms
- 2,9497 rooms
- 1,9218 rooms
- 2,3149+ rooms

- Rooms in renter-occupied apartments in Jupiter, Florida
- 271 room
- 4832 rooms
- 1,2263 rooms
- 1,6644 rooms
- 1,3135 rooms
- 5416 rooms
- 3517 rooms
- 1208 rooms
- 819+ rooms


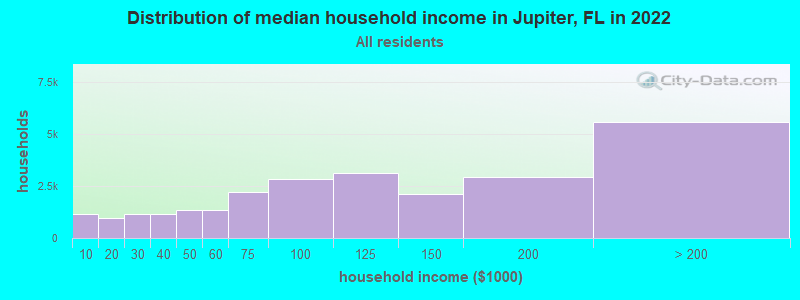
Jupiter, FL household income distribution

- 1,170Less than $10,000
- 979$10,000 to $19,999
- 1,164$20,000 to $29,999
- 1,173$30,000 to $39,999
- 1,328$40,000 to $49,999
- 1,352$50,000 to $59,999
- 2,198$60,000 to $74,999
- 2,835$75,000 to $99,999
- 3,130$100,000 to $124,999
- 2,089$125,000 to $149,999
- 2,908$150,000 to $199,999
- 5,561$200,000 or more
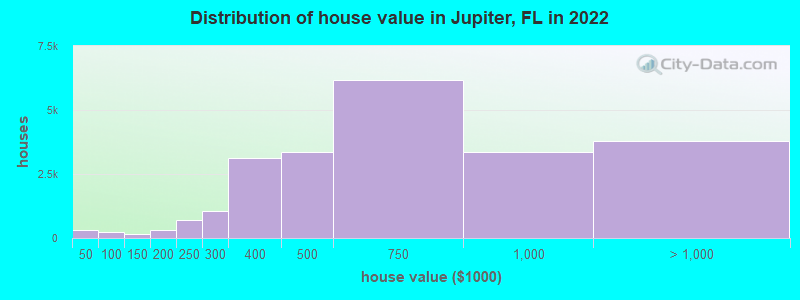
Home value of owner - occupied houses in 2022 in Jupiter, FL
-
- 107Less than $10,000
- 33$20,000 to $24,999
- 10$25,000 to $29,999
- 68$35,000 to $39,999
- 87$40,000 to $49,999
- 132$50,000 to $59,999
- 19$80,000 to $89,999
- 140$100,000 to $124,999
- 11$125,000 to $149,999
- 124$150,000 to $174,999
- 194$175,000 to $199,999
- 708$200,000 to $249,999
- 1,058$250,000 to $299,999
- 3,109$300,000 to $399,999
- 3,359$400,000 to $499,999
- 6,165$500,000 to $749,999
- 3,366$750,000 to $999,999
- 2,028$1,000,000 to $1,499,999
- 548$1,500,000 to $1,999,999
- 1,224$2,000,000 or more
Rent paid by renters in 2022 in Jupiter, FL
-
- 7Less than $100
- 11$100 to $149
- 35$150 to $199
- 116$200 to $249
- 15$250 to $299
- 18$300 to $349
- 9$400 to $449
- 25$450 to $499
- 31$500 to $549
- 81$550 to $599
- 15$650 to $699
- 41$750 to $799
- 152$800 to $899
- 29$900 to $999
- 224$1,000 to $1,249
- 574$1,250 to $1,499
- 1,489$1,500 to $1,999
- 1,449$2,000 to $2,499
- 928$2,500 to $2,999
- 329$3,000 to $3,499
- 287$3,500 or more
- 283No cash rent


Percentage of workers working in this county: 93.2%
Number of people working at home: 5,369 (17.6% of all workers)
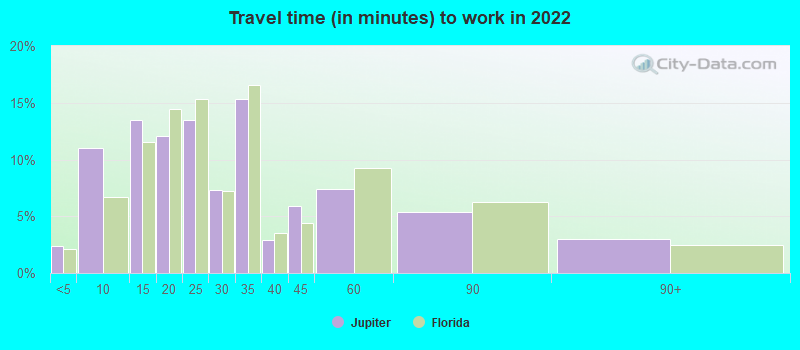
Travel time to work (commute)
- Less than 5 minutes: 661
- 5 to 9 minutes: 3,225
- 10 to 14 minutes: 3,786
- 15 to 19 minutes: 4,377
- 20 to 24 minutes: 4,215
- 25 to 29 minutes: 2,626
- 30 to 34 minutes: 2,886
- 35 to 39 minutes: 379
- 40 to 44 minutes: 667
- 45 to 59 minutes: 1,256
- 60 to 89 minutes: 626
- 90 or more minutes: 579
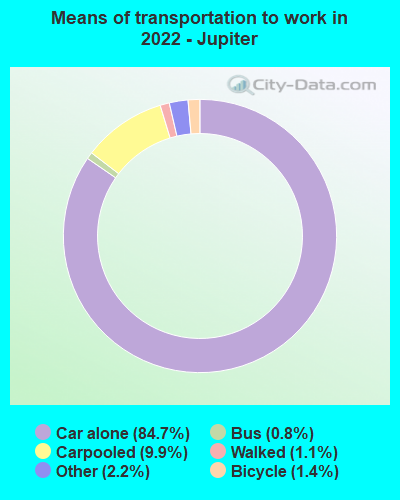
Means of transportation to work:
- Drove a car alone: 26,958 (72.7%)
- Carpooled: 3,000 (8.1%)
- Bus: 179 (0.5%)
- Taxi: 823 (2.2%)
- Bicycle: 448 (1.2%)
- Walked: 378 (1.0%)
- Worked at home: 5,369 (14.5%)

- Unemployment by race in 2022
- Unemployment rate for White non-Hispanic residents
- 2.8%Males
- 2.8%Females
- Unemployment rate for Asian residents
- 11.9%Females
- Unemployment rate for other race residents
- 1.7%Males
- Unemployment rate for two or more race residents
- 2.8%Males
- 6.0%Females
- Unemployment rate for Hispanic or Latino residents
- 2.3%Males
- 4.0%Females

- Year of entry for the foreign-born population in Jupiter, Florida
- 2,2742010 or later
- 1,9722000 to 2009
- 2,6431990 to 1999
- 7761980 to 1989
- 5381970 to 1979
- 1,083Before 1970

First ancestries reported:
- American: 3,226 (11.5%)
- Italian: 3,052 (10.9%)
- Irish: 3,031 (10.8%)
- German: 1,921 (6.9%)
- English: 1,604 (5.7%)
- European: 802 (2.9%)
- Polish: 582 (2.1%)
- Russian: 537 (1.9%)
- Eastern European: 412 (1.5%)
- Greek: 314 (1.1%)
- French: 288 (1.0%)
- French Canadian: 283 (1.0%)
- Scottish: 263 (0.9%)
- Czech: 224 (0.8%)
- Hungarian: 213 (0.8%)
- Swedish: 210 (0.8%)
- Canadian: 184 (0.7%)
- Portuguese: 181 (0.6%)
- Albanian: 175 (0.6%)
- Norwegian: 165 (0.6%)
- Ukrainian: 146 (0.5%)
- Scotch-Irish: 146 (0.5%)
- Belgian: 129 (0.5%)
- Brazilian: 126 (0.5%)
- Jamaican: 125 (0.4%)
- Dutch: 122 (0.4%)
- Haitian: 116 (0.4%)
- British: 110 (0.4%)
- Iranian: 92 (0.3%)
- Scandinavian: 89 (0.3%)
- Slovak: 77 (0.3%)
- Czechoslovakian: 73 (0.3%)
- Austrian: 72 (0.3%)
- Danish: 60 (0.2%)
- Finnish: 56 (0.2%)
- Romanian: 50 (0.2%)
- Lebanese: 48 (0.2%)
- Swiss: 41 (0.1%)
- Northern European: 38 (0.1%)
- Israeli: 34 (0.1%)
- Croatian: 34 (0.1%)
- Welsh: 30 (0.1%)
- Lithuanian: 26 (0.09%)
- Latvian: 23 (0.08%)
- Syrian: 23 (0.08%)
- Egyptian: 21 (0.08%)
- African: 19 (0.07%)
- West Indian: 18 (0.06%)
- Armenian: 11 (0.04%)
- Bahamian: 11 (0.04%)
- Australian: 10 (0.04%)
- Macedonian: 9 (0.03%)
- Alsatian: 9 (0.03%)
- Turkish: 7 (0.03%)
- Moroccan: 6 (0.02%)
Most common places of birth for foreign-born residents (%):
| Jupiter: | 21.6% (2,034) |
| Florida: | 2.1% (97,632) |
| Jupiter: | 9.9% (933) |
| Florida: | 5.6% (257,152) |
| Jupiter: | 5.9% (551) |
| Florida: | 1.2% (54,585) |
| Jupiter: | 5.3% (498) |
| Florida: | 6.5% (298,669) |
| Jupiter: | 5.2% (488) |
| Florida: | 2.4% (109,132) |
| Jupiter: | 4.2% (394) |
| Florida: | 5.7% (262,042) |
| Jupiter: | 2.9% (268) |
| Florida: | 2.7% (122,906) |
| Jupiter: | 2.7% (258) |
| Florida: | 22.0% (1,006,576) |
| Jupiter: | 2.5% (232) |
| Florida: | 2.1% (94,349) |
| Jupiter: | 2.3% (215) |
| Florida: | 0.2% (9,779) |
| Jupiter: | 2.2% (209) |
| Florida: | 0.4% (20,008) |
| Jupiter: | 2.1% (199) |
| Florida: | 2.1% (96,693) |
| Jupiter: | 2.1% (194) |
| Florida: | 1.2% (56,071) |
| Jupiter: | 1.8% (172) |
| Florida: | 1.8% (84,403) |
| Jupiter: | 1.7% (164) |
| Florida: | 1.2% (54,272) |
| Jupiter: | 1.7% (157) |
| Florida: | 0.7% (31,076) |
Place of birth for U.S.-born residents:
- This state: 18,208
- Other state: 32,538
- Northeast: 18,256
- Midwest: 6,753
- South: 5,410
- West: 2,099
88.3% of Jupiter residents lived in the same house 1 years ago.
Out of people who lived in different houses, 29.0% lived in this county.
Out of people who lived in different counties, 32.4% lived in Florida.
| Jupiter: | 88.3% |
| State average: | 86.3% |
Education attainment for males 25 years and older:
- No schooling: 521
- Nursery to 4th grade: 84
- 5th and 6th grade: 410
- 7th and 8th grade: 217
- 9th grade: 48
- 10th grade: 89
- 11th grade: 80
- 12th grade, no diploma: 69
- High school graduate (or equivalency): 3,259
- Less than 1 year of college: 1,177
- Some college more than 1 year, no degree: 2,081
- Associate degree: 2,122
- Bachelor's degree: 7,216
- Master's degree: 2,388
- Professional school degree: 1,611
- Doctorate degree: 593

Education attainment for females 25 years and older:
- No schooling: 412
- Nursery to 4th grade: 16
- 5th and 6th grade: 339
- 7th and 8th grade: 138
- 9th grade: 48
- 10th grade: 183
- 11th grade: 116
- 12th grade, no diploma: 206
- High school graduate (or equivalency): 4,211
- Less than 1 year of college: 1,339
- Some college more than 1 year, no degree: 2,315
- Associate degree: 2,484
- Bachelor's degree: 7,238
- Master's degree: 3,637
- Professional school degree: 868
- Doctorate degree: 327


Housing units in structures:
- One, detached: 14,321
- One, attached: 4,910
- Two: 473
- 3 or 4: 2,792
- 5 to 9: 2,420
- 10 to 19: 1,816
- 20 to 49: 2,477
- 50 or more: 2,384
- Mobile homes: 132
Median worth of mobile homes: $368,002
Housing units lacking complete kitchen facilities in 2022: 0.8%
House/condo owner moved in on average 9 years ago
Renter moved in on average 4 years ago

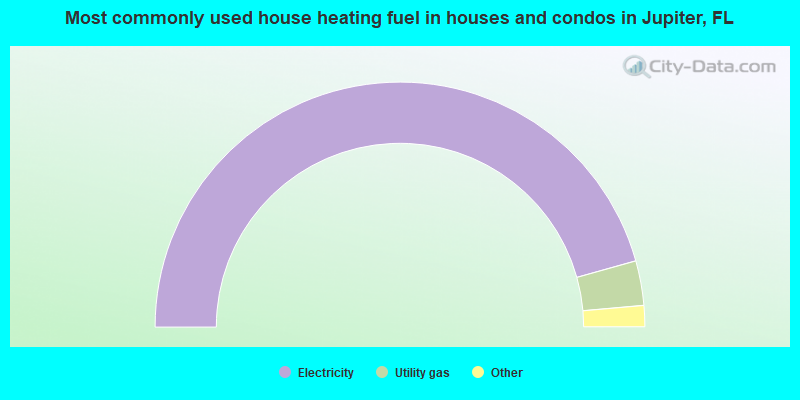
- 91.3%Electricity
- 5.9%Utility gas
- 2.1%No fuel used
- 0.4%Bottled, tank, or LP gas
- 0.2%Fuel oil, kerosene, etc.
- 0.2%Solar energy
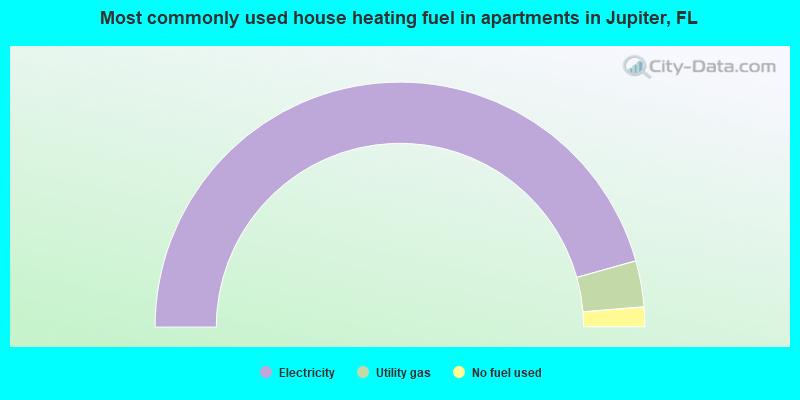
- 91.3%Electricity
- 6.1%Utility gas
- 2.6%No fuel used
Private vs. public school enrollment:
| Here: | 21.2% |
| Florida: | 15.8% |
| Here: | 14.3% |
| Florida: | 12.9% |
| Here: | 22.4% |
| Florida: | 23.6% |


