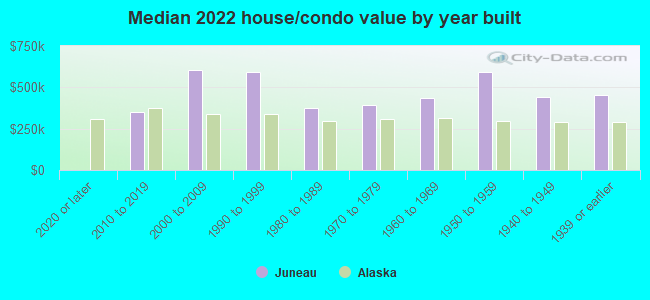
Juneau, AK (Alaska) Houses and Residents
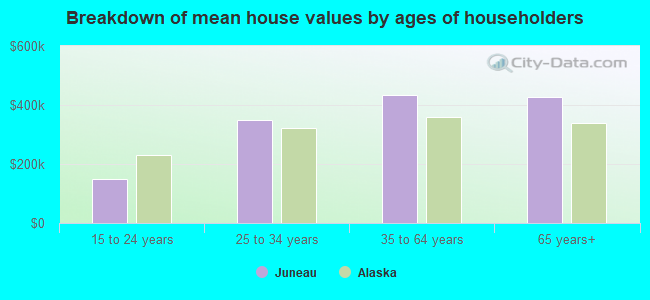
| Juneau: | $428,647 |
| Alaska: | $336,900 |
Mean price in 2022:
Detached houses: $508,578
Here: $508,578 State: $371,009 Townhouses or other attached units: $369,285
Here: $369,285 State: $298,041 In 2-unit structures: $447,083
Here: $447,083 State: $345,335 In 3-to-4-unit structures: $241,251
Here: $241,251 State: $302,340 In 5-or-more-unit structures: $239,954
Here: $239,954 State: $187,490 Mobile homes: $80,163
Here: $80,163 State: $72,602
Total population: 32,406 (Urban population: 25,074 (all inside urban clusters), Rural population: 5,637 (44 farm, 5,593 nonfarm))
Houses: 14,201 (13,135 occupied: 8,687 owner occupied, 4,831 renter occupied)
| % of renters here: | 36% |
| State: | 34% |
Housing density: 5 houses/condos per square mile
Median price asked for vacant for-sale houses and condos in 2022: $237,868.
Median contract rent in 2022: $1,294 (lower quartile is $989, upper quartile is $1,707)
Median rent asked for vacant for-rent units in 2022: $1,266
Median gross rent in Juneau, AK in 2022: $1,446
Housing units in Juneau with a mortgage: 5,466 (272 second mortgage, 9 home equity loan, 203 both second mortgage and home equity loan)
Houses without a mortgage: 162
Median household income for houses/condos with a mortgage: $123,969
Median household income for apartments without a mortgage: $87,656
Median monthly housing costs: $1,511
Compare current foreclosures near Juneau, AK:
| Photo | Address | Area | Beds / Baths | Price | Details |
|---|---|---|---|---|---|

|
#1
Sunset St
Juneau, AK 99801
|
1,824 sq. feet
|
2 baths 4 beds |
show details | |

|
#2
Linda Ave
Juneau, AK 99801
|
1,726 sq. feet
|
2 baths 3 beds |
show details | |

|
#3
Glacier Hwy
Juneau, AK 99801
|
1,672 sq. feet
|
2 baths 2 beds |
show details | |

|
#4
Behrends Ave
Juneau, AK 99801
|
877 sq. feet
|
1 baths 2 beds |
show details | |

|
#5
Edwin Pl, C O Collin Rielly
Juneau, AK 99801
|
1,008 sq. feet
|
1 baths 2 beds |
show details | |

|
#6
Gee St
Juneau, AK 99801
|
1,008 sq. feet
|
1 baths 3 beds |
show details | |

|
#7
Marguerite St
Juneau, AK 99801
|
2,304 sq. feet
|
3 baths 5 beds |
show details | |

|
#8
Berners Ave
Juneau, AK 99801
|
1,140 sq. feet
|
1 baths 3 beds |
show details | |

|
#9
Julep St
Juneau, AK 99801
|
1,732 sq. feet
|
2 baths 3 beds |
show details | |

|
#10
Stephen Richards Memorial Dr
Juneau, AK 99801
|
1,412 sq. feet
|
2 baths 3 beds |
show details |
| Photo | Address | Area | Beds / Baths | Price | Details |
|---|---|---|---|---|---|

|
#11
Riverside Dr
Juneau, AK 99801
|
- sq. feet
|
- baths - beds |
show details | |

|
#12
Douglas Hwy
Juneau, AK 99801
|
- sq. feet
|
- baths - beds |
show details | |

|
Check over 1 million property listings on Foreclosure.com!
|
browse all offers | |||


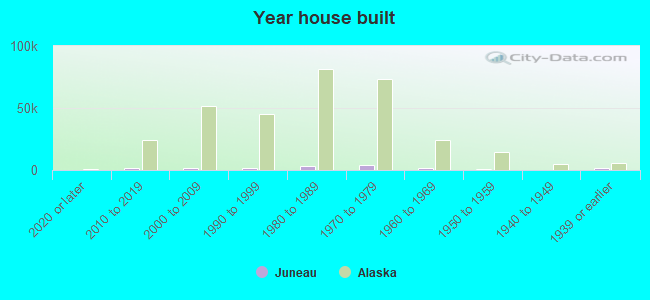
Median year apartment built: 1981
Household type by relationship:
Households: 32,053- Male householders: 6,203 (2,143 living alone), Female householders: 6,791 (2,215 living alone)
5,942 spouses (5,896 opposite-sex spouses), 1,014 unmarried partners, (944 opposite-sex unmarried partners), 8,350 children (7,999 natural, 197 adopted, 153 stepchildren), 389 grandchildren, 158 brothers or sisters, 473 parents, 109 foster children, 468 other relatives, 1,544 non-relatives
- In group quarters: 606
Size of family households: 3,626 2-persons, 1,625 3-persons, 1,405 4-persons, 516 5-persons, 320 6-persons, 181 7-or-more-persons.
Size of nonfamily households: 4,579 1-person, 1,228 2-persons, 28 3-persons, 49 4-persons, 11 5-persons, 14 6-persons.
4,583 married couples with children.
1,293 single-parent households (508 men, 785 women).
89.1% of residents of Juneau speak English at home.
3.2% of residents speak Spanish at home (74% speak English very well, 16% speak English well, 1% speak English not well, 8% don't speak English at all).
0.7% of residents speak other Indo-European language at home (98% speak English very well, 2% speak English well).
5.7% of residents speak Asian or Pacific Island language at home (59% speak English very well, 27% speak English well, 14% speak English not well).
1.6% of residents speak other language at home (65% speak English very well, 34% speak English well, 1% speak English not well).
Foreign born population: 2,581 (8.1%)
(71.2% of them are naturalized citizens)
| Here: | 5.6 |
| State: | 5.6 |
| Here: | 3.8 |
| State: | 3.9 |
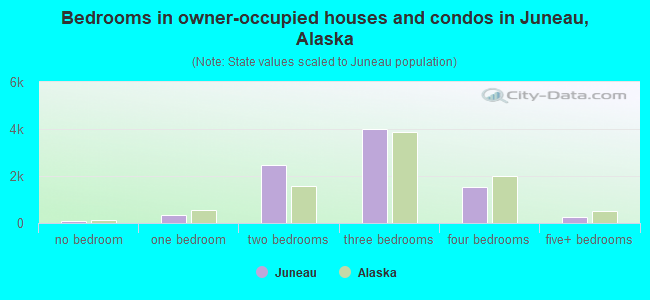
- Bedrooms in owner-occupied houses and condos in Juneau, Alaska
- 72no bedroom
- 3551 bedroom
- 2,4702 bedrooms
- 4,0033 bedrooms
- 1,5334 bedrooms
- 2555+ bedrooms
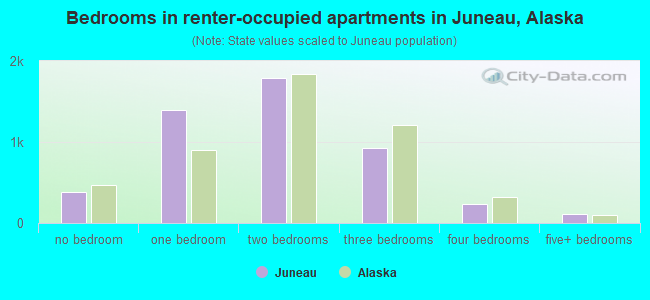
- Bedrooms in renter-occupied apartments in Juneau, Alaska
- 386no bedroom
- 1,3931 bedroom
- 1,7842 bedrooms
- 9223 bedrooms
- 2304 bedrooms
- 1165+ bedrooms
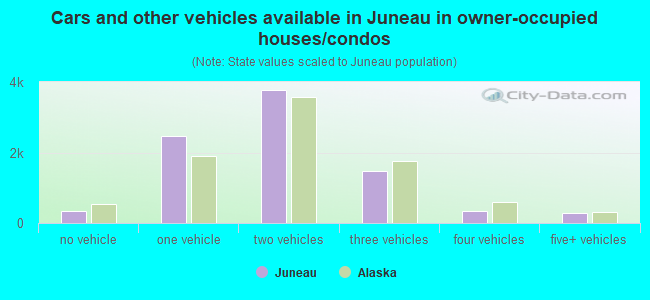
- Cars and other vehicles available in Juneau in owner-occupied houses/condos
- 346no vehicle
- 2,4751 vehicle
- 3,7802 vehicles
- 1,4813 vehicles
- 3294 vehicles
- 2765+ vehicles
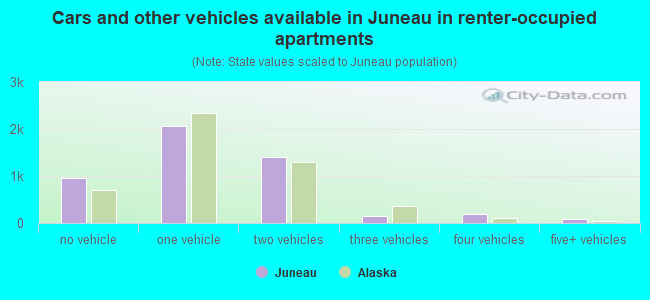
- Cars and other vehicles available in Juneau in renter-occupied apartments
- 949no vehicle
- 2,0641 vehicle
- 1,3992 vehicles
- 1523 vehicles
- 1904 vehicles
- 785+ vehicles
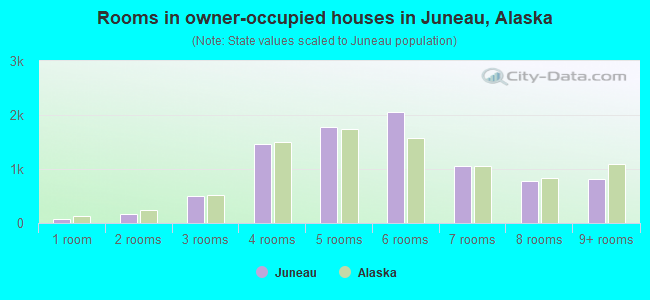
- Rooms in owner-occupied houses in Juneau, Alaska
- 691 room
- 1622 rooms
- 5093 rooms
- 1,4554 rooms
- 1,7845 rooms
- 2,0556 rooms
- 1,0557 rooms
- 7828 rooms
- 8169+ rooms
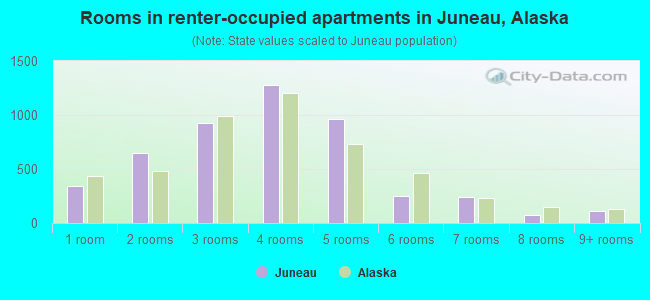
- Rooms in renter-occupied apartments in Juneau, Alaska
- 3421 room
- 6502 rooms
- 9273 rooms
- 1,2754 rooms
- 9605 rooms
- 2506 rooms
- 2427 rooms
- 768 rooms
- 1099+ rooms
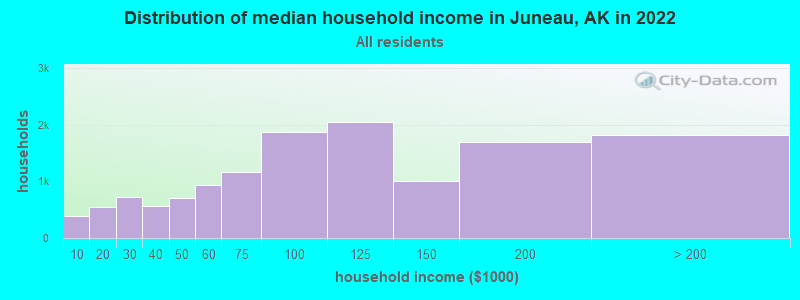
Juneau, AK household income distribution

- 397Less than $10,000
- 548$10,000 to $19,999
- 732$20,000 to $29,999
- 572$30,000 to $39,999
- 714$40,000 to $49,999
- 936$50,000 to $59,999
- 1,168$60,000 to $74,999
- 1,883$75,000 to $99,999
- 2,053$100,000 to $124,999
- 1,013$125,000 to $149,999
- 1,694$150,000 to $199,999
- 1,826$200,000 or more
Home value of owner - occupied houses in 2022 in Juneau, AK
-
- 45Less than $10,000
- 6$10,000 to $14,999
- 32$15,000 to $19,999
- 67$20,000 to $24,999
- 46$25,000 to $29,999
- 26$30,000 to $34,999
- 29$35,000 to $39,999
- 119$40,000 to $49,999
- 145$50,000 to $59,999
- 29$60,000 to $69,999
- 91$70,000 to $79,999
- 66$80,000 to $89,999
- 125$100,000 to $124,999
- 91$125,000 to $149,999
- 215$150,000 to $174,999
- 118$175,000 to $199,999
- 298$200,000 to $249,999
- 490$250,000 to $299,999
- 2,125$300,000 to $399,999
- 1,817$400,000 to $499,999
- 2,246$500,000 to $749,999
- 698$750,000 to $999,999
- 79$1,000,000 to $1,499,999
- 13$1,500,000 to $1,999,999
- 2$2,000,000 or more

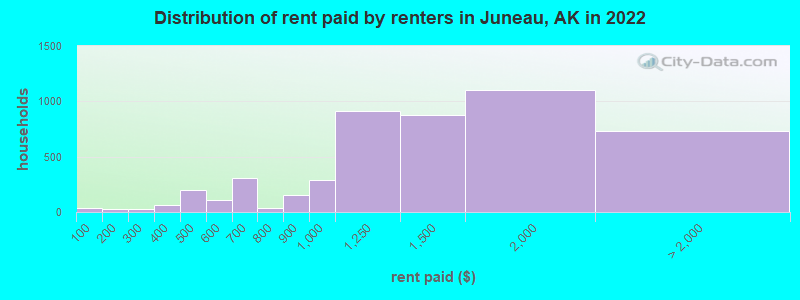
Rent paid by renters in 2022 in Juneau, AK
-
- 36Less than $100
- 22$100 to $149
- 4$150 to $199
- 8$200 to $249
- 14$250 to $299
- 59$350 to $399
- 134$400 to $449
- 67$450 to $499
- 84$500 to $549
- 25$550 to $599
- 37$600 to $649
- 266$650 to $699
- 24$700 to $749
- 11$750 to $799
- 155$800 to $899
- 289$900 to $999
- 912$1,000 to $1,249
- 872$1,250 to $1,499
- 1,099$1,500 to $1,999
- 453$2,000 to $2,499
- 31$2,500 to $2,999
- 38$3,000 to $3,499
- 20$3,500 or more
- 184No cash rent
Percentage of workers working in this county: 98.4%
Number of people working at home: 2,055 (12.3% of all workers)
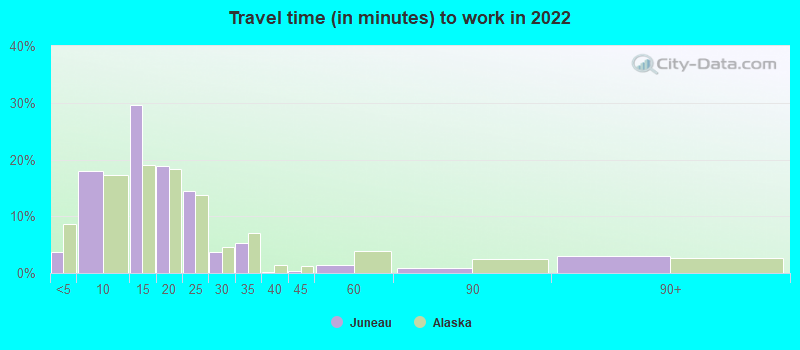
Travel time to work (commute)
- Less than 5 minutes: 545
- 5 to 9 minutes: 2,560
- 10 to 14 minutes: 4,491
- 15 to 19 minutes: 2,813
- 20 to 24 minutes: 2,271
- 25 to 29 minutes: 562
- 30 to 34 minutes: 766
- 35 to 39 minutes: 28
- 40 to 44 minutes: 51
- 45 to 59 minutes: 198
- 60 to 89 minutes: 105
- 90 or more minutes: 295
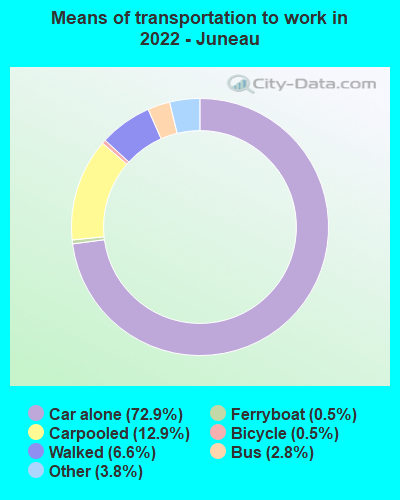
Means of transportation to work:
- Drove a car alone: 10,940 (63.9%)
- Carpooled: 2,033 (11.9%)
- Bus: 492 (2.9%)
- Ferryboat: 68 (0.4%)
- Taxi: 642 (3.8%)
- Bicycle: 43 (0.3%)
- Walked: 954 (5.6%)
- Worked at home: 2,055 (12.0%)
- Unemployment by race in 2022
- Unemployment rate for White non-Hispanic residents
- 2.7%Males
- 1.7%Females
- Unemployment rate for Black residents
- 29.2%Females
- Unemployment rate for American Indian and Alaska Native residents
- 12.6%Males
- 3.5%Females
- Unemployment rate for Asian residents
- 5.6%Females
- Unemployment rate for other race residents
- 3.1%Males
- Unemployment rate for two or more race residents
- 6.5%Males
- 2.1%Females
- Unemployment rate for Hispanic or Latino residents
- 2.4%Males
- 0.1%Females
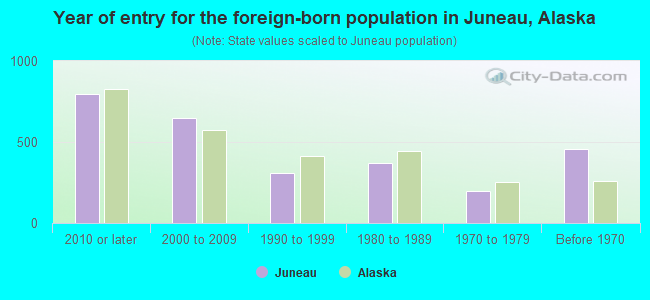
- Year of entry for the foreign-born population in Juneau, Alaska
- 7942010 or later
- 6472000 to 2009
- 3091990 to 1999
- 3691980 to 1989
- 1961970 to 1979
- 454Before 1970
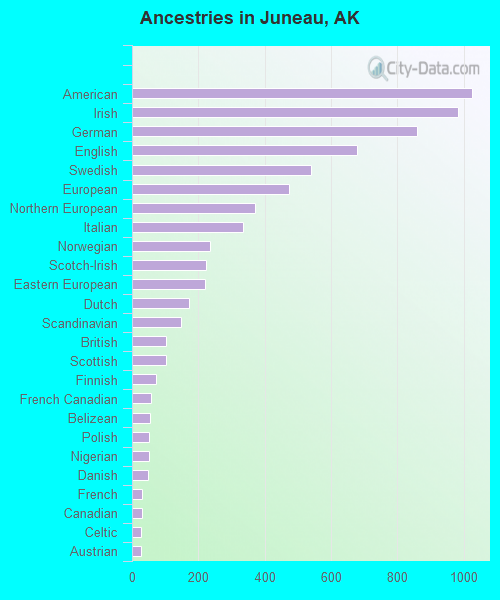
First ancestries reported:
- American: 1,025 (7.2%)
- Irish: 982 (6.9%)
- German: 859 (6.0%)
- English: 678 (4.8%)
- Swedish: 539 (3.8%)
- European: 473 (3.3%)
- Northern European: 370 (2.6%)
- Italian: 334 (2.3%)
- Norwegian: 236 (1.7%)
- Scotch-Irish: 223 (1.6%)
- Eastern European: 220 (1.5%)
- Dutch: 171 (1.2%)
- Scandinavian: 148 (1.0%)
- British: 104 (0.7%)
- Scottish: 101 (0.7%)
- Finnish: 72 (0.5%)
- French Canadian: 56 (0.4%)
- Belizean: 53 (0.4%)
- Polish: 52 (0.4%)
- Nigerian: 50 (0.4%)
- Danish: 48 (0.3%)
- French: 31 (0.2%)
- Canadian: 30 (0.2%)
- Celtic: 27 (0.2%)
- Austrian: 26 (0.2%)
- Russian: 26 (0.2%)
- Lithuanian: 22 (0.2%)
- Australian: 20 (0.1%)
- Belgian: 18 (0.1%)
- Lebanese: 16 (0.1%)
- Ukrainian: 15 (0.1%)
- Hungarian: 14 (0.10%)
- Greek: 10 (0.07%)
- Czech: 9 (0.06%)
- Yugoslavian: 7 (0.05%)
- Czechoslovakian: 6 (0.04%)
- Basque: 5 (0.04%)
- Slovak: 5 (0.04%)
- Croatian: 3 (0.02%)
- Macedonian: 2 (0.01%)
- Pennsylvania German: 2 (0.01%)
- Slovene: 2 (0.01%)
- Swiss: 2 (0.01%)
- Welsh: 1 (0.01%)
Most common places of birth for foreign-born residents (%):
| Juneau: | 44.2% (1,226) |
| Alaska: | 33.1% (19,195) |
| Juneau: | 14.4% (401) |
| Alaska: | 6.6% (3,837) |
| Juneau: | 8.4% (233) |
| Alaska: | 5.3% (3,101) |
| Juneau: | 3.9% (107) |
| Alaska: | 5.0% (2,924) |
| Juneau: | 3.0% (84) |
| Alaska: | 2.2% (1,300) |
| Juneau: | 2.1% (57) |
| Alaska: | 1.0% (599) |
| Juneau: | 2.0% (56) |
| Alaska: | 5.8% (3,384) |
| Juneau: | 1.5% (43) |
| Alaska: | 1.6% (910) |
Place of birth for U.S.-born residents:
- This state: 12,324
- Other state: 16,701
- Northeast: 1,598
- Midwest: 3,383
- South: 2,894
- West: 8,918
86.5% of Juneau residents lived in the same house 1 years ago.
Out of people who lived in different houses, 33.9% lived in this county.
Out of people who lived in different counties, 45.3% lived in Alaska.
| Juneau: | 86.5% |
| State average: | 84.8% |
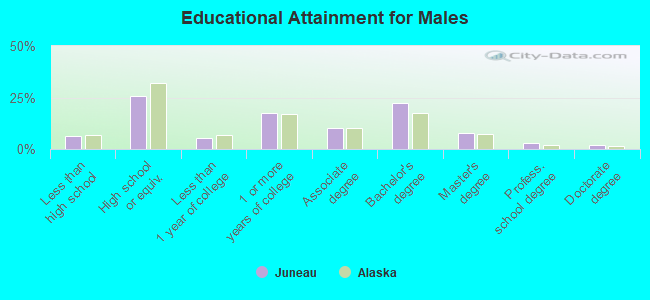
Education attainment for males 25 years and older:
- No schooling: 84
- Nursery to 4th grade: 3
- 5th and 6th grade: 0
- 7th and 8th grade: 41
- 9th grade: 26
- 10th grade: 212
- 11th grade: 242
- 12th grade, no diploma: 143
- High school graduate (or equivalency): 3,047
- Less than 1 year of college: 640
- Some college more than 1 year, no degree: 2,056
- Associate degree: 1,224
- Bachelor's degree: 2,680
- Master's degree: 947
- Professional school degree: 321
- Doctorate degree: 251
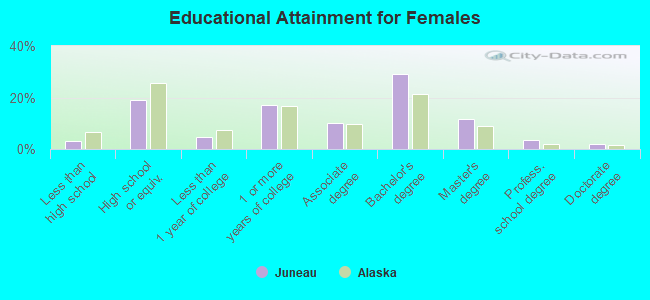
Education attainment for females 25 years and older:
- No schooling: 63
- Nursery to 4th grade: 6
- 5th and 6th grade: 62
- 7th and 8th grade: 0
- 9th grade: 7
- 10th grade: 25
- 11th grade: 90
- 12th grade, no diploma: 82
- High school graduate (or equivalency): 2,109
- Less than 1 year of college: 517
- Some college more than 1 year, no degree: 1,921
- Associate degree: 1,131
- Bachelor's degree: 3,260
- Master's degree: 1,279
- Professional school degree: 395
- Doctorate degree: 200


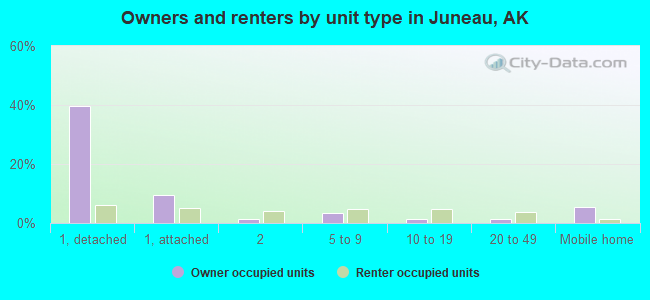
Housing units in structures:
- One, detached: 6,422
- One, attached: 2,040
- Two: 810
- 3 or 4: 730
- 5 to 9: 1,083
- 10 to 19: 801
- 20 to 49: 849
- 50 or more: 339
- Mobile homes: 1,102
- Boats, RVs, vans, etc.: 20
Median worth of mobile homes: $51,159
Housing units lacking complete kitchen facilities in 2022: 1.2%
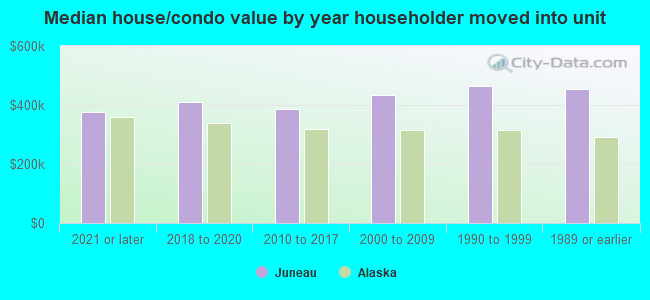
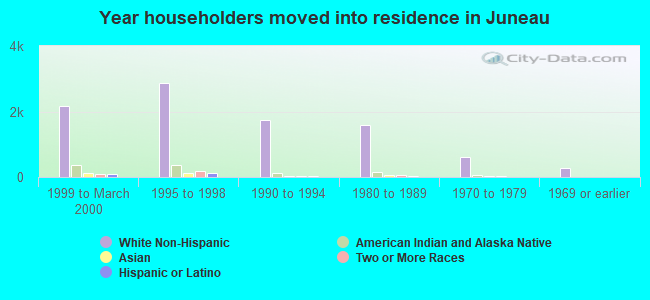
House/condo owner moved in on average 10 years ago
Renter moved in on average 3 years ago
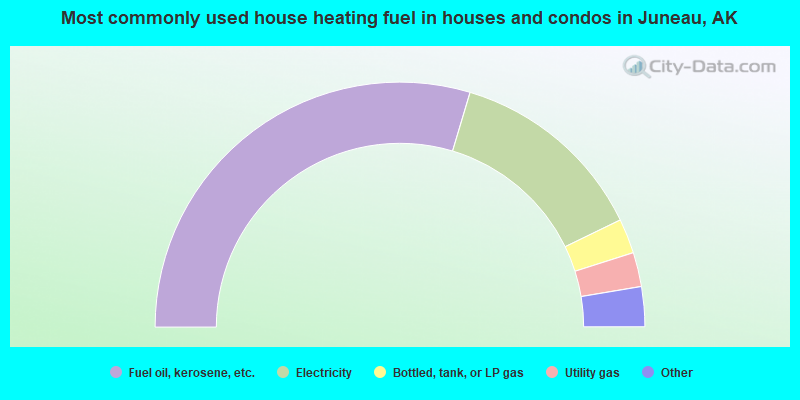
- 59.3%Fuel oil, kerosene, etc.
- 26.4%Electricity
- 4.6%Bottled, tank, or LP gas
- 4.5%Utility gas
- 3.0%Wood
- 2.2%Other fuel
- 0.1%No fuel used
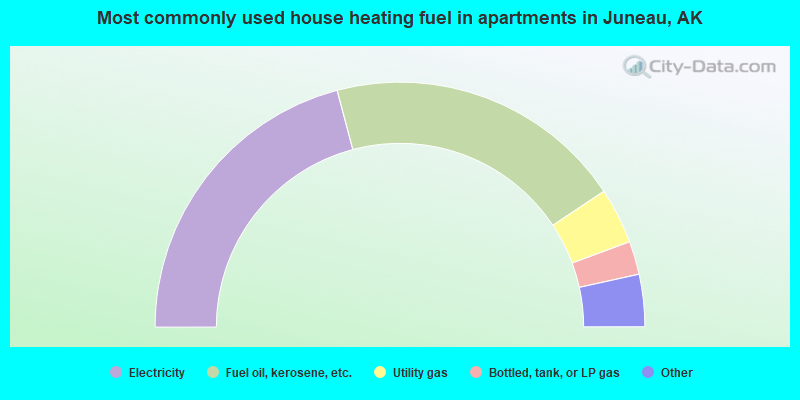
- 41.8%Electricity
- 39.6%Fuel oil, kerosene, etc.
- 7.4%Utility gas
- 4.4%Bottled, tank, or LP gas
- 3.8%Other fuel
- 2.1%No fuel used
- 0.9%Wood
- 0.1%Solar energy
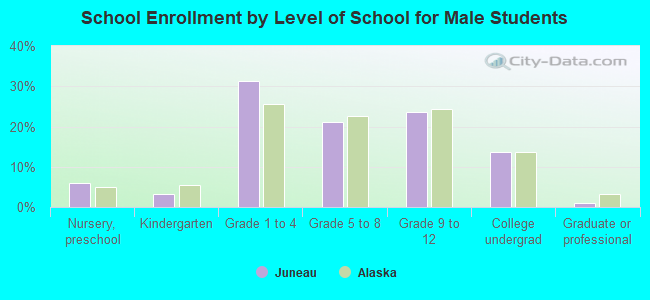
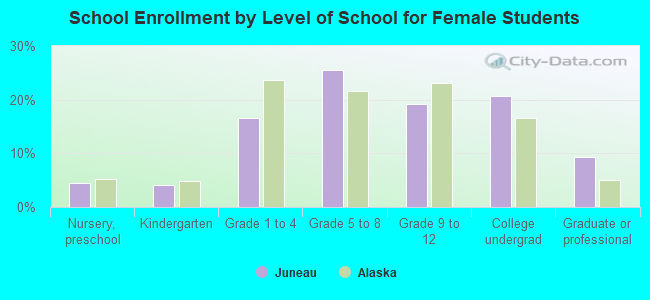
Private vs. public school enrollment:
| Here: | 16.8% |
| Alaska: | 15.7% |
| Here: | 10.1% |
| Alaska: | 13.7% |
| Here: | 7.1% |
| Alaska: | 14.7% |