Jeffersonville, IN (Indiana) Houses and Residents
Estimated median house or condo value in 2022: $210,693 (it was $83,600 in 2000 )
Jeffersonville:
$210,693Indiana:
$208,700
Lower value quartile - upper value quartile: $152,280 - $291,682Mean price in 2022: Detached houses: $231,185 Here:
$231,185State:
$257,916
Townhouses or other attached units: $150,051 Here:
$150,051State:
$224,114
In 2-unit structures: $385,787 Here:
$385,787State:
$175,375
In 3-to-4-unit structures: $60,346 Here:
$60,346State:
$151,116
In 5-or-more-unit structures: $197,681 Here:
$197,681State:
$200,844
Mobile homes: $29,890 Here:
$29,890State:
$67,116
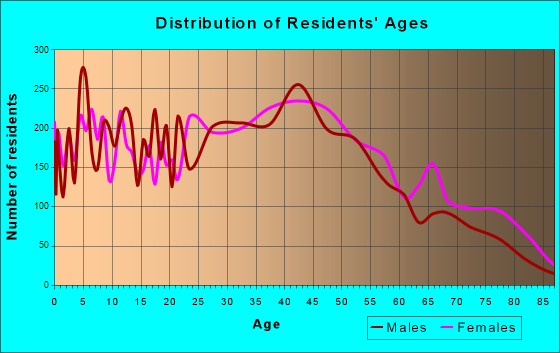
Total population: 46,440 (Urban population: 27,463, Rural population: 0)
Houses: 23,819 (21,410 occupied: 15,753 owner occupied, 6,286 renter occupied )
% of renters here:
29%State:
29%
Housing density: 1,754 houses/condos per square mile
Median price asked for vacant for-sale houses and condos in 2022: $238,022.
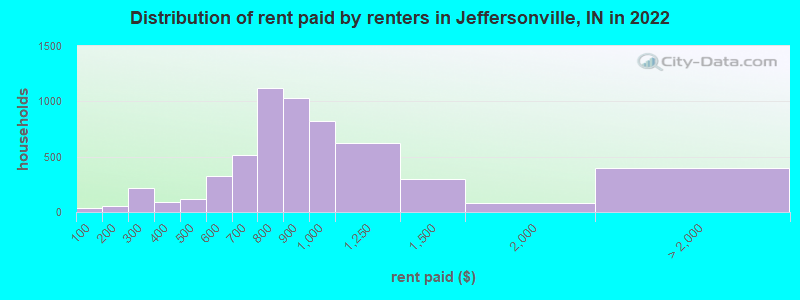
Median contract rent in 2022: $856 (lower quartile is $711, upper quartile is $1,055)
Median rent asked for vacant for-rent units in 2022: $723
Median gross rent in Jeffersonville, IN in 2022: $1,088
Housing units in Jeffersonville with a mortgage: 10,880 (616 second mortgage, 7 home equity loan, 528 both second mortgage and home equity loan )Houses without a mortgage: 356
Median household income for houses/condos with a mortgage: $87,077
Median household income for apartments without a mortgage: $68,158
Median monthly housing costs: $1,044
Data:
Median house or condo value ($)
Median house or condo value ($ change since 2000)
Median house or condo value ($) - White
Median house or condo value ($) - Black or African American
Median house or condo value ($) - Asian
Median house or condo value ($) - Hispanic or Latino
Median house or condo value ($) - American Indian and Alaska Native
Median house or condo value ($) - Multirace
Median house or condo value ($) - Other Race
Median price asked for mobile homes ($)
Household density (households per square mile)
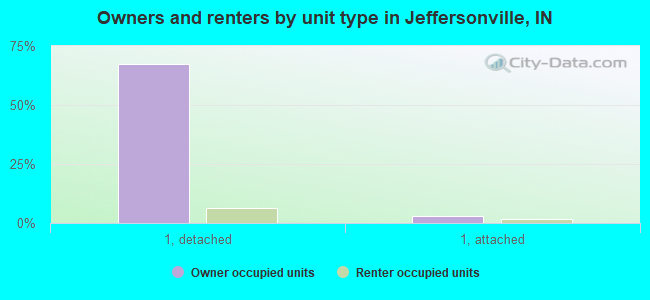
Mean house or condo value by units in structure - 1, detached ($)
Mean house or condo value by units in structure - 1, attached ($)
Mean house or condo value by units in structure - 2 ($)
Mean house or condo value by units in structure by units in structure - 3 or 4 ($)
Mean house or condo value by units in structure - 5 or more ($)
Mean house or condo value by units in structure - Boat, RV, van, etc. ($)
Mean house or condo value by units in structure - Mobile home ($)
Median contract rent ($)
Median contract rent - Lower quartile ($)
Median contract rent - Upper quartile ($)
Median gross rent ($)
Urban houses (%)
Rural houses (%)
Houses occupied (%)
Houses occupied (% change since 2000)
Houses owner occupied (%)
Houses owner occupied (% change since 2000)
Houses renter occupied (%)
Houses renter occupied (% change since 2000)
Vacant housing units - For rent (%)
Vacant housing units - For rent (% change since 2000)
Vacant housing units - For sale only (%)
Vacant housing units - For sale only (% change since 2000)
Vacant housing units - Rented or sold, not occupied (%)
Vacant housing units - Rented or sold, not occupied (% change since 2000)
Vacant housing units - For seasonal, recreational, or occasional use (%)
Vacant housing units - For seasonal, recreational, or occasional use (% change since 2000)
Vacant housing units - For migrant workers (%)
Vacant housing units - For migrant workers (% change since 2000)
Vacant housing units - Other vacant (%)
Vacant housing units - Other vacant (% change since 2000)
Median monthly housing costs ($)
Median household income for houses/condos with a mortgage ($)
Median household income for houses/condos without a mortgage ($)
Median household income ($)
Median household income ($) - White
Median household income ($) - Black or African American
Median household income ($) - Asian
Median household income ($) - Hispanic or Latino
Median household income ($) - American Indian and Alaska Native
Median household income ($) - Multirace
Median household income ($) - Other Race
Mortgage status - with mortgage (%)
Mortgage status - with second mortgage (%)
Mortgage status - with home equity loan (%)
Mortgage status - with both second mortgage and home equity loan (%)
Mortgage status - without a mortgage (%)
Median year house/condo built
Median year apartment built
Household type by relationship - Male householder living alone (%)
Household type by relationship - Male householder not living alone (%)
Household type by relationship - Female householder living alone (%)
Household type by relationship - Female householder not living alone (%)
Household type by relationship - Opposite-Sex spouse (%)
Household type by relationship - Same-Sex spouse (%)
Household type by relationship - Opposite-Sex unmarried partner (%)
Household type by relationship - Same-Sex unmarried partner (%)
Household type by relationship - In group quarters (%)
Size of family households - 2-person household (%)
Size of family households - 3-person household (%)
Size of family households - 4-person household (%)
Size of family households - 5-person household (%)
Size of family households - 6-person household (%)
Size of family households - 7-or-more-person household (%)
Size of nonfamily households - 1-person household (%)
Size of nonfamily households - 2-person household (%)
Size of nonfamily households - 3-person household (%)
Size of nonfamily households - 4-person household (%)
Size of nonfamily households - 5-person household (%)
Size of nonfamily households - 6-person household (%)
Size of nonfamily households - 7-or-moreperson household (%)
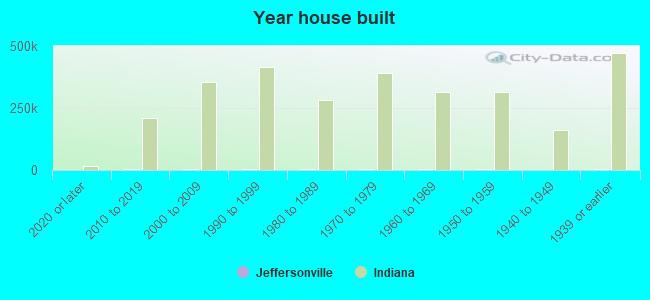
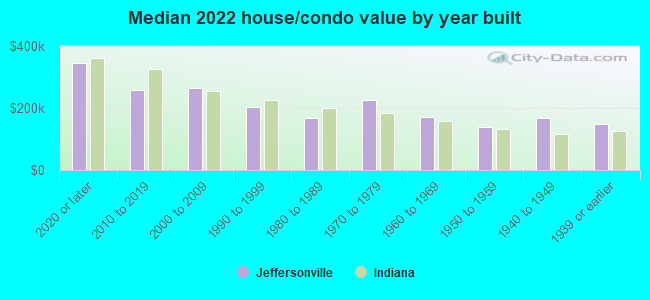
Year house built - Built 2010 or later (%)
Year house built - Built 2000 to 2009 (%)
Year house built - Built 1990 to 1999 (%)
Year house built - Built 1980 to 1989 (%)
Year house built - Built 1970 to 1979 (%)
Year house built - Built 1960 to 1969 (%)
Year house built - Built 1950 to 1959 (%)
Year house built - Built 1940 to 1949 (%)
Year house built - Built 1939 or earlier (%)
Median number of rooms in houses and condos
Median number of rooms in apartments
Median number of bedrooms in owner occupied houses
Mean number of bedrooms in owner occupied houses
Median number of bedrooms in renter occupied houses
Mean number of bedrooms in renter occupied houses
Median number of vehichles in owner occupied houses
Mean number of vehichles in owner occupied houses
Median number of vehichles in renter occupied houses
Mean number of vehichles in renter occupied houses
Rooms in owner-occupied houses - 1 room (%)
Rooms in owner-occupied houses - 2 rooms (%)
Rooms in owner-occupied houses - 3 rooms (%)
Rooms in owner-occupied houses - 4 rooms (%)
Rooms in owner-occupied houses - 5 rooms (%)
Rooms in owner-occupied houses - 6 rooms (%)
Rooms in owner-occupied houses - 7 rooms (%)
Rooms in owner-occupied houses - 8 rooms (%)
Rooms in owner-occupied houses - 9+ rooms (%)
Rooms in renter-occupied houses - 1 room (%)
Rooms in renter-occupied houses - 2 rooms (%)
Rooms in renter-occupied houses - 3 rooms (%)
Rooms in renter-occupied houses - 4 rooms (%)
Rooms in renter-occupied houses - 5 rooms (%)
Rooms in renter-occupied houses - 6 rooms (%)
Rooms in renter-occupied houses - 7 rooms (%)
Rooms in renter-occupied houses - 8 rooms (%)
Rooms in renter-occupied houses - 9+ rooms (%)
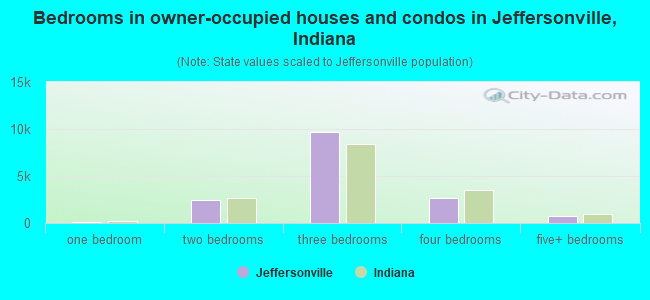
Bedrooms in owner-occupied houses - no bedrooms (%)
Bedrooms in owner-occupied houses - 1 bedroom (%)
Bedrooms in owner-occupied houses - 2 bedrooms (%)
Bedrooms in owner-occupied houses - 3 bedrooms (%)
Bedrooms in owner-occupied houses - 4 bedrooms (%)
Bedrooms in owner-occupied houses - 5+ bedrooms (%)
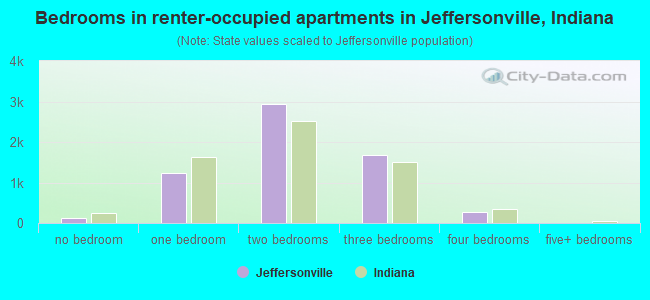
Bedrooms in renter-occupied houses - no bedrooms (%)
Bedrooms in renter-occupied houses - 1 bedroom (%)
Bedrooms in renter-occupied houses - 2 bedrooms (%)
Bedrooms in renter-occupied houses - 3 bedrooms (%)
Bedrooms in renter-occupied houses - 4 bedrooms (%)
Bedrooms in renter-occupied houses - 5+ bedrooms (%)
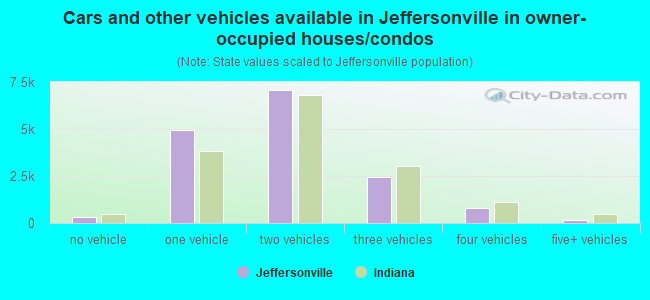
Vehicles available in owner-occupied houses - no vehicle available (%)
Vehicles available in owner-occupied houses - 1 vehicle available(%)
Vehicles available in owner-occupied houses - 2 Vehicles available (%)
Vehicles available in owner-occupied houses - 3 Vehicles available (%)
Vehicles available in owner-occupied houses - 4 Vehicles available (%)
Vehicles available in owner-occupied houses - 5+ Vehicles available (%)
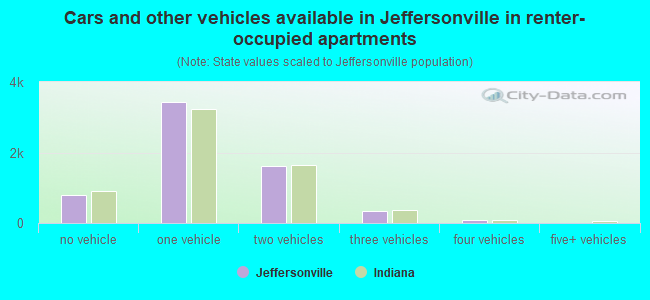
Vehicles available in renter-occupied houses - no vehicle available (%)
Vehicles available in renter-occupied houses - 1 vehicle available (%)
Vehicles available in renter-occupied houses - 2 Vehicles available (%)
Vehicles available in renter-occupied houses - 3 Vehicles available (%)
Vehicles available in renter-occupied houses - 4 Vehicles available (%)
Vehicles available in renter-occupied houses - 5+ Vehicles available (%)
Housing units in structures - 1, detached (%)
Housing units in structures - 1, attached (%)
Housing units in structures - 2 (%)
Housing units in structures - 3 or 4 (%)
Housing units in structures - 5 to 9 (%)
Housing units in structures - 10 to 19 (%)
Housing units in structures - 20 to 49 (%)
Housing units in structures - 50 or more (%)
Housing units in structures - Mobile home (%)
Housing units in structures - Boat, RV, van, etc. (%)
Housing units in structures - Owners - 1, detached (%)
Housing units in structures - Owners - 1, attached (%)
Housing units in structures - Owners - 2 (%)
Housing units in structures - Owners - 3 or 4 (%)
Housing units in structures - Owners - 5 to 9 (%)
Housing units in structures - Owners - 10 to 19 (%)
Housing units in structures - Owners - 20 to 49 (%)
Housing units in structures - Owners - 50 or more (%)
Housing units in structures - Owners - Mobile home (%)
Housing units in structures - Owners - Boat, RV, van, etc. (%)
Housing units in structures - Renters - 1, detached (%)
Housing units in structures - Renters - 1, attached (%)
Housing units in structures - Renters - 2 (%)
Housing units in structures - Renters - 3 or 4 (%)
Housing units in structures - Renters - 5 to 9 (%)
Housing units in structures - Renters - 10 to 19 (%)
Housing units in structures - Renters - 20 to 49 (%)
Housing units in structures - Renters - 50 or more (%)
Housing units in structures - Renters - Mobile home (%)
Housing units in structures - Renters - Boat, RV, van, etc. (%)
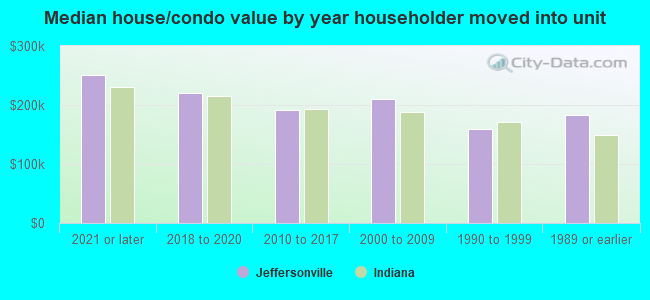
House/condo owner moved in on average (years ago)
Renter moved in on average (years ago)
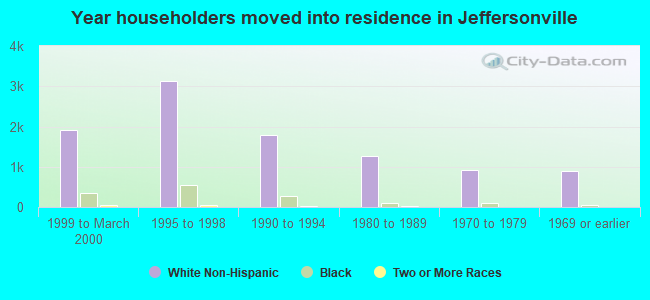
Year householder moved into unit - Moved in 1999 to March 2000 (%)
Year householder moved into unit - Moved in 1999 to March 2000 (%) - White
Year householder moved into unit - Moved in 1999 to March 2000 (%) - Black or African American
Year householder moved into unit - Moved in 1999 to March 2000 (%) - Asian
Year householder moved into unit - Moved in 1999 to March 2000 (%) - Hispanic or Latino
Year householder moved into unit - Moved in 1999 to March 2000 (%) - American Indian and Alaska Native
Year householder moved into unit - Moved in 1999 to March 2000 (%) - Multirace
Year householder moved into unit - Moved in 1999 to March 2000 (%) - Other Race
Year householder moved into unit - Moved in 1995 to 1998 (%)
Year householder moved into unit - Moved in 1995 to 1998 (%) - White
Year householder moved into unit - Moved in 1995 to 1998 (%) - Black or African American
Year householder moved into unit - Moved in 1995 to 1998 (%) - Asian
Year householder moved into unit - Moved in 1995 to 1998 (%) - Hispanic or Latino
Year householder moved into unit - Moved in 1995 to 1998 (%) - American Indian and Alaska Native
Year householder moved into unit - Moved in 1995 to 1998 (%) - Multirace
Year householder moved into unit - Moved in 1995 to 1998 (%) - Other Race
Year householder moved into unit - Moved in 1990 to 1994 (%)
Year householder moved into unit - Moved in 1990 to 1994 (%) - White
Year householder moved into unit - Moved in 1990 to 1994 (%) - Black or African American
Year householder moved into unit - Moved in 1990 to 1994 (%) - Asian
Year householder moved into unit - Moved in 1990 to 1994 (%) - Hispanic or Latino
Year householder moved into unit - Moved in 1990 to 1994 (%) - American Indian and Alaska Native
Year householder moved into unit - Moved in 1990 to 1994 (%) - Multirace
Year householder moved into unit - Moved in 1990 to 1994 (%) - Other Race
Year householder moved into unit - Moved in 1980 to 1989 (%)
Year householder moved into unit - Moved in 1980 to 1989 (%) - White
Year householder moved into unit - Moved in 1980 to 1989 (%) - Black or African American
Year householder moved into unit - Moved in 1980 to 1989 (%) - Asian
Year householder moved into unit - Moved in 1980 to 1989 (%) - Hispanic or Latino
Year householder moved into unit - Moved in 1980 to 1989 (%) - American Indian and Alaska Native
Year householder moved into unit - Moved in 1980 to 1989 (%) - Multirace
Year householder moved into unit - Moved in 1980 to 1989 (%) - Other Race
Year householder moved into unit - Moved in 1970 to 1979 (%)
Year householder moved into unit - Moved in 1970 to 1979 (%) - White
Year householder moved into unit - Moved in 1970 to 1979 (%) - Black or African American
Year householder moved into unit - Moved in 1970 to 1979 (%) - Asian
Year householder moved into unit - Moved in 1970 to 1979 (%) - Hispanic or Latino
Year householder moved into unit - Moved in 1970 to 1979 (%) - American Indian and Alaska Native
Year householder moved into unit - Moved in 1970 to 1979 (%) - Multirace
Year householder moved into unit - Moved in 1970 to 1979 (%) - Other Race
Year householder moved into unit - Moved in 1969 or earlier (%)
Year householder moved into unit - Moved in 1969 or earlier (%) - White
Year householder moved into unit - Moved in 1969 or earlier (%) - Black or African American
Year householder moved into unit - Moved in 1969 or earlier (%) - Asian
Year householder moved into unit - Moved in 1969 or earlier (%) - Hispanic or Latino
Year householder moved into unit - Moved in 1969 or earlier (%) - American Indian and Alaska Native
Year householder moved into unit - Moved in 1969 or earlier (%) - Multirace
Year householder moved into unit - Moved in 1969 or earlier (%) - Other Race
Housing units lacking complete plumbing facilities (%)
Housing units lacking complete kitchen facilities (%)
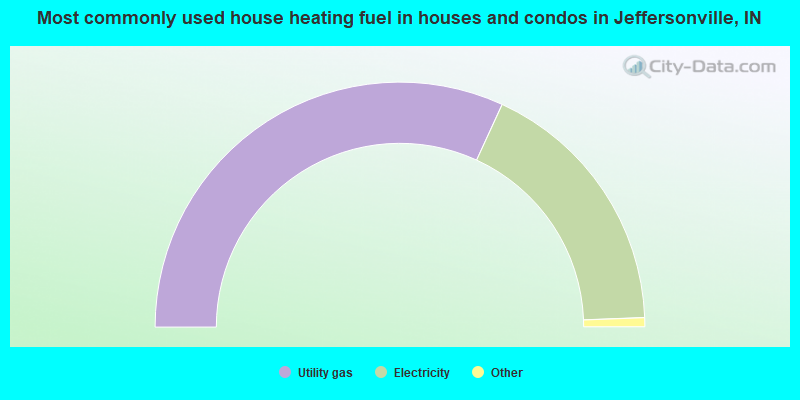
House heating fuel used in houses and condos - Utility gas (%)
House heating fuel used in houses and condos - Bottled, tank, or LP gas (%)
House heating fuel used in houses and condos - Electricity (%)
House heating fuel used in houses and condos - Fuel oil, kerosene, etc. (%)
House heating fuel used in houses and condos - Coal or coke (%)
House heating fuel used in houses and condos - Wood (%)
House heating fuel used in houses and condos - Solar energy (%)
House heating fuel used in houses and condos - Other fuel (%)
House heating fuel used in houses and condos - No fuel used (%)
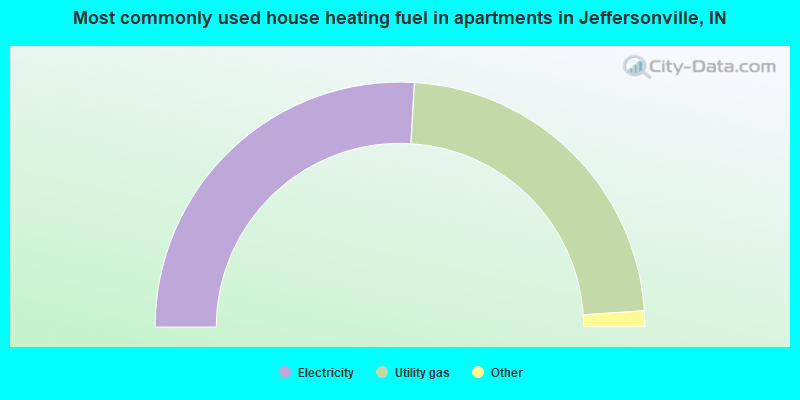
House heating fuel used in apartments - Utility gas (%)
House heating fuel used in apartments - Bottled, tank, or LP gas (%)
House heating fuel used in apartments - Electricity (%)
House heating fuel used in apartments - Fuel oil, kerosene, etc. (%)
House heating fuel used in apartments - Coal or coke (%)
House heating fuel used in apartments - Wood (%)
House heating fuel used in apartments - Solar energy (%)
House heating fuel used in apartments - Other fuel (%)
House heating fuel used in apartments - No fuel used (%)
Latest news about housing in Jeffersonville, IN collected exclusively by city-data.com from local newspapers, TV, and radio stations
Median year house/condo built: 1982Median year apartment built: 1978Household type by relationship:
Households: 50,898
Male householders: 9,589 (3,225 living alone ), Female householders: 11,284 (3,246 living alone )9,217 spouses (9,065 opposite-sex spouses ), 1,588 unmarried partners , (1,530 opposite-sex unmarried partners ), 13,634 children (12,546 natural , 426 adopted , 661 stepchildren ), 1,564 grandchildren , 446 brothers or sisters , 544 parents , 113 foster children , 457 other relatives , 1,560 non-relatives In group quarters: 898
Size of family households: 5,974 2-persons , 3,692 3-persons , 2,462 4-persons , 724 5-persons , 488 6-persons , 228 7-or-more-persons .
Size of nonfamily households: 7,403 1-person , 1,000 2-persons , 79 3-persons , 40 4-persons .
5,884 married couples with children. single-parent households (677 men , 2,608 women ).
94.2% of residents of Jeffersonville speak English at home. of residents speak Spanish at home (69% speak English very well , 21% speak English well , 8% speak English not well , 2% don't speak English at all ).of residents speak other Indo-European language at home (86% speak English very well , 14% speak English well ).of residents speak Asian or Pacific Island language at home (43% speak English very well , 41% speak English well , 16% speak English not well ).of residents speak other language at home (100% speak English very well ).
Foreign born population: 1,928 (3.8%)of them are naturalized citizens )
Median number of rooms in houses and condos:
Median number of rooms in apartments
Owner-occupied Renter-occupied
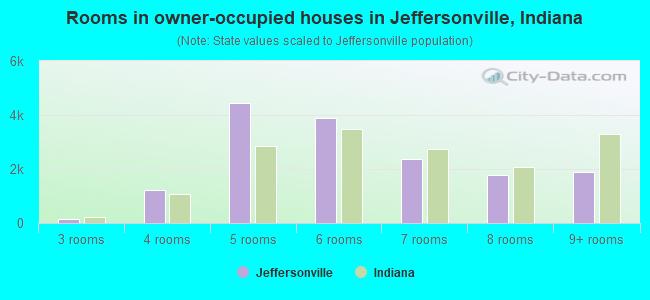
Rooms in owner-occupied houses in Jeffersonville, Indiana
0 1 room 35 2 rooms 155 3 rooms 1,208 4 rooms 4,435 5 rooms 3,894 6 rooms 2,370 7 rooms 1,781 8 rooms 1,876 9+ rooms
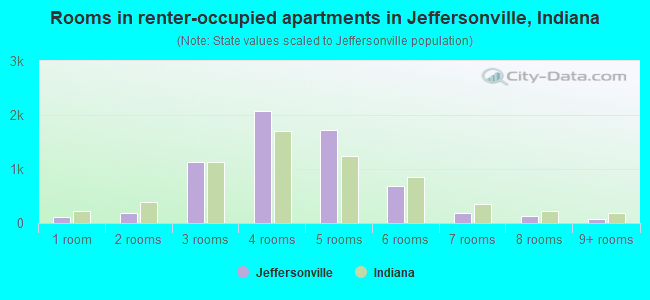
Rooms in renter-occupied apartments in Jeffersonville, Indiana
112 1 room 184 2 rooms 1,136 3 rooms 2,074 4 rooms 1,726 5 rooms 676 6 rooms 176 7 rooms 125 8 rooms 78 9+ rooms
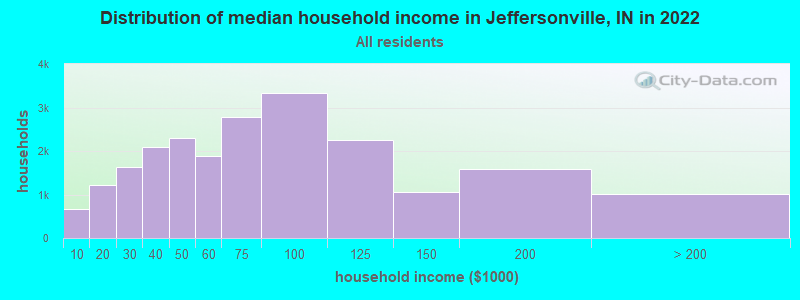
Jeffersonville, IN household income distribution 663 Less than $10,0001,214 $10,000 to $19,9991,639 $20,000 to $29,9992,091 $30,000 to $39,9992,298 $40,000 to $49,9991,880 $50,000 to $59,9992,793 $60,000 to $74,9993,324 $75,000 to $99,9992,243 $100,000 to $124,9991,060 $125,000 to $149,9991,584 $150,000 to $199,9991,009 $200,000 or more
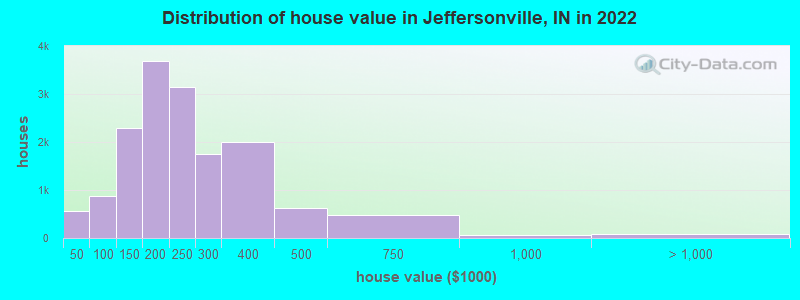
Home value of owner - occupied houses in 2022 in Jeffersonville, IN 110 Less than $10,00067 $10,000 to $14,999193 $15,000 to $19,99934 $20,000 to $24,99963 $25,000 to $29,99951 $30,000 to $34,99944 $40,000 to $49,999156 $50,000 to $59,99976 $60,000 to $69,999125 $70,000 to $79,999252 $80,000 to $89,999228 $90,000 to $99,999767 $100,000 to $124,9991,523 $125,000 to $149,9992,147 $150,000 to $174,9991,540 $175,000 to $199,9993,137 $200,000 to $249,9991,747 $250,000 to $299,9992,006 $300,000 to $399,999619 $400,000 to $499,999485 $500,000 to $749,99969 $750,000 to $999,99957 $1,000,000 to $1,499,99931 $2,000,000 or moreRent paid by renters in 2022 in Jeffersonville, IN 39 Less than $1007 $100 to $14945 $150 to $199114 $200 to $249102 $250 to $29953 $300 to $34935 $350 to $39969 $400 to $44948 $450 to $499150 $500 to $549170 $550 to $599215 $600 to $649301 $650 to $699520 $700 to $749601 $750 to $7991,032 $800 to $899824 $900 to $999622 $1,000 to $1,249297 $1,250 to $1,49977 $1,500 to $1,99913 $2,000 to $2,499383 No cash rent
Percentage of workers working in this county: 59.9%Number of people working at home: 3,987 (15.6% of all workers )
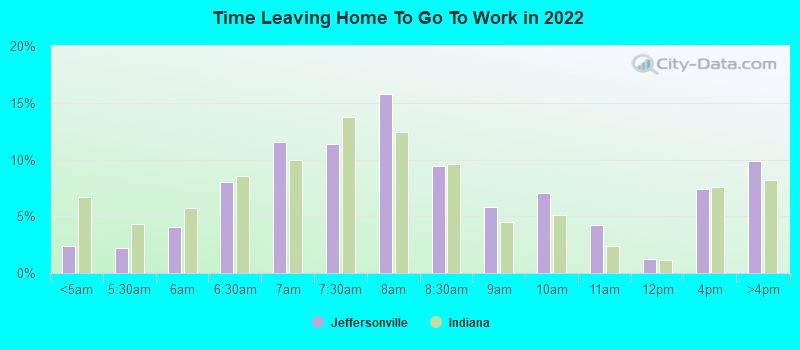
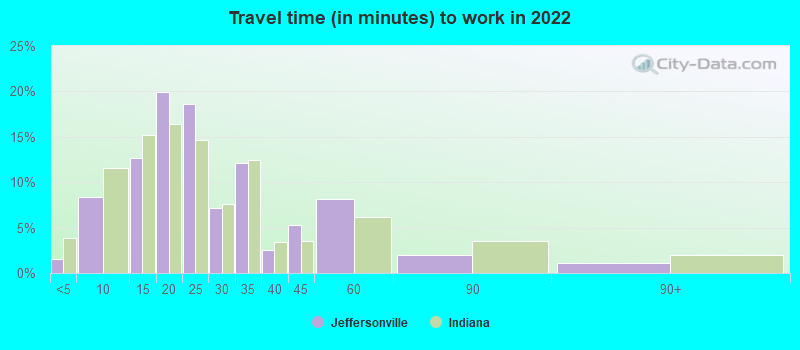
Travel time to work (commute)
Less than 5 minutes: 4345 to 9 minutes: 2,15910 to 14 minutes: 3,96515 to 19 minutes: 4,91320 to 24 minutes: 5,06225 to 29 minutes: 1,84630 to 34 minutes: 2,73235 to 39 minutes: 37040 to 44 minutes: 49545 to 59 minutes: 45860 to 89 minutes: 41890 or more minutes: 104
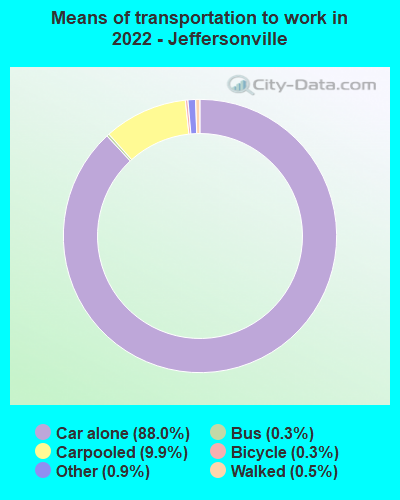
Means of transportation to work:
Drove a car alone: 25,227 (76.7%)Carpooled: 3,135 (9.5%)Bus : 71 (0.2%)Subway or elevated rail : 19 (0.1%)Taxi: 321 (1.0%)Bicycle: 100 (0.3%)Walked: 133 (0.4%)Worked at home: 3,987 (12.1%)
Unemployment by race in 2022
Unemployment rate for White non-Hispanic residents 3.1% Males3.9% FemalesUnemployment rate for Black residents 4.4% Males1.2% FemalesUnemployment rate for other race residents 7.9% MalesUnemployment rate for two or more race residents 5.2% FemalesUnemployment rate for Hispanic or Latino residents 6.5% Males4.1% Females
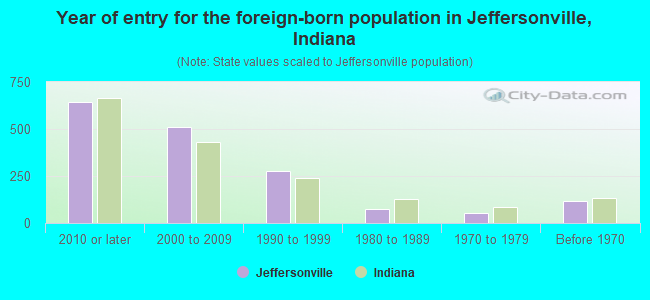
Year of entry for the foreign-born population in Jeffersonville, Indiana
645 2010 or later 509 2000 to 2009 276 1990 to 1999 77 1980 to 1989 54 1970 to 1979 119 Before 1970
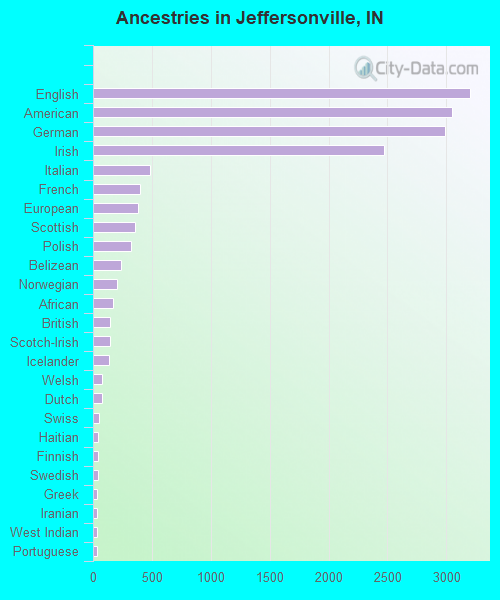
First ancestries reported:
English: 3,202 (13.7%)
American: 3,045 (13.0%)
German: 2,989 (12.8%)
Irish: 2,473 (10.6%)
Italian: 480 (2.1%)
French: 401 (1.7%)
European: 378 (1.6%)
Scottish: 360 (1.5%)
Polish: 321 (1.4%)
Belizean: 239 (1.0%)
Norwegian: 202 (0.9%)
African: 170 (0.7%)
British: 144 (0.6%)
Scotch-Irish: 141 (0.6%)
Icelander: 134 (0.6%)
Welsh: 80 (0.3%)
Dutch: 77 (0.3%)
Swiss: 51 (0.2%)
Haitian: 46 (0.2%)
Finnish: 45 (0.2%)
Swedish: 40 (0.2%)
Greek: 36 (0.2%)
Iranian: 36 (0.2%)
West Indian: 33 (0.1%)
Portuguese: 30 (0.1%)
Somali: 21 (0.09%)
Hungarian: 19 (0.08%)
Eastern European: 17 (0.07%)
New Zealander: 17 (0.07%)
Croatian: 11 (0.05%)
Pennsylvania German: 10 (0.04%)
Latvian: 10 (0.04%)
Scandinavian: 8 (0.03%)
Czech: 8 (0.03%)
Ukrainian: 8 (0.03%)
Jamaican: 8 (0.03%)
Slavic: 7 (0.03%)
Austrian: 6 (0.03%)
French Canadian: 5 (0.02%)
Belgian: 2 (0.01%) Most common places of birth for foreign-born residents (%): Mexico Jeffersonville:
26.6% (502)Indiana:
27.0% (101,996)
Colombia Jeffersonville:
8.9% (168)Indiana:
0.8% (3,114)
Canada Jeffersonville:
8.2% (154)Indiana:
2.1% (7,834)
Pakistan Jeffersonville:
6.2% (116)Indiana:
0.9% (3,221)
India Jeffersonville:
5.7% (108)Indiana:
8.5% (32,127)
Belize Jeffersonville:
5.2% (98)Indiana:
0.1% (346)
Honduras Jeffersonville:
4.5% (85)Indiana:
1.6% (5,892)
Indonesia Jeffersonville:
3.6% (67)Indiana:
0.3% (1,177)
Nicaragua Jeffersonville:
3.3% (62)Indiana:
0.4% (1,406)
Guatemala Jeffersonville:
3.1% (58)Indiana:
2.3% (8,656)
China, excluding Hong Kong and Taiwan Jeffersonville:
2.8% (53)Indiana:
5.3% (19,877)
Cuba Jeffersonville:
2.3% (44)Indiana:
0.4% (1,509)
Vietnam Jeffersonville:
2.2% (41)Indiana:
1.8% (6,645)
Germany Jeffersonville:
2.1% (39)Indiana:
1.7% (6,439)
Iran Jeffersonville:
2.0% (37)Indiana:
0.4% (1,600)
Other Eastern Asia Jeffersonville:
2.0% (37)Indiana:
0.0% (96)
Philippines Jeffersonville:
1.7% (32)Indiana:
3.1% (11,851)
Other Australian and New Zealand Subregion Jeffersonville:
1.7% (32)Indiana:
0.1% (327)
Korea Jeffersonville:
1.5% (29)Indiana:
2.0% (7,653)
Place of birth for U.S.-born residents:
This state: 23,889Other state: 24,318Northeast: 851Midwest: 3,606South: 17,913West: 1,908 87.0% of Jeffersonville residents lived in the same house 1 years ago.
Out of people who lived in different houses, 34.6% lived in this county.
Out of people who lived in different counties, 46.8% lived in Indiana.
Jeffersonville:
87.0%State average:
87.1%
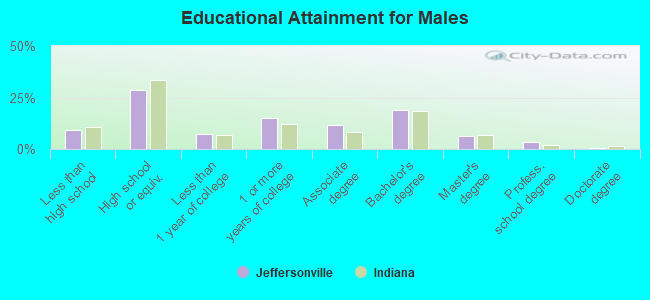
Education attainment for males 25 years and older:
No schooling: 255Nursery to 4th grade: 115th and 6th grade: 237th and 8th grade: 1789th grade: 8510th grade: 32211th grade: 22512th grade, no diploma: 470High school graduate (or equivalency): 4,920Less than 1 year of college: 1,262Some college more than 1 year, no degree: 2,558Associate degree: 2,017Bachelor's degree: 3,222Master's degree: 1,044Professional school degree: 560Doctorate degree: 45
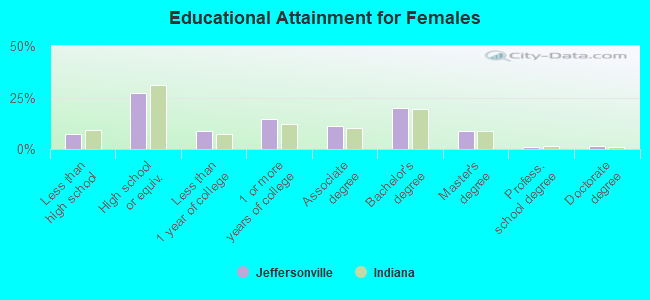
Education attainment for females 25 years and older:
No schooling: 299Nursery to 4th grade: 05th and 6th grade: 47th and 8th grade: 569th grade: 15110th grade: 19311th grade: 49212th grade, no diploma: 133High school graduate (or equivalency): 5,079Less than 1 year of college: 1,669Some college more than 1 year, no degree: 2,742Associate degree: 2,098Bachelor's degree: 3,748Master's degree: 1,639Professional school degree: 141Doctorate degree: 261
Housing units in structures:
One, detached: 16,870One, attached: 1,672Two: 4623 or 4: 1,0455 to 9: 1,27910 to 19: 81520 to 49: 24450 or more: 838Mobile homes: 591Median worth of mobile homes: $21,231
Housing units lacking complete plumbing facilities in 2022: 0.5%Housing units lacking complete kitchen facilities in 2022: 1.5%House/condo owner moved in on average 9 years ago
Renter moved in on average 1 years ago
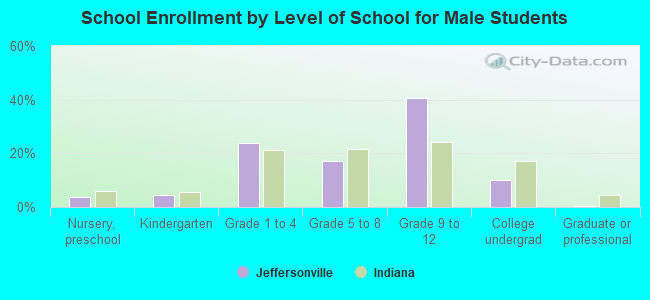
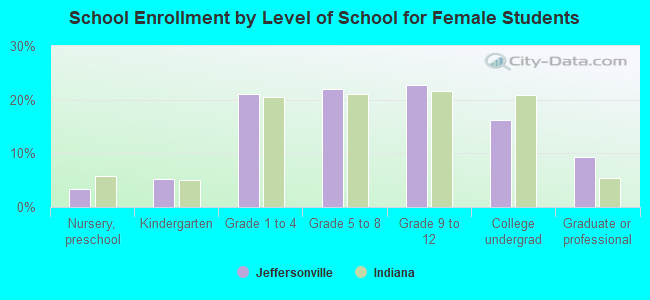
Private vs. public school enrollment:
Students in private schools in grades 1 to 8 (elementary and middle school): 858 Students in private schools in grades 9 to 12 (high school): 611 Students in private undergraduate colleges: 208