Iona, FL (Florida) Houses and Residents
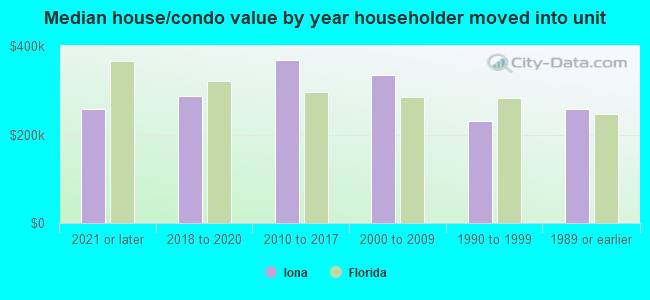
| Iona: | $322,017 |
| Florida: | $354,100 |
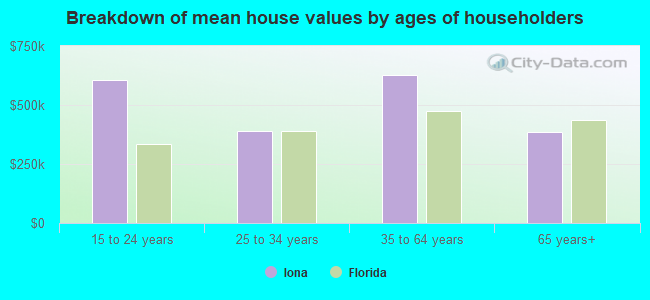
Mean price in 2022:
Detached houses: $970,591
Here: $970,591 State: $500,941 Townhouses or other attached units: $400,622
Here: $400,622 State: $370,869 In 2-unit structures: $375,423
Here: $375,423 State: $423,188 In 3-to-4-unit structures: $401,571
Here: $401,571 State: $309,944 In 5-or-more-unit structures: $397,406
Here: $397,406 State: $447,145 Mobile homes: $161,142
Here: $161,142 State: $113,202 Occupied boats, RVs, vans, etc.: $36,947
Here: $36,947 State: $73,933
Total population: 15,369 (Urban population: 11,853, Rural population: 0)
Houses: 14,279 (8,255 occupied: 5,976 owner occupied, 2,568 renter occupied)
| % of renters here: | 30% |
| State: | 33% |
Housing density: 2,002 houses/condos per square mile
Median price asked for vacant for-sale houses and condos in 2022: $423,751.
Median contract rent in 2022: $1,664 (lower quartile is $1,360, upper quartile is over $2,000)
Median rent asked for vacant for-rent units in 2022: $2,089
Median gross rent in Iona, FL in 2022: $1,937
Housing units in Iona with a mortgage: 1,951 (213 second mortgage, 0 home equity loan, 192 both second mortgage and home equity loan)
Houses without a mortgage: 23
Median household income for houses/condos with a mortgage: $96,183
Median household income for apartments without a mortgage: $53,002
Median monthly housing costs: $1,243
Compare current foreclosures near Iona, FL:
| Photo | Address | Area | Beds / Baths | Price | Details |
|---|---|---|---|---|---|

|
#1
NE 28th St
Cape Coral, FL 33909
|
1,263 sq. feet
|
2 baths 3 beds |
$249,850
|
show details |

|
#2
Majestic Ave
Fort Myers, FL 33913
|
1,692 sq. feet
|
2 baths 2 beds |
$495,000
|
show details |

|
#3
Morning Glory Ln
Fort Myers, FL 33913
|
2,512 sq. feet
|
2 baths 4 beds |
$540,000
|
show details |

|
#4
Springwood Ct
Bonita Springs, FL 34135
|
1,688 sq. feet
|
2 baths 2 beds |
$479,750
|
show details |

|
#5
Van Buren St Apt C5
Fort Myers, FL 33916
|
968 sq. feet
|
1 baths 2 beds |
$160,000
|
show details |

|
#6
SW 40th Ter
Cape Coral, FL 33914
|
1,975 sq. feet
|
2 baths 3 beds |
$449,900
|
show details |

|
#7
Greendale Pl
Cape Coral, FL 33991
|
1,509 sq. feet
|
2 baths 3 beds |
$380,000
|
show details |

|
#8
Dutchess Park Rd
Fort Myers, FL 33916
|
1,519 sq. feet
|
2 baths 2 beds |
show details | |

|
#9
Cypress Dr N
Fort Myers, FL 33967
|
1,336 sq. feet
|
2 baths 3 beds |
show details | |

|
#10
SW 4th Ter
Cape Coral, FL 33991
|
1,706 sq. feet
|
2 baths 3 beds |
show details |
| Photo | Address | Area | Beds / Baths | Price | Details |
|---|---|---|---|---|---|

|
#11
SW 7th Pl
Cape Coral, FL 33991
|
1,684 sq. feet
|
2 baths 3 beds |
show details | |

|
#12
Phlox Dr
Fort Myers, FL 33967
|
1,188 sq. feet
|
2 baths 3 beds |
show details | |

|
#13
Flamingo Rd
Fort Myers, FL 33967
|
1,040 sq. feet
|
1 baths 3 beds |
show details | |

|
#14
SE 4th Ter
Cape Coral, FL 33990
|
1,671 sq. feet
|
2 baths 3 beds |
show details | |

|
#15
Alhambra Dr
Fort Myers, FL 33901
|
2,966 sq. feet
|
2 baths 4 beds |
show details | |

|
#16
Dogwood Rd
Fort Myers, FL 33967
|
1,608 sq. feet
|
2 baths 3 beds |
show details | |

|
#17
SE 7th St
Cape Coral, FL 33990
|
1,800 sq. feet
|
2 baths 3 beds |
show details | |

|
#18
Bristol Bay Pl Apt 205
Fort Myers, FL 33912
|
1,252 sq. feet
|
2 baths 2 beds |
show details | |

|
#19
Little John Ct Apt 97
Bonita Springs, FL 34135
|
983 sq. feet
|
2 baths 2 beds |
show details | |

|
#20
SE 2nd Pl
Cape Coral, FL 33990
|
1,954 sq. feet
|
2 baths 3 beds |
show details |
| Photo | Address | Area | Beds / Baths | Price | Details |
|---|---|---|---|---|---|

|
#21
SE 23rd Pl
Cape Coral, FL 33990
|
1,663 sq. feet
|
2 baths 3 beds |
show details | |

|
#22
SW 6th Ave
Cape Coral, FL 33991
|
1,107 sq. feet
|
2 baths 3 beds |
show details | |

|
#23
Birch Rd
Fort Myers, FL 33967
|
1,542 sq. feet
|
2 baths 4 beds |
show details | |

|
#24
Alhambra Dr
Fort Myers, FL 33901
|
2,771 sq. feet
|
2 baths 4 beds |
show details | |

|
#25
Alvin Ave
Lehigh Acres, FL 33971
|
1,935 sq. feet
|
2 baths 3 beds |
show details | |

|
#26
Broadway Apt 109
Fort Myers, FL 33901
|
962 sq. feet
|
1 baths 2 beds |
show details | |

|
#27
Channel Way
North Fort Myers, FL 33917
|
2,013 sq. feet
|
2 baths 2 beds |
show details | |

|
#28
Stonyhill Ct
Cape Coral, FL 33991
|
2,440 sq. feet
|
3 baths 4 beds |
show details | |

|
#29
SE 23rd Pl
Cape Coral, FL 33990
|
1,796 sq. feet
|
2 baths 3 beds |
show details | |

|
#30
Kingsman Cir
Fort Myers, FL 33905
|
1,092 sq. feet
|
2 baths 3 beds |
show details |
| Photo | Address | Area | Beds / Baths | Price | Details |
|---|---|---|---|---|---|

|
#31
Rosada Way
Fort Myers, FL 33901
|
1,798 sq. feet
|
2 baths 3 beds |
show details | |

|
#32
Kelly St
Fort Myers, FL 33901
|
1,235 sq. feet
|
2 baths 2 beds |
show details | |

|
#33
Phlox Dr
Fort Myers, FL 33967
|
3,100 sq. feet
|
2 baths 3 beds |
show details | |

|
#34
Moreno Ave
Fort Myers, FL 33901
|
1,512 sq. feet
|
2 baths 3 beds |
show details | |

|
#35
SW 4th Ter
Cape Coral, FL 33991
|
2,488 sq. feet
|
3 baths 4 beds |
show details | |

|
#36
Kingston Dr E
Fort Myers, FL 33905
|
813 sq. feet
|
1 baths 2 beds |
show details | |

|
#37
Enclaves Cove Dr
North Fort Myers, FL 33917
|
1,850 sq. feet
|
2 baths 4 beds |
show details | |

|
#38
Sarasota Rd
Fort Myers, FL 33967
|
1,042 sq. feet
|
2 baths 2 beds |
show details | |

|
#39
Cedar Hollow Dr
Fort Myers, FL 33912
|
1,821 sq. feet
|
2 baths 3 beds |
show details | |

|
#40
Gulfgate Ln
Saint James City, FL 33956
|
1,152 sq. feet
|
2 baths 2 beds |
show details |
| Photo | Address | Area | Beds / Baths | Price | Details |
|---|---|---|---|---|---|

|
#41
Golf Club Ct Apt 5
North Fort Myers, FL 33903
|
1,375 sq. feet
|
2 baths 2 beds |
show details | |

|
#42
Dora St
Fort Myers, FL 33901
|
917 sq. feet
|
1 baths 2 beds |
show details | |

|
#43
SW 1st St
Cape Coral, FL 33991
|
1,200 sq. feet
|
2 baths 3 beds |
show details | |

|
#44
Royal Palm Ave
Fort Myers, FL 33901
|
2,599 sq. feet
|
4 baths 3 beds |
show details | |

|
#45
Hancock Bridge Pkwy
Cape Coral, FL 33990
|
1,566 sq. feet
|
2 baths 3 beds |
show details | |

|
#46
NE 36th St
Cape Coral, FL 33909
|
1,378 sq. feet
|
2 baths 3 beds |
show details | |

|
#47
NW 42nd Ave
Cape Coral, FL 33993
|
2,772 sq. feet
|
3 baths 3 beds |
show details | |

|
#48
NE Van Loon Ln
Cape Coral, FL 33909
|
1,226 sq. feet
|
2 baths 3 beds |
show details | |

|
#49
Caloosa Rd
Fort Myers, FL 33967
|
1,541 sq. feet
|
2 baths 3 beds |
show details | |

|
Check over 1 million property listings on Foreclosure.com!
|
browse all offers | |||

Latest news about housing in Iona, FL collected exclusively by city-data.com from local newspapers, TV, and radio stations

 | Best Apartments in Fort Myers?!! (21 replies) |
| Homes going up or Down in Price? (1403 replies) |
| Seville Apartments - 7331 Pinnacle Pines Dr., Fort Myers, FL (18 replies) |
| Relocating to Ft.Myers - Good Apartments? (6 replies) |
| Trying to figure out the areas and find our paradise :) (30 replies) |
| Second home mortgages ? (4 replies) |

Median year apartment built: 2000
Household type by relationship:
Households: 15,211- Male householders: 4,308 (1,209 living alone), Female householders: 4,036 (2,159 living alone)
4,304 spouses (4,271 opposite-sex spouses), 245 unmarried partners, (245 opposite-sex unmarried partners), 1,393 children (1,345 natural, 41 adopted, 7 stepchildren), 97 grandchildren, 57 brothers or sisters, 85 parents, 0 foster children, 53 other relatives, 266 non-relatives
- In group quarters: 362
Size of family households: 4,212 2-persons, 431 3-persons, 194 4-persons, 19 5-persons.
Size of nonfamily households: 3,274 1-person, 396 2-persons.
357 married couples with children.
203 single-parent households (7 men, 196 women).
91.7% of residents of Iona speak English at home.
2.6% of residents speak Spanish at home (65% speak English very well, 9% speak English well, 2% speak English not well, 24% don't speak English at all).
3.6% of residents speak other Indo-European language at home (48% speak English very well, 32% speak English well, 21% speak English not well).
1.9% of residents speak Asian or Pacific Island language at home (78% speak English very well, 22% speak English well).
Foreign born population: 1,580 (10.4%)
(51.9% of them are naturalized citizens)
| Here: | 5.1 |
| State: | 5.9 |
| Here: | 4.2 |
| State: | 4.2 |
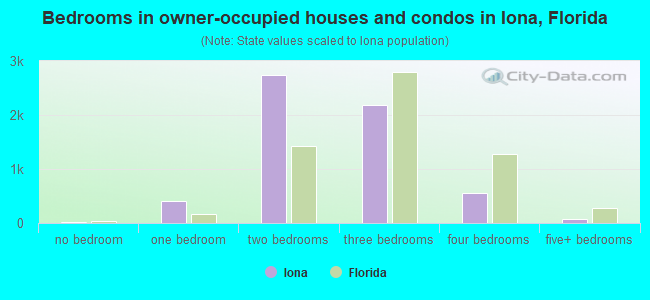
- Bedrooms in owner-occupied houses and condos in Iona, Florida
- 14no bedroom
- 4021 bedroom
- 2,7442 bedrooms
- 2,1913 bedrooms
- 5544 bedrooms
- 725+ bedrooms
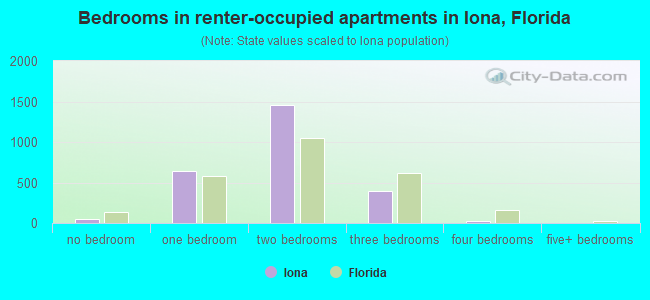
- Bedrooms in renter-occupied apartments in Iona, Florida
- 49no bedroom
- 6391 bedroom
- 1,4612 bedrooms
- 4003 bedrooms
- 204 bedrooms
- 05+ bedrooms
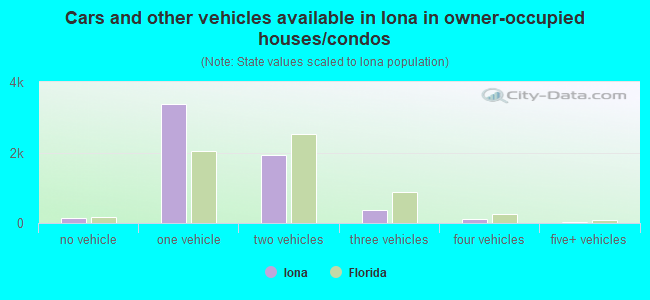
- Cars and other vehicles available in Iona in owner-occupied houses/condos
- 148no vehicle
- 3,3901 vehicle
- 1,9302 vehicles
- 3663 vehicles
- 1094 vehicles
- 345+ vehicles
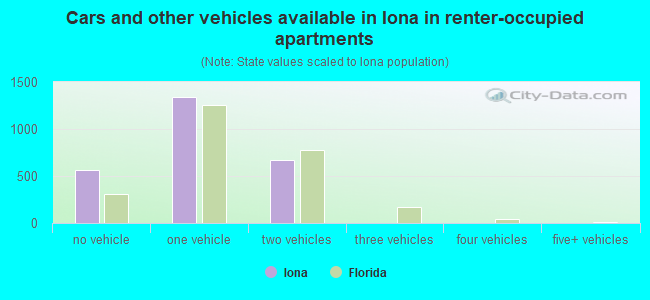
- Cars and other vehicles available in Iona in renter-occupied apartments
- 563no vehicle
- 1,3401 vehicle
- 6652 vehicles
- 03 vehicles
- 04 vehicles
- 05+ vehicles
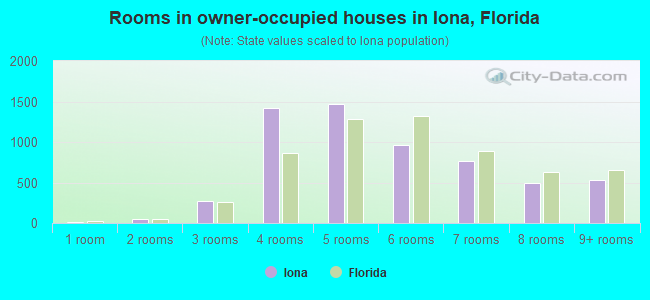
- Rooms in owner-occupied houses in Iona, Florida
- 141 room
- 512 rooms
- 2763 rooms
- 1,4224 rooms
- 1,4635 rooms
- 9586 rooms
- 7717 rooms
- 4968 rooms
- 5259+ rooms
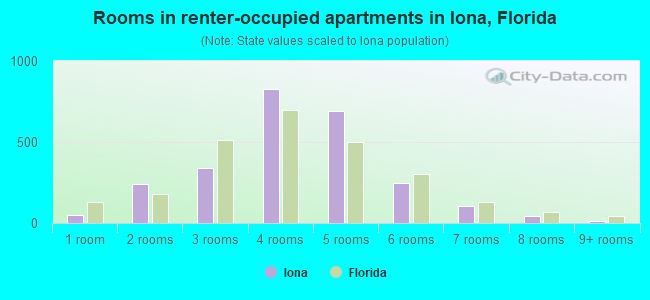
- Rooms in renter-occupied apartments in Iona, Florida
- 491 room
- 2412 rooms
- 3423 rooms
- 8294 rooms
- 6945 rooms
- 2506 rooms
- 1067 rooms
- 468 rooms
- 129+ rooms
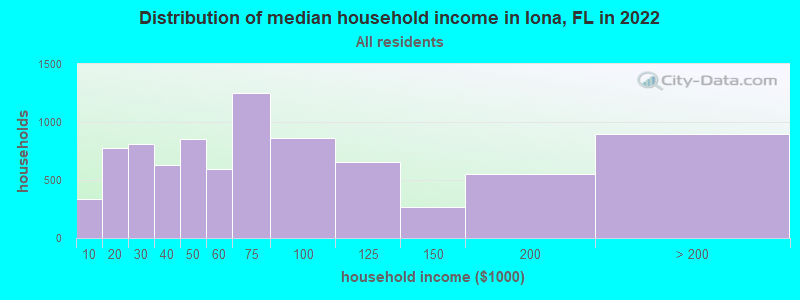
Iona, FL household income distribution

- 332Less than $10,000
- 773$10,000 to $19,999
- 809$20,000 to $29,999
- 629$30,000 to $39,999
- 855$40,000 to $49,999
- 599$50,000 to $59,999
- 1,248$60,000 to $74,999
- 866$75,000 to $99,999
- 659$100,000 to $124,999
- 265$125,000 to $149,999
- 554$150,000 to $199,999
- 899$200,000 or more
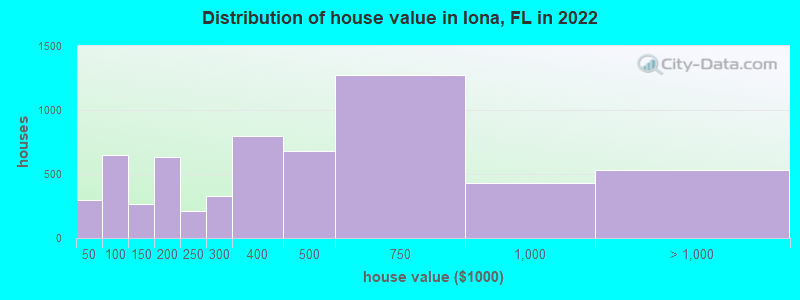
Home value of owner - occupied houses in 2022 in Iona, FL
-
- 141Less than $10,000
- 25$10,000 to $14,999
- 21$15,000 to $19,999
- 14$20,000 to $24,999
- 7$25,000 to $29,999
- 55$30,000 to $34,999
- 10$35,000 to $39,999
- 19$40,000 to $49,999
- 228$50,000 to $59,999
- 165$60,000 to $69,999
- 58$70,000 to $79,999
- 107$80,000 to $89,999
- 71$90,000 to $99,999
- 184$100,000 to $124,999
- 80$125,000 to $149,999
- 370$150,000 to $174,999
- 262$175,000 to $199,999
- 213$200,000 to $249,999
- 327$250,000 to $299,999
- 795$300,000 to $399,999
- 679$400,000 to $499,999
- 1,271$500,000 to $749,999
- 429$750,000 to $999,999
- 290$1,000,000 to $1,499,999
- 159$1,500,000 to $1,999,999
- 78$2,000,000 or more
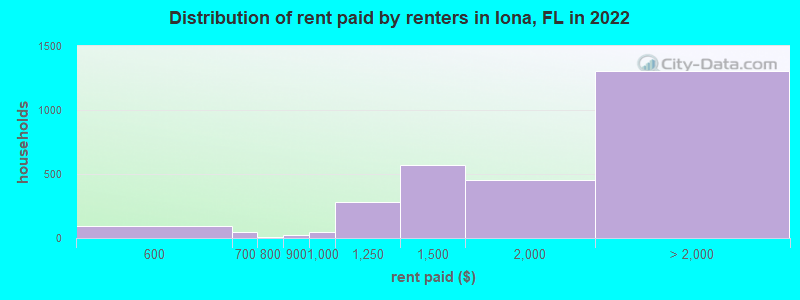
Rent paid by renters in 2022 in Iona, FL
-
- 85$500 to $549
- 7$550 to $599
- 43$600 to $649
- 9$700 to $749
- 20$800 to $899
- 46$900 to $999
- 282$1,000 to $1,249
- 574$1,250 to $1,499
- 455$1,500 to $1,999
- 231$2,000 to $2,499
- 151$2,500 to $2,999
- 345$3,000 to $3,499
- 477$3,500 or more
- 102No cash rent
Percentage of workers working in this county: 95.2%
Number of people working at home: 1,336 (27.9% of all workers)
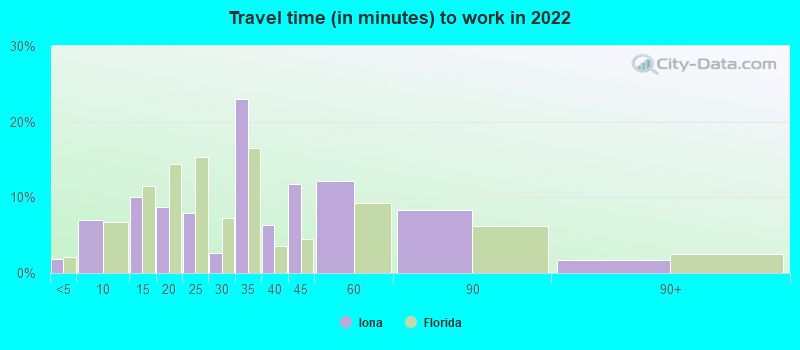
Travel time to work (commute)
- Less than 5 minutes: 65
- 5 to 9 minutes: 334
- 10 to 14 minutes: 406
- 15 to 19 minutes: 657
- 20 to 24 minutes: 585
- 25 to 29 minutes: 311
- 30 to 34 minutes: 534
- 35 to 39 minutes: 81
- 40 to 44 minutes: 200
- 45 to 59 minutes: 269
- 60 to 89 minutes: 95
- 90 or more minutes: 0
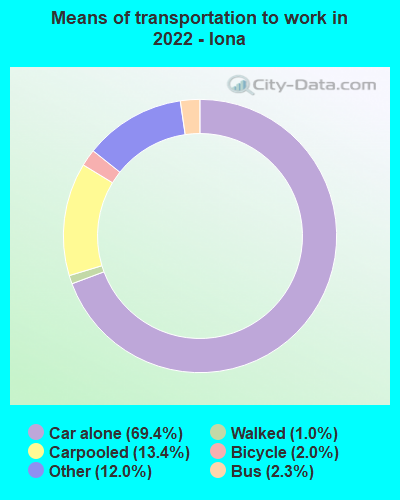
Means of transportation to work:
- Drove a car alone: 2,315 (50.7%)
- Carpooled: 546 (12.0%)
- Bus: 96 (2.1%)
- Taxi: 279 (6.1%)
- Bicycle: 40 (0.9%)
- Walked: 34 (0.7%)
- Worked at home: 1,336 (29.3%)
- Unemployment by race in 2022
- Unemployment rate for White non-Hispanic residents
- 2.8%Males
- 0.9%Females
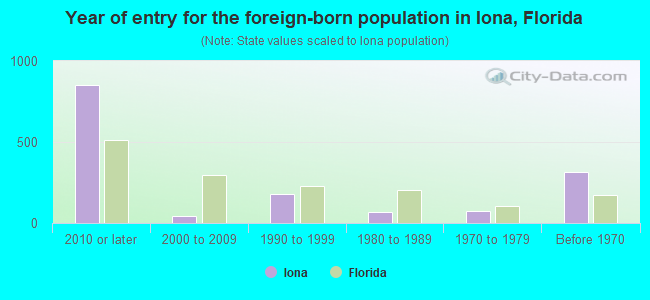
- Year of entry for the foreign-born population in Iona, Florida
- 8512010 or later
- 452000 to 2009
- 1791990 to 1999
- 661980 to 1989
- 711970 to 1979
- 313Before 1970
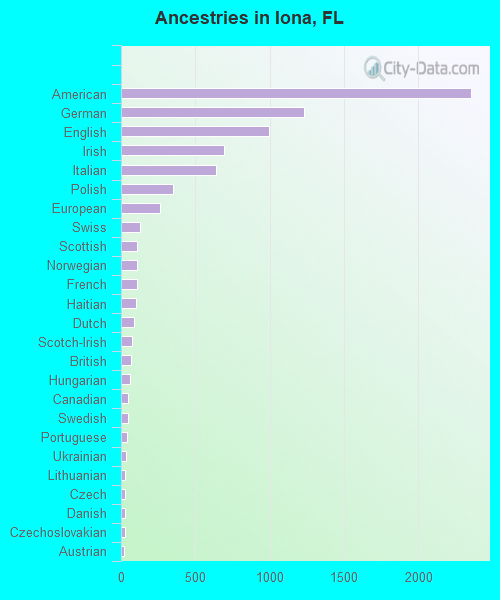
First ancestries reported:
- American: 2,360 (27.0%)
- German: 1,232 (14.1%)
- English: 997 (11.4%)
- Irish: 694 (7.9%)
- Italian: 639 (7.3%)
- Polish: 351 (4.0%)
- European: 260 (3.0%)
- Swiss: 125 (1.4%)
- Scottish: 106 (1.2%)
- Norwegian: 105 (1.2%)
- French: 105 (1.2%)
- Haitian: 99 (1.1%)
- Dutch: 87 (1.0%)
- Scotch-Irish: 75 (0.9%)
- British: 64 (0.7%)
- Hungarian: 59 (0.7%)
- Canadian: 49 (0.6%)
- Swedish: 45 (0.5%)
- Portuguese: 42 (0.5%)
- Ukrainian: 36 (0.4%)
- Lithuanian: 26 (0.3%)
- Czech: 26 (0.3%)
- Danish: 25 (0.3%)
- Czechoslovakian: 24 (0.3%)
- Austrian: 23 (0.3%)
- Russian: 21 (0.2%)
- Welsh: 20 (0.2%)
- Greek: 19 (0.2%)
- French Canadian: 19 (0.2%)
- Lebanese: 16 (0.2%)
- Northern European: 15 (0.2%)
- Belgian: 15 (0.2%)
- Eastern European: 12 (0.1%)
- African: 12 (0.1%)
- Croatian: 10 (0.1%)
- Celtic: 10 (0.1%)
- Slovene: 10 (0.1%)
- Finnish: 9 (0.1%)
- Brazilian: 7 (0.08%)
- German Russian: 5 (0.06%)
- Palestinian: 4 (0.05%)
Most common places of birth for foreign-born residents (%):
| Iona: | 12.8% (185) |
| Florida: | 2.1% (94,349) |
| Iona: | 12.8% (184) |
| Florida: | 2.4% (109,132) |
| Iona: | 8.5% (123) |
| Florida: | 1.8% (84,403) |
| Iona: | 7.3% (105) |
| Florida: | 0.2% (8,103) |
| Iona: | 6.7% (97) |
| Florida: | 7.5% (342,375) |
| Iona: | 6.6% (95) |
| Florida: | 1.2% (54,272) |
| Iona: | 5.3% (76) |
| Florida: | 0.7% (34,227) |
| Iona: | 4.6% (66) |
| Florida: | 5.7% (262,042) |
| Iona: | 4.0% (57) |
| Florida: | 2.1% (97,632) |
| Iona: | 3.3% (48) |
| Florida: | 0.1% (3,914) |
| Iona: | 3.0% (43) |
| Florida: | 0.2% (9,421) |
| Iona: | 2.2% (32) |
| Florida: | 6.5% (298,669) |
| Iona: | 2.2% (31) |
| Florida: | 22.0% (1,006,576) |
| Iona: | 2.1% (30) |
| Florida: | 2.3% (107,160) |
| Iona: | 1.7% (25) |
| Florida: | 0.8% (37,723) |
| Iona: | 1.6% (23) |
| Florida: | 0.2% (9,122) |
Place of birth for U.S.-born residents:
- This state: 1,740
- Other state: 11,577
- Northeast: 4,426
- Midwest: 5,210
- South: 1,353
- West: 546
89.6% of Iona residents lived in the same house 1 years ago.
Out of people who lived in different houses, 28.2% lived in this county.
Out of people who lived in different counties, 12.1% lived in Florida.
| Iona: | 89.6% |
| State average: | 86.3% |
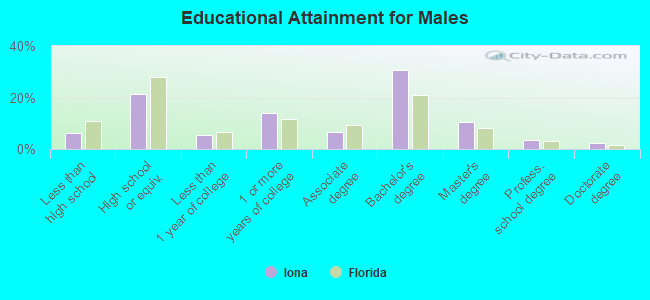
Education attainment for males 25 years and older:
- No schooling: 21
- Nursery to 4th grade: 0
- 5th and 6th grade: 0
- 7th and 8th grade: 123
- 9th grade: 0
- 10th grade: 128
- 11th grade: 35
- 12th grade, no diploma: 78
- High school graduate (or equivalency): 1,361
- Less than 1 year of college: 339
- Some college more than 1 year, no degree: 885
- Associate degree: 420
- Bachelor's degree: 1,948
- Master's degree: 667
- Professional school degree: 230
- Doctorate degree: 140
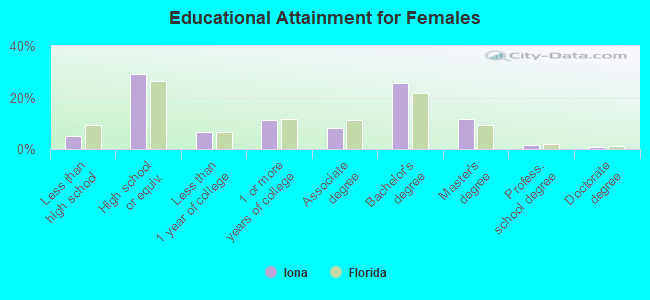
Education attainment for females 25 years and older:
- No schooling: 67
- Nursery to 4th grade: 0
- 5th and 6th grade: 0
- 7th and 8th grade: 41
- 9th grade: 10
- 10th grade: 39
- 11th grade: 74
- 12th grade, no diploma: 163
- High school graduate (or equivalency): 2,231
- Less than 1 year of college: 506
- Some college more than 1 year, no degree: 877
- Associate degree: 618
- Bachelor's degree: 1,979
- Master's degree: 889
- Professional school degree: 108
- Doctorate degree: 74


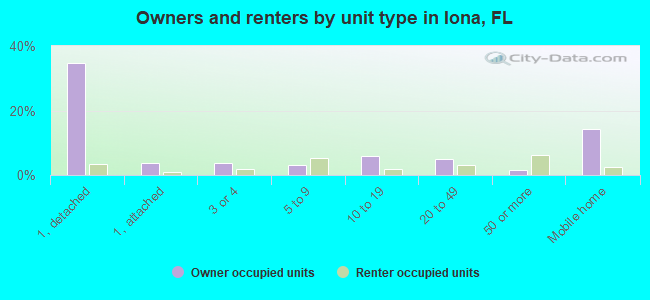
Housing units in structures:
- One, detached: 3,376
- One, attached: 367
- Two: 254
- 3 or 4: 1,025
- 5 to 9: 1,506
- 10 to 19: 1,435
- 20 to 49: 2,012
- 50 or more: 1,100
- Mobile homes: 3,186
- Boats, RVs, vans, etc.: 13
Median worth of mobile homes: $109,886
Housing units lacking complete kitchen facilities in 2022: 0.9%
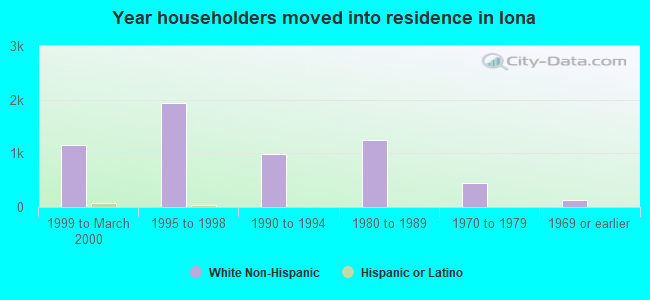
House/condo owner moved in on average 9 years ago
Renter moved in on average 5 years ago
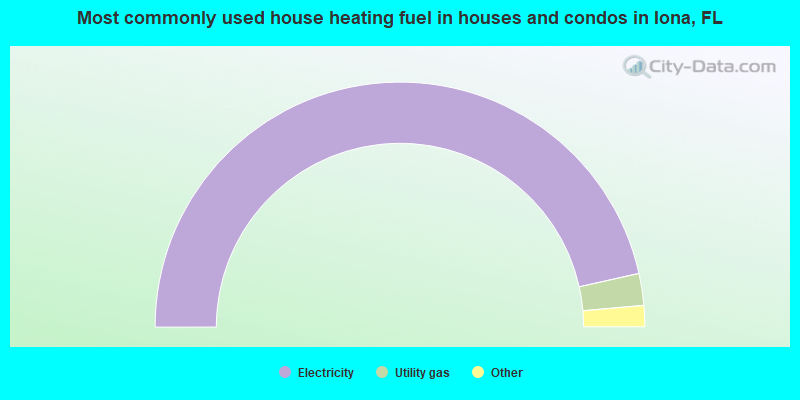
- 93.0%Electricity
- 4.2%Utility gas
- 1.3%No fuel used
- 1.1%Bottled, tank, or LP gas
- 0.4%Solar energy
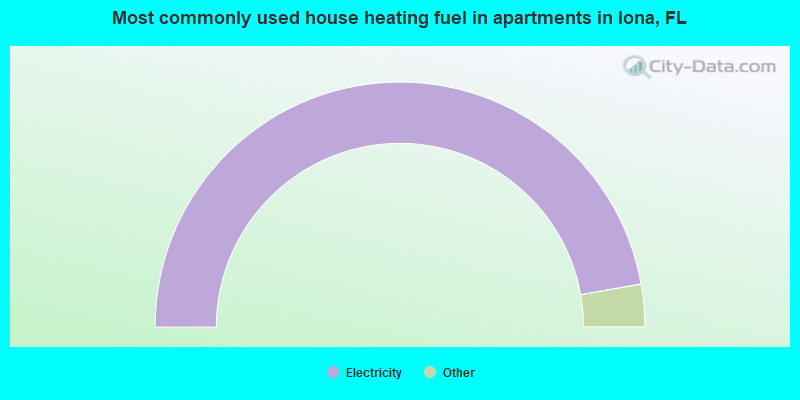
- 94.4%Electricity
- 2.8%Utility gas
- 1.4%Other fuel
- 1.3%No fuel used
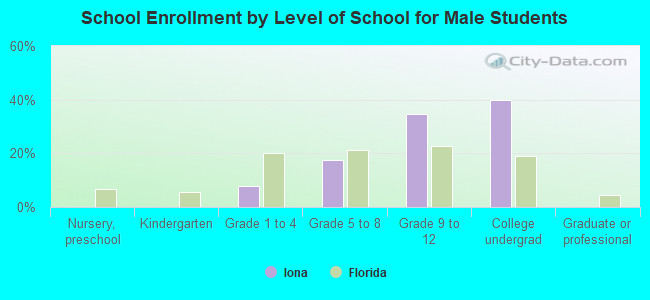
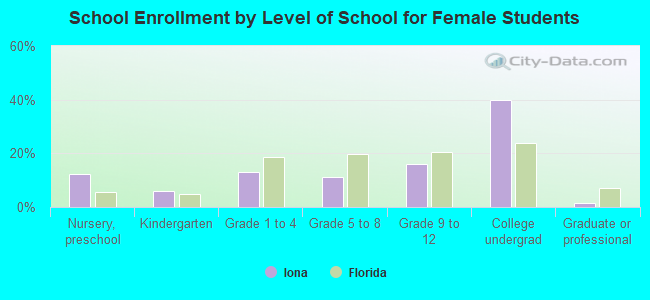
Private vs. public school enrollment:
| Here: | 12.9% |
| Florida: | 15.8% |
| Here: | 17.5% |
| Florida: | 12.9% |
| Here: | 9.4% |
| Florida: | 23.6% |