Inkster, MI (Michigan) Houses and Residents
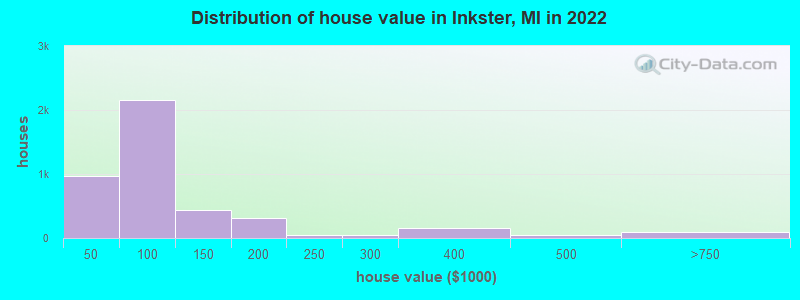
Estimated median house or condo value in 2022: $75,482 (it was $67,300 in 2000 )
Inkster:
$75,482Michigan:
$224,400
Lower value quartile - upper value quartile: $54,364 - $111,125Mean price in 2022: Detached houses: $81,153 Here:
$81,153State:
$280,038
Townhouses or other attached units: $83,535 Here:
$83,535State:
$239,520
Mobile homes: $362,965 Here:
$362,965State:
$72,868
Total population: 24,786 (All urban)
Houses: 11,064 (9,208 occupied: 4,118 owner occupied, 5,142 renter occupied )
% of renters here:
56%State:
27%
Housing density: 1,766 houses/condos per square mile
Median price asked for vacant for-sale houses and condos in 2022: $75,029.
Median contract rent in 2022: $827 (lower quartile is $656, upper quartile is $1,010)
Median rent asked for vacant for-rent units in 2022: $1,043
Median gross rent in Inkster, MI in 2022: $1,102
Housing units in Inkster with a mortgage: 1,660 (177 second mortgage, 0 home equity loan, 151 both second mortgage and home equity loan )Houses without a mortgage: 30
Median household income for houses/condos with a mortgage: $57,035
Median household income for apartments without a mortgage: $48,360
Median monthly housing costs: $950
Data:
Median house or condo value ($)
Median house or condo value ($ change since 2000)
Median house or condo value ($) - White
Median house or condo value ($) - Black or African American
Median house or condo value ($) - Asian
Median house or condo value ($) - Hispanic or Latino
Median house or condo value ($) - American Indian and Alaska Native
Median house or condo value ($) - Multirace
Median house or condo value ($) - Other Race
Median price asked for mobile homes ($)
Household density (households per square mile)
Mean house or condo value by units in structure - 1, detached ($)
Mean house or condo value by units in structure - 1, attached ($)
Mean house or condo value by units in structure - 2 ($)
Mean house or condo value by units in structure by units in structure - 3 or 4 ($)
Mean house or condo value by units in structure - 5 or more ($)
Mean house or condo value by units in structure - Boat, RV, van, etc. ($)
Mean house or condo value by units in structure - Mobile home ($)
Median contract rent ($)
Median contract rent - Lower quartile ($)
Median contract rent - Upper quartile ($)
Median gross rent ($)
Urban houses (%)
Rural houses (%)
Houses occupied (%)
Houses occupied (% change since 2000)
Houses owner occupied (%)
Houses owner occupied (% change since 2000)
Houses renter occupied (%)
Houses renter occupied (% change since 2000)
Vacant housing units - For rent (%)
Vacant housing units - For rent (% change since 2000)
Vacant housing units - For sale only (%)
Vacant housing units - For sale only (% change since 2000)
Vacant housing units - Rented or sold, not occupied (%)
Vacant housing units - Rented or sold, not occupied (% change since 2000)
Vacant housing units - For seasonal, recreational, or occasional use (%)
Vacant housing units - For seasonal, recreational, or occasional use (% change since 2000)
Vacant housing units - For migrant workers (%)
Vacant housing units - For migrant workers (% change since 2000)
Vacant housing units - Other vacant (%)
Vacant housing units - Other vacant (% change since 2000)
Median monthly housing costs ($)
Median household income for houses/condos with a mortgage ($)
Median household income for houses/condos without a mortgage ($)
Median household income ($)
Median household income ($) - White
Median household income ($) - Black or African American
Median household income ($) - Asian
Median household income ($) - Hispanic or Latino
Median household income ($) - American Indian and Alaska Native
Median household income ($) - Multirace
Median household income ($) - Other Race
Mortgage status - with mortgage (%)
Mortgage status - with second mortgage (%)
Mortgage status - with home equity loan (%)
Mortgage status - with both second mortgage and home equity loan (%)
Mortgage status - without a mortgage (%)
Median year house/condo built
Median year apartment built
Household type by relationship - Male householder living alone (%)
Household type by relationship - Male householder not living alone (%)
Household type by relationship - Female householder living alone (%)
Household type by relationship - Female householder not living alone (%)
Household type by relationship - Opposite-Sex spouse (%)
Household type by relationship - Same-Sex spouse (%)
Household type by relationship - Opposite-Sex unmarried partner (%)
Household type by relationship - Same-Sex unmarried partner (%)
Household type by relationship - In group quarters (%)
Size of family households - 2-person household (%)
Size of family households - 3-person household (%)
Size of family households - 4-person household (%)
Size of family households - 5-person household (%)
Size of family households - 6-person household (%)
Size of family households - 7-or-more-person household (%)
Size of nonfamily households - 1-person household (%)
Size of nonfamily households - 2-person household (%)
Size of nonfamily households - 3-person household (%)
Size of nonfamily households - 4-person household (%)
Size of nonfamily households - 5-person household (%)
Size of nonfamily households - 6-person household (%)
Size of nonfamily households - 7-or-moreperson household (%)
Year house built - Built 2010 or later (%)
Year house built - Built 2000 to 2009 (%)
Year house built - Built 1990 to 1999 (%)
Year house built - Built 1980 to 1989 (%)
Year house built - Built 1970 to 1979 (%)
Year house built - Built 1960 to 1969 (%)
Year house built - Built 1950 to 1959 (%)
Year house built - Built 1940 to 1949 (%)
Year house built - Built 1939 or earlier (%)
Median number of rooms in houses and condos
Median number of rooms in apartments
Median number of bedrooms in owner occupied houses
Mean number of bedrooms in owner occupied houses
Median number of bedrooms in renter occupied houses
Mean number of bedrooms in renter occupied houses
Median number of vehichles in owner occupied houses
Mean number of vehichles in owner occupied houses
Median number of vehichles in renter occupied houses
Mean number of vehichles in renter occupied houses
Rooms in owner-occupied houses - 1 room (%)
Rooms in owner-occupied houses - 2 rooms (%)
Rooms in owner-occupied houses - 3 rooms (%)
Rooms in owner-occupied houses - 4 rooms (%)
Rooms in owner-occupied houses - 5 rooms (%)
Rooms in owner-occupied houses - 6 rooms (%)
Rooms in owner-occupied houses - 7 rooms (%)
Rooms in owner-occupied houses - 8 rooms (%)
Rooms in owner-occupied houses - 9+ rooms (%)
Rooms in renter-occupied houses - 1 room (%)
Rooms in renter-occupied houses - 2 rooms (%)
Rooms in renter-occupied houses - 3 rooms (%)
Rooms in renter-occupied houses - 4 rooms (%)
Rooms in renter-occupied houses - 5 rooms (%)
Rooms in renter-occupied houses - 6 rooms (%)
Rooms in renter-occupied houses - 7 rooms (%)
Rooms in renter-occupied houses - 8 rooms (%)
Rooms in renter-occupied houses - 9+ rooms (%)
Bedrooms in owner-occupied houses - no bedrooms (%)
Bedrooms in owner-occupied houses - 1 bedroom (%)
Bedrooms in owner-occupied houses - 2 bedrooms (%)
Bedrooms in owner-occupied houses - 3 bedrooms (%)
Bedrooms in owner-occupied houses - 4 bedrooms (%)
Bedrooms in owner-occupied houses - 5+ bedrooms (%)
Bedrooms in renter-occupied houses - no bedrooms (%)
Bedrooms in renter-occupied houses - 1 bedroom (%)
Bedrooms in renter-occupied houses - 2 bedrooms (%)
Bedrooms in renter-occupied houses - 3 bedrooms (%)
Bedrooms in renter-occupied houses - 4 bedrooms (%)
Bedrooms in renter-occupied houses - 5+ bedrooms (%)
Vehicles available in owner-occupied houses - no vehicle available (%)
Vehicles available in owner-occupied houses - 1 vehicle available(%)
Vehicles available in owner-occupied houses - 2 Vehicles available (%)
Vehicles available in owner-occupied houses - 3 Vehicles available (%)
Vehicles available in owner-occupied houses - 4 Vehicles available (%)
Vehicles available in owner-occupied houses - 5+ Vehicles available (%)
Vehicles available in renter-occupied houses - no vehicle available (%)
Vehicles available in renter-occupied houses - 1 vehicle available (%)
Vehicles available in renter-occupied houses - 2 Vehicles available (%)
Vehicles available in renter-occupied houses - 3 Vehicles available (%)
Vehicles available in renter-occupied houses - 4 Vehicles available (%)
Vehicles available in renter-occupied houses - 5+ Vehicles available (%)
Housing units in structures - 1, detached (%)
Housing units in structures - 1, attached (%)
Housing units in structures - 2 (%)
Housing units in structures - 3 or 4 (%)
Housing units in structures - 5 to 9 (%)
Housing units in structures - 10 to 19 (%)
Housing units in structures - 20 to 49 (%)
Housing units in structures - 50 or more (%)
Housing units in structures - Mobile home (%)
Housing units in structures - Boat, RV, van, etc. (%)
Housing units in structures - Owners - 1, detached (%)
Housing units in structures - Owners - 1, attached (%)
Housing units in structures - Owners - 2 (%)
Housing units in structures - Owners - 3 or 4 (%)
Housing units in structures - Owners - 5 to 9 (%)
Housing units in structures - Owners - 10 to 19 (%)
Housing units in structures - Owners - 20 to 49 (%)
Housing units in structures - Owners - 50 or more (%)
Housing units in structures - Owners - Mobile home (%)
Housing units in structures - Owners - Boat, RV, van, etc. (%)
Housing units in structures - Renters - 1, detached (%)
Housing units in structures - Renters - 1, attached (%)
Housing units in structures - Renters - 2 (%)
Housing units in structures - Renters - 3 or 4 (%)
Housing units in structures - Renters - 5 to 9 (%)
Housing units in structures - Renters - 10 to 19 (%)
Housing units in structures - Renters - 20 to 49 (%)
Housing units in structures - Renters - 50 or more (%)
Housing units in structures - Renters - Mobile home (%)
Housing units in structures - Renters - Boat, RV, van, etc. (%)
House/condo owner moved in on average (years ago)
Renter moved in on average (years ago)
Year householder moved into unit - Moved in 1999 to March 2000 (%)
Year householder moved into unit - Moved in 1999 to March 2000 (%) - White
Year householder moved into unit - Moved in 1999 to March 2000 (%) - Black or African American
Year householder moved into unit - Moved in 1999 to March 2000 (%) - Asian
Year householder moved into unit - Moved in 1999 to March 2000 (%) - Hispanic or Latino
Year householder moved into unit - Moved in 1999 to March 2000 (%) - American Indian and Alaska Native
Year householder moved into unit - Moved in 1999 to March 2000 (%) - Multirace
Year householder moved into unit - Moved in 1999 to March 2000 (%) - Other Race
Year householder moved into unit - Moved in 1995 to 1998 (%)
Year householder moved into unit - Moved in 1995 to 1998 (%) - White
Year householder moved into unit - Moved in 1995 to 1998 (%) - Black or African American
Year householder moved into unit - Moved in 1995 to 1998 (%) - Asian
Year householder moved into unit - Moved in 1995 to 1998 (%) - Hispanic or Latino
Year householder moved into unit - Moved in 1995 to 1998 (%) - American Indian and Alaska Native
Year householder moved into unit - Moved in 1995 to 1998 (%) - Multirace
Year householder moved into unit - Moved in 1995 to 1998 (%) - Other Race
Year householder moved into unit - Moved in 1990 to 1994 (%)
Year householder moved into unit - Moved in 1990 to 1994 (%) - White
Year householder moved into unit - Moved in 1990 to 1994 (%) - Black or African American
Year householder moved into unit - Moved in 1990 to 1994 (%) - Asian
Year householder moved into unit - Moved in 1990 to 1994 (%) - Hispanic or Latino
Year householder moved into unit - Moved in 1990 to 1994 (%) - American Indian and Alaska Native
Year householder moved into unit - Moved in 1990 to 1994 (%) - Multirace
Year householder moved into unit - Moved in 1990 to 1994 (%) - Other Race
Year householder moved into unit - Moved in 1980 to 1989 (%)
Year householder moved into unit - Moved in 1980 to 1989 (%) - White
Year householder moved into unit - Moved in 1980 to 1989 (%) - Black or African American
Year householder moved into unit - Moved in 1980 to 1989 (%) - Asian
Year householder moved into unit - Moved in 1980 to 1989 (%) - Hispanic or Latino
Year householder moved into unit - Moved in 1980 to 1989 (%) - American Indian and Alaska Native
Year householder moved into unit - Moved in 1980 to 1989 (%) - Multirace
Year householder moved into unit - Moved in 1980 to 1989 (%) - Other Race
Year householder moved into unit - Moved in 1970 to 1979 (%)
Year householder moved into unit - Moved in 1970 to 1979 (%) - White
Year householder moved into unit - Moved in 1970 to 1979 (%) - Black or African American
Year householder moved into unit - Moved in 1970 to 1979 (%) - Asian
Year householder moved into unit - Moved in 1970 to 1979 (%) - Hispanic or Latino
Year householder moved into unit - Moved in 1970 to 1979 (%) - American Indian and Alaska Native
Year householder moved into unit - Moved in 1970 to 1979 (%) - Multirace
Year householder moved into unit - Moved in 1970 to 1979 (%) - Other Race
Year householder moved into unit - Moved in 1969 or earlier (%)
Year householder moved into unit - Moved in 1969 or earlier (%) - White
Year householder moved into unit - Moved in 1969 or earlier (%) - Black or African American
Year householder moved into unit - Moved in 1969 or earlier (%) - Asian
Year householder moved into unit - Moved in 1969 or earlier (%) - Hispanic or Latino
Year householder moved into unit - Moved in 1969 or earlier (%) - American Indian and Alaska Native
Year householder moved into unit - Moved in 1969 or earlier (%) - Multirace
Year householder moved into unit - Moved in 1969 or earlier (%) - Other Race
Housing units lacking complete plumbing facilities (%)
Housing units lacking complete kitchen facilities (%)
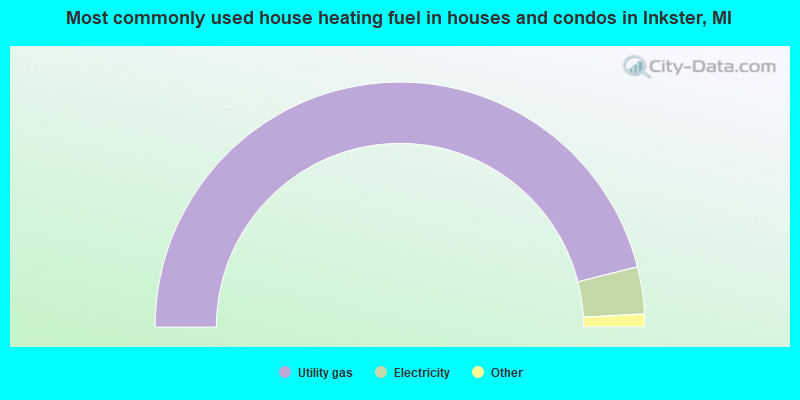
House heating fuel used in houses and condos - Utility gas (%)
House heating fuel used in houses and condos - Bottled, tank, or LP gas (%)
House heating fuel used in houses and condos - Electricity (%)
House heating fuel used in houses and condos - Fuel oil, kerosene, etc. (%)
House heating fuel used in houses and condos - Coal or coke (%)
House heating fuel used in houses and condos - Wood (%)
House heating fuel used in houses and condos - Solar energy (%)
House heating fuel used in houses and condos - Other fuel (%)
House heating fuel used in houses and condos - No fuel used (%)
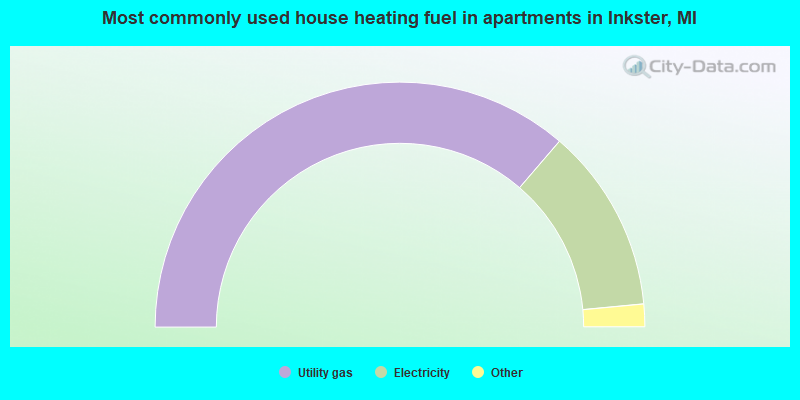
House heating fuel used in apartments - Utility gas (%)
House heating fuel used in apartments - Bottled, tank, or LP gas (%)
House heating fuel used in apartments - Electricity (%)
House heating fuel used in apartments - Fuel oil, kerosene, etc. (%)
House heating fuel used in apartments - Coal or coke (%)
House heating fuel used in apartments - Wood (%)
House heating fuel used in apartments - Solar energy (%)
House heating fuel used in apartments - Other fuel (%)
House heating fuel used in apartments - No fuel used (%)
Latest news about housing in Inkster, MI collected exclusively by city-data.com from local newspapers, TV, and radio stations
Median year house/condo built: 1956Median year apartment built: 1958Household type by relationship:
Households: 25,482
Male householders: 3,415 (1,480 living alone ), Female householders: 5,679 (1,480 living alone )1,975 spouses (1,957 opposite-sex spouses ), 881 unmarried partners , (859 opposite-sex unmarried partners ), 9,259 children (8,793 natural , 180 adopted , 285 stepchildren ), 1,120 grandchildren , 710 brothers or sisters , 421 parents , 0 foster children , 913 other relatives , 866 non-relatives In group quarters: 239
Size of family households: 2,290 2-persons , 1,340 3-persons , 1,007 4-persons , 605 5-persons , 281 6-persons , 153 7-or-more-persons .
Size of nonfamily households: 3,067 1-person , 425 2-persons , 42 3-persons , 19 4-persons , 11 5-persons .
1,677 married couples with children. single-parent households (745 men , 3,704 women ).
92.2% of residents of Inkster speak English at home. of residents speak Spanish at home (72% speak English very well , 21% speak English well , 7% speak English not well ).of residents speak other Indo-European language at home (91% speak English very well , 6% speak English well , 2% speak English not well ).of residents speak Asian or Pacific Island language at home (72% speak English very well , 25% speak English well , 3% speak English not well ).of residents speak other language at home (52% speak English very well , 27% speak English well , 15% speak English not well , 6% don't speak English at all ).
Foreign born population: 1,151 (4.5%)of them are naturalized citizens )
Median number of rooms in houses and condos:
Median number of rooms in apartments
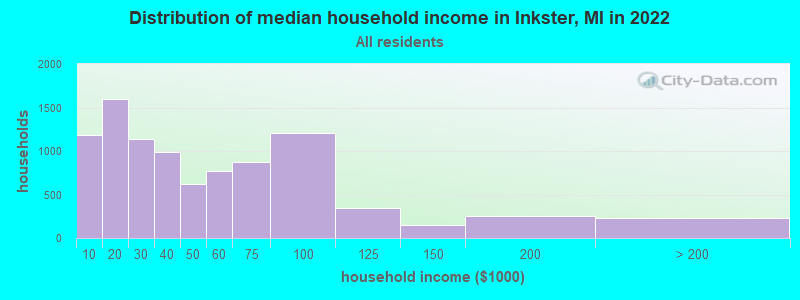
Inkster, MI household income distribution 1,181 Less than $10,0001,595 $10,000 to $19,9991,133 $20,000 to $29,999987 $30,000 to $39,999615 $40,000 to $49,999770 $50,000 to $59,999876 $60,000 to $74,9991,203 $75,000 to $99,999344 $100,000 to $124,999154 $125,000 to $149,999252 $150,000 to $199,999227 $200,000 or more
Home value of owner - occupied houses in 2022 in Inkster, MI 43 Less than $10,00030 $10,000 to $14,99966 $15,000 to $19,99950 $20,000 to $24,999103 $25,000 to $29,999133 $30,000 to $34,999116 $35,000 to $39,999424 $40,000 to $49,999281 $50,000 to $59,999505 $60,000 to $69,999469 $70,000 to $79,999279 $80,000 to $89,999190 $90,000 to $99,999327 $100,000 to $124,999114 $125,000 to $149,999307 $150,000 to $174,9995 $175,000 to $199,99950 $200,000 to $249,99953 $250,000 to $299,999149 $300,000 to $399,99948 $400,000 to $499,99991 $500,000 to $749,9996 $1,000,000 to $1,499,999Rent paid by renters in 2022 in Inkster, MI 189 Less than $10054 $100 to $149107 $150 to $199161 $200 to $249207 $250 to $29972 $300 to $34932 $400 to $44942 $450 to $49984 $500 to $54991 $550 to $59969 $600 to $649207 $650 to $699259 $700 to $749404 $750 to $799837 $800 to $899642 $900 to $999708 $1,000 to $1,249128 $1,250 to $1,4992 $1,500 to $1,999506 No cash rent
Percentage of workers working in this county: 82.6%Number of people working at home: 889 (9.4% of all workers )
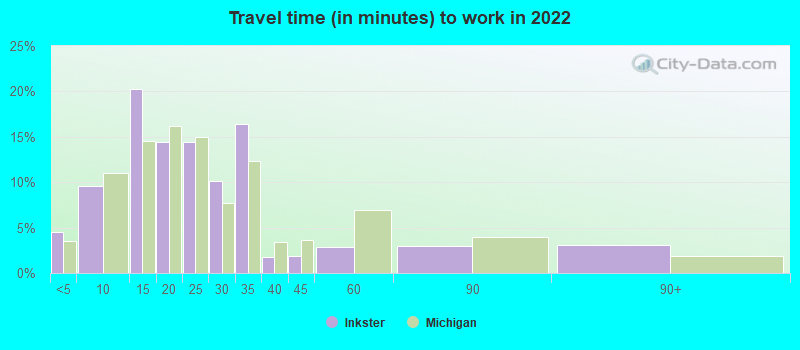
Travel time to work (commute)
Less than 5 minutes: 2295 to 9 minutes: 42310 to 14 minutes: 96115 to 19 minutes: 1,14320 to 24 minutes: 1,85425 to 29 minutes: 1,00830 to 34 minutes: 1,09835 to 39 minutes: 14840 to 44 minutes: 16145 to 59 minutes: 60160 to 89 minutes: 60890 or more minutes: 149
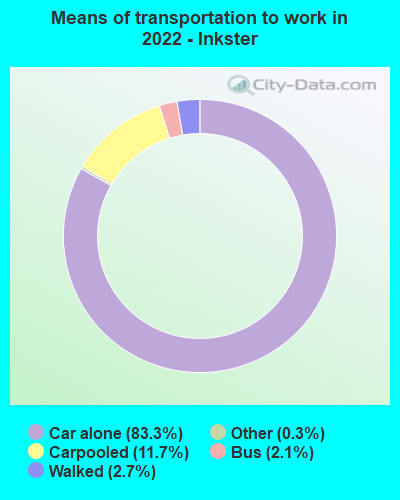
Means of transportation to work:
Drove a car alone: 2,366 (65.6%)Carpooled: 327 (9.1%)Bus : 49 (1.4%)Taxi: 8 (0.2%)Walked: 82 (2.3%)Worked at home: 889 (24.7%)
Unemployment by race in 2022
Unemployment rate for White non-Hispanic residents 9.1% Males9.5% FemalesUnemployment rate for Black residents 11.4% Males7.8% FemalesUnemployment rate for Asian residents 100.0% FemalesUnemployment rate for other race residents 67.9% FemalesUnemployment rate for two or more race residents 2.3% FemalesUnemployment rate for Hispanic or Latino residents 51.0% Females
Year of entry for the foreign-born population in Inkster, Michigan
461 2010 or later 336 2000 to 2009 118 1990 to 1999 158 1980 to 1989 42 1970 to 1979 259 Before 1970
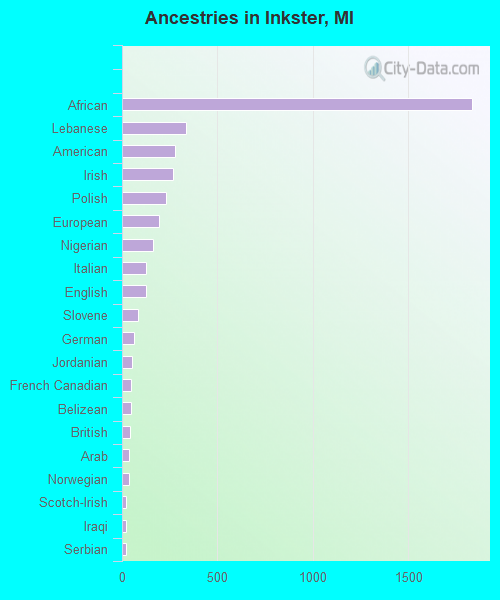
First ancestries reported:
African: 1,830 (10.8%)
Lebanese: 335 (2.0%)
American: 277 (1.6%)
Irish: 268 (1.6%)
Polish: 228 (1.3%)
European: 194 (1.1%)
Nigerian: 163 (1.0%)
Italian: 127 (0.7%)
English: 124 (0.7%)
Slovene: 86 (0.5%)
German: 65 (0.4%)
Jordanian: 52 (0.3%)
French Canadian: 47 (0.3%)
Belizean: 47 (0.3%)
British: 43 (0.3%)
Arab: 39 (0.2%)
Norwegian: 36 (0.2%)
Scotch-Irish: 23 (0.1%)
Iraqi: 22 (0.1%)
Serbian: 19 (0.1%)
Iranian: 16 (0.09%)
Russian: 16 (0.09%)
Macedonian: 14 (0.08%)
Kenyan: 12 (0.07%)
Swedish: 12 (0.07%)
Slovak: 11 (0.06%)
Liberian: 10 (0.06%)
Greek: 10 (0.06%)
French: 9 (0.05%)
Hungarian: 8 (0.05%)
Jamaican: 7 (0.04%)
Finnish: 6 (0.04%)
Scottish: 5 (0.03%)
Canadian: 4 (0.02%)
Armenian: 2 (0.01%)
Maltese: 2 (0.01%) Most common places of birth for foreign-born residents (%): Iraq Inkster:
23.8% (267)Michigan:
8.1% (55,954)
Lebanon Inkster:
12.6% (141)Michigan:
3.7% (25,634)
Nigeria Inkster:
8.9% (100)Michigan:
0.9% (5,964)
China, excluding Hong Kong and Taiwan Inkster:
8.8% (99)Michigan:
4.9% (34,295)
Pakistan Inkster:
5.4% (61)Michigan:
1.5% (10,596)
Scotland Inkster:
4.6% (52)Michigan:
0.2% (1,597)
India Inkster:
4.3% (48)Michigan:
11.1% (77,240)
Belize Inkster:
4.0% (45)Michigan:
0.0% (225)
Mexico Inkster:
3.9% (44)Michigan:
10.9% (75,965)
Germany Inkster:
3.2% (36)Michigan:
2.3% (16,126)
Vietnam Inkster:
2.6% (29)Michigan:
1.8% (12,679)
Russia Inkster:
2.6% (29)Michigan:
0.9% (6,326)
Trinidad and Tobago Inkster:
1.5% (17)Michigan:
0.2% (1,188)
Place of birth for U.S.-born residents:
This state: 20,676Other state: 3,510Northeast: 321Midwest: 1,084South: 1,886West: 196 82.9% of Inkster residents lived in the same house 1 years ago.
Out of people who lived in different houses, 41.7% lived in this county.
Out of people who lived in different counties, 75.4% lived in Michigan.
Inkster:
82.9%State average:
88.4%
Education attainment for males 25 years and older:
No schooling: 166Nursery to 4th grade: 135th and 6th grade: 07th and 8th grade: 399th grade: 11210th grade: 17511th grade: 36212th grade, no diploma: 244High school graduate (or equivalency): 3,025Less than 1 year of college: 578Some college more than 1 year, no degree: 1,452Associate degree: 415Bachelor's degree: 424Master's degree: 233Professional school degree: 0Doctorate degree: 25
Education attainment for females 25 years and older:
No schooling: 202Nursery to 4th grade: 435th and 6th grade: 07th and 8th grade: 179th grade: 14010th grade: 37711th grade: 43312th grade, no diploma: 374High school graduate (or equivalency): 2,921Less than 1 year of college: 817Some college more than 1 year, no degree: 1,594Associate degree: 730Bachelor's degree: 1,035Master's degree: 315Professional school degree: 7Doctorate degree: 3
Housing units in structures:
One, detached: 8,216One, attached: 167Two: 2803 or 4: 3105 to 9: 57710 to 19: 62720 to 49: 23450 or more: 529Mobile homes: 120Housing units lacking complete plumbing facilities in 2022: 5.6%Housing units lacking complete kitchen facilities in 2022: 8.0%House/condo owner moved in on average 18 years ago
Renter moved in on average 5 years ago
Private vs. public school enrollment:
Students in private schools in grades 1 to 8 (elementary and middle school): 169 Students in private schools in grades 9 to 12 (high school): 47 Students in private undergraduate colleges: 62