Huntington Station, NY (New York) Houses and Residents
| Huntington Station: | $541,920 |
| New York: | $400,400 |
Mean price in 2022:
Detached houses: $482,544
Here: $482,544 State: $476,719 Townhouses or other attached units: $572,143
Here: $572,143 State: $699,270 In 2-unit structures: $571,412
Here: $571,412 State: $713,077 In 3-to-4-unit structures: $437,074
Here: $437,074 State: $764,568 In 5-or-more-unit structures: $870,652
Here: $870,652 State: $912,009
Total population: 33,029 (Urban population: 29,968, Rural population: 0)
Houses: 11,473 (11,043 occupied: 8,529 owner occupied, 2,509 renter occupied)
| % of renters here: | 23% |
| State: | 46% |
Housing density: 2,112 houses/condos per square mile
Median price asked for vacant for-sale houses and condos in 2022: $804,338.
Median contract rent in 2022: $1,808 (lower quartile is $1,228, upper quartile is over $2,000)
Median rent asked for vacant for-rent units in 2022: $48,424
Median gross rent in Huntington Station, NY in 2022: $1,975
Housing units in Huntington Station with a mortgage: 5,418 (615 second mortgage, 78 home equity loan, 483 both second mortgage and home equity loan)
Houses without a mortgage: 179
Median household income for houses/condos with a mortgage: $147,858
Median household income for apartments without a mortgage: $103,060
Median monthly housing costs: $2,251
Compare current foreclosures in Huntington Station, NY:
| Photo | Address | Area | Beds / Baths | Price | Details |
|---|---|---|---|---|---|

|
#1
6th Ave Apt A
Huntington Station, NY 11746
|
3,300 sq. feet
|
4 baths 7 beds |
$999,900
|
show details |

|
#2
11th Ave
Huntington Station, NY 11746
|
- sq. feet
|
2 baths 4 beds |
$399,000
|
show details |

|
#3
E 21st St
Huntington Station, NY 11746
|
- sq. feet
|
1 baths 3 beds |
$384,500
|
show details |

|
#4
Stratford Ave
Huntington Station, NY 11746
|
3,000 sq. feet
|
4 baths 4 beds |
show details | |

|
#5
Oak Ave
Huntington Station, NY 11746
|
2,294 sq. feet
|
3 baths 4 beds |
show details | |

|
#6
Lenox Rd
Huntington Station, NY 11746
|
1,250 sq. feet
|
1 baths 3 beds |
show details | |

|
#7
Herter Pl
Huntington Station, NY 11746
|
- sq. feet
|
2 baths 5 beds |
show details | |

|
#8
Shoreham Dr E
Huntington Station, NY 11746
|
- sq. feet
|
3 baths 4 beds |
show details | |

|
#9
Candlewood Path
Huntington Station, NY 11746
|
- sq. feet
|
3 baths 4 beds |
show details | |

|
#10
Indian Hill Ct
Huntington Station, NY 11746
|
- sq. feet
|
4 baths 6 beds |
show details |
| Photo | Address | Area | Beds / Baths | Price | Details |
|---|---|---|---|---|---|

|
#11
Alpine Way
Huntington Station, NY 11746
|
- sq. feet
|
- baths - beds |
show details | |

|
#12
Beverly Rd
Huntington Station, NY 11746
|
- sq. feet
|
- baths - beds |
show details | |

|
#13
N Test Garden
Huntington Station, NY 11750
|
- sq. feet
|
- baths - beds |
show details | |

|
#14
10th Ave
Huntington Station, NY 11746
|
- sq. feet
|
- baths - beds |
show details | |

|
#15
New York Ave
Huntington Station, NY 11746
|
- sq. feet
|
- baths - beds |
show details | |

|
#16
Half Hollow Rd
Huntington Station, NY 11746
|
- sq. feet
|
- baths - beds |
show details | |

|
#17
Buttonwood Dr
Huntington Station, NY 11746
|
- sq. feet
|
- baths - beds |
show details | |

|
#18
Mcculloch Dr
Huntington Station, NY 11746
|
- sq. feet
|
- baths - beds |
show details | |

|
#19
Miller Pl
Huntington Station, NY 11746
|
- sq. feet
|
- baths - beds |
show details | |

|
#20
Arcadia Dr
Huntington Station, NY 11746
|
- sq. feet
|
- baths - beds |
show details |
| Photo | Address | Area | Beds / Baths | Price | Details |
|---|---|---|---|---|---|

|
#21
E 3rd St
Huntington Station, NY 11746
|
- sq. feet
|
- baths - beds |
show details | |

|
#22
Mcculloch Dr
Huntington Station, NY 11746
|
- sq. feet
|
- baths - beds |
show details | |

|
#23
Cedar Ridge Ln
Huntington Station, NY 11746
|
- sq. feet
|
- baths - beds |
show details | |

|
#24
W Hills Rd
Huntington Station, NY 11746
|
- sq. feet
|
- baths - beds |
show details | |

|
#25
Vondran St
Huntington Station, NY 11746
|
- sq. feet
|
- baths - beds |
show details | |

|
#26
Howe St
Huntington Station, NY 11746
|
- sq. feet
|
- baths - beds |
show details | |

|
#27
Forge Ln
Huntington Station, NY 11746
|
- sq. feet
|
- baths - beds |
show details | |

|
#28
Ogden Ct
Huntington Station, NY 11746
|
- sq. feet
|
- baths - beds |
show details | |

|
#29
Lenox Rd
Huntington Station, NY 11746
|
- sq. feet
|
- baths - beds |
show details | |

|
#30
Chablis Dr
Huntington Station, NY 11746
|
- sq. feet
|
- baths - beds |
show details |
| Photo | Address | Area | Beds / Baths | Price | Details |
|---|---|---|---|---|---|

|
#31
Alpine Way
Huntington Station, NY 11746
|
- sq. feet
|
- baths - beds |
show details | |

|
#32
New York Ave
Huntington Station, NY 11746
|
- sq. feet
|
- baths - beds |
show details | |

|
#33
Hemingway Dr
Huntington Station, NY 11746
|
- sq. feet
|
- baths - beds |
show details | |

|
#34
Stevens Pl
Huntington Station, NY 11746
|
- sq. feet
|
- baths - beds |
show details | |

|
#35
E 23rd St
Huntington Station, NY 11746
|
- sq. feet
|
- baths - beds |
show details | |

|
#36
Lieper St
Huntington Station, NY 11746
|
- sq. feet
|
- baths - beds |
show details | |

|
#37
Herter Pl
Huntington Station, NY 11746
|
- sq. feet
|
- baths - beds |
show details | |

|
#38
Yardley Dr
Huntington Station, NY 11746
|
- sq. feet
|
- baths - beds |
show details | |

|
#39
Oak Ave
Huntington Station, NY 11746
|
- sq. feet
|
- baths - beds |
show details | |

|
#40
Old Country Rd
Huntington Station, NY 11746
|
- sq. feet
|
- baths - beds |
show details |
| Photo | Address | Area | Beds / Baths | Price | Details |
|---|---|---|---|---|---|

|
#41
Village Hill Dr
Huntington Station, NY 11746
|
- sq. feet
|
- baths - beds |
show details | |

|
#42
E Half Hollow Rd
Huntington Station, NY 11746
|
- sq. feet
|
- baths - beds |
show details | |

|
#43
Leyden St
Huntington Station, NY 11746
|
- sq. feet
|
- baths - beds |
show details | |

|
#44
E 25th St
Huntington Station, NY 11746
|
- sq. feet
|
- baths - beds |
show details | |

|
#45
Kenmore St
Huntington Station, NY 11746
|
- sq. feet
|
- baths - beds |
show details | |

|
#46
Railroad St
Huntington Station, NY 11746
|
- sq. feet
|
- baths - beds |
show details | |

|
#47
Ruby Ln
Huntington Station, NY 11746
|
- sq. feet
|
- baths - beds |
show details | |

|
#48
Iceland Dr
Huntington Station, NY 11746
|
- sq. feet
|
- baths - beds |
show details | |

|
#49
Caldwell St
Huntington Station, NY 11746
|
- sq. feet
|
- baths - beds |
show details | |

|
Check over 1 million property listings on Foreclosure.com!
|
browse all offers | |||


 | Apartments rentals along LIRR (Farmingdale, Wyandanch, Huntington) (4 replies) |
| Furnished apartment to rent in Long Island , no kids (20 replies) |
| Bad areas of Huntington Station? (20 replies) |
| Searching for homes in LI (51 replies) |
| Huntington Station (10 replies) |
| First time buyer in Huntington, advice please! (54 replies) |

Median year apartment built: 1968
Household type by relationship:
Households: 34,610- Male householders: 4,877 (773 living alone), Female householders: 6,140 (1,404 living alone)
6,245 spouses (6,191 opposite-sex spouses), 709 unmarried partners, (690 opposite-sex unmarried partners), 10,724 children (10,322 natural, 103 adopted, 299 stepchildren), 823 grandchildren, 674 brothers or sisters, 884 parents, 0 foster children, 871 other relatives, 2,440 non-relatives
- In group quarters: 218
Size of family households: 2,731 2-persons, 2,096 3-persons, 1,433 4-persons, 947 5-persons, 344 6-persons, 516 7-or-more-persons.
Size of nonfamily households: 2,195 1-person, 591 2-persons, 95 3-persons, 14 4-persons, 11 5-persons.
4,492 married couples with children.
1,419 single-parent households (232 men, 1,187 women).
58.9% of residents of Huntington Station speak English at home.
30.4% of residents speak Spanish at home (58% speak English very well, 14% speak English well, 21% speak English not well, 7% don't speak English at all).
7.8% of residents speak other Indo-European language at home (64% speak English very well, 22% speak English well, 13% speak English not well, 1% don't speak English at all).
2.1% of residents speak Asian or Pacific Island language at home (40% speak English very well, 15% speak English well, 40% speak English not well, 4% don't speak English at all).
0.9% of residents speak other language at home (84% speak English very well, 10% speak English well, 6% speak English not well).
Foreign born population: 9,733 (28.1%)
(46.0% of them are naturalized citizens)
| Here: | 6.6 |
| State: | 6.3 |
| Here: | 4.8 |
| State: | 3.8 |

- Bedrooms in owner-occupied houses and condos in Huntington Station, New York
- 45no bedroom
- 3061 bedroom
- 1,3402 bedrooms
- 3,8103 bedrooms
- 2,2704 bedrooms
- 7595+ bedrooms

- Bedrooms in renter-occupied apartments in Huntington Station, New York
- 56no bedroom
- 5191 bedroom
- 7402 bedrooms
- 7593 bedrooms
- 2694 bedrooms
- 1665+ bedrooms

- Cars and other vehicles available in Huntington Station in owner-occupied houses/condos
- 413no vehicle
- 2,2521 vehicle
- 3,5232 vehicles
- 1,4933 vehicles
- 4084 vehicles
- 4415+ vehicles

- Cars and other vehicles available in Huntington Station in renter-occupied apartments
- 512no vehicle
- 7201 vehicle
- 4462 vehicles
- 6863 vehicles
- 384 vehicles
- 1075+ vehicles

- Rooms in owner-occupied houses in Huntington Station, New York
- 451 room
- 112 rooms
- 603 rooms
- 6744 rooms
- 1,2915 rooms
- 1,8686 rooms
- 1,5727 rooms
- 1,3658 rooms
- 1,6439+ rooms

- Rooms in renter-occupied apartments in Huntington Station, New York
- 381 room
- 1462 rooms
- 3703 rooms
- 6214 rooms
- 3815 rooms
- 6146 rooms
- 957 rooms
- 668 rooms
- 1789+ rooms


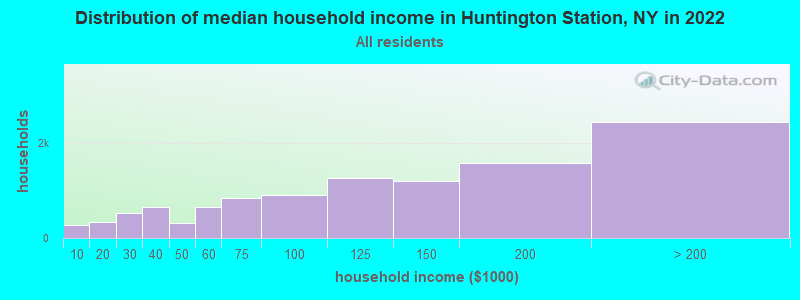
Huntington Station, NY household income distribution

- 265Less than $10,000
- 342$10,000 to $19,999
- 537$20,000 to $29,999
- 652$30,000 to $39,999
- 317$40,000 to $49,999
- 656$50,000 to $59,999
- 839$60,000 to $74,999
- 900$75,000 to $99,999
- 1,266$100,000 to $124,999
- 1,197$125,000 to $149,999
- 1,576$150,000 to $199,999
- 2,453$200,000 or more
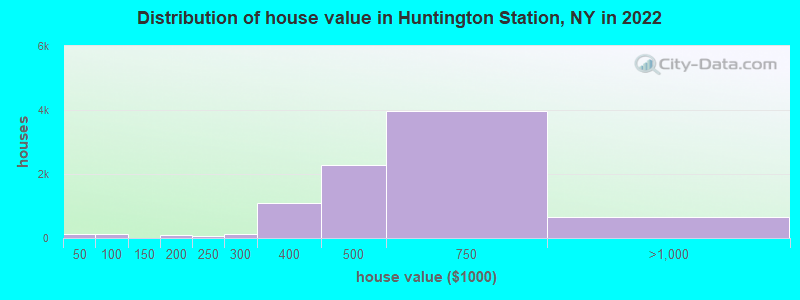
Home value of owner - occupied houses in 2022 in Huntington Station, NY
-
- 69Less than $10,000
- 25$30,000 to $34,999
- 24$40,000 to $49,999
- 50$50,000 to $59,999
- 13$60,000 to $69,999
- 16$70,000 to $79,999
- 4$90,000 to $99,999
- 30$150,000 to $174,999
- 62$175,000 to $199,999
- 73$200,000 to $249,999
- 135$250,000 to $299,999
- 1,087$300,000 to $399,999
- 2,283$400,000 to $499,999
- 3,978$500,000 to $749,999
- 660$750,000 to $999,999
- 10$1,000,000 to $1,499,999
Rent paid by renters in 2022 in Huntington Station, NY
-
- 16$100 to $149
- 18$150 to $199
- 20$250 to $299
- 15$550 to $599
- 20$650 to $699
- 41$700 to $749
- 74$800 to $899
- 39$900 to $999
- 252$1,000 to $1,249
- 347$1,250 to $1,499
- 350$1,500 to $1,999
- 340$2,000 to $2,499
- 189$2,500 to $2,999
- 127$3,000 to $3,499
- 247$3,500 or more
- 390No cash rent


Percentage of workers working in this county: 70.9%
Number of people working at home: 2,357 (12.7% of all workers)
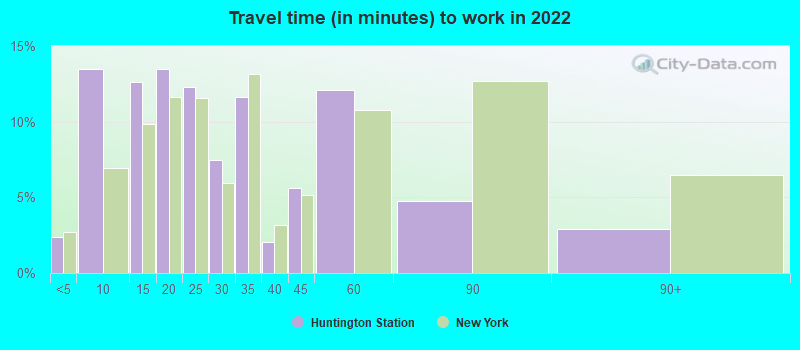
Travel time to work (commute)
- Less than 5 minutes: 608
- 5 to 9 minutes: 1,624
- 10 to 14 minutes: 1,589
- 15 to 19 minutes: 1,885
- 20 to 24 minutes: 1,697
- 25 to 29 minutes: 1,308
- 30 to 34 minutes: 1,806
- 35 to 39 minutes: 454
- 40 to 44 minutes: 757
- 45 to 59 minutes: 1,623
- 60 to 89 minutes: 1,395
- 90 or more minutes: 1,453
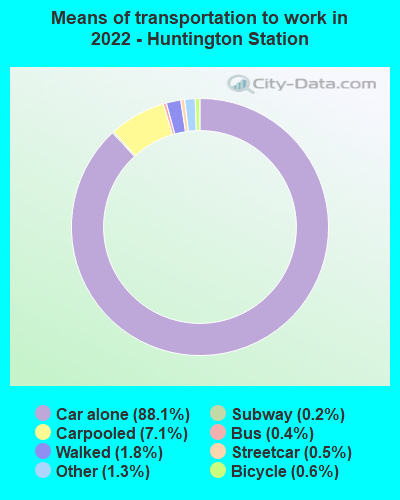
Means of transportation to work:
- Drove a car alone: 6,585 (68.0%)
- Carpooled: 611 (6.3%)
- Bus: 27 (0.3%)
- Subway or elevated rail: 40 (0.4%)
- Long-distance train or commuter rail: 15 (0.2%)
- Taxi: 119 (1.2%)
- Bicycle: 34 (0.4%)
- Walked: 140 (1.4%)
- Worked at home: 2,357 (24.3%)

- Unemployment by race in 2022
- Unemployment rate for White non-Hispanic residents
- 1.7%Males
- 2.7%Females
- Unemployment rate for Black residents
- 4.4%Males
- 10.9%Females
- Unemployment rate for Asian residents
- 0.7%Males
- 4.2%Females
- Unemployment rate for other race residents
- 11.3%Males
- 3.3%Females
- Unemployment rate for two or more race residents
- 5.6%Males
- 10.5%Females
- Unemployment rate for Hispanic or Latino residents
- 4.8%Males
- 3.5%Females

- Year of entry for the foreign-born population in Huntington Station, New York
- 2,3232010 or later
- 3,0112000 to 2009
- 1,9781990 to 1999
- 1,9951980 to 1989
- 5271970 to 1979
- 740Before 1970
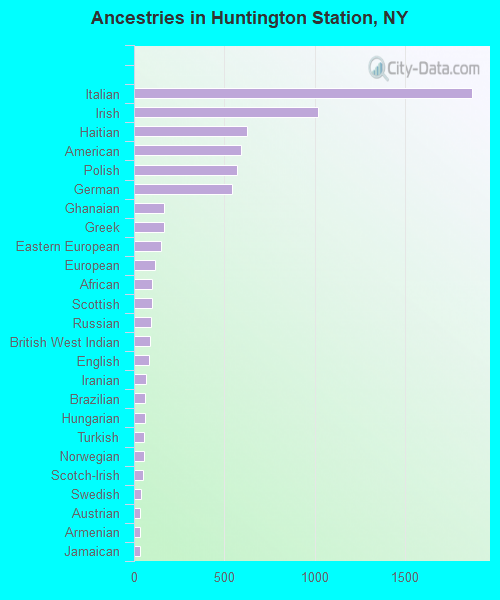
First ancestries reported:
- Italian: 1,873 (11.3%)
- Irish: 1,020 (6.1%)
- Haitian: 626 (3.8%)
- American: 593 (3.6%)
- Polish: 570 (3.4%)
- German: 544 (3.3%)
- Ghanaian: 168 (1.0%)
- Greek: 168 (1.0%)
- Eastern European: 152 (0.9%)
- European: 114 (0.7%)
- African: 99 (0.6%)
- Scottish: 99 (0.6%)
- Russian: 96 (0.6%)
- British West Indian: 88 (0.5%)
- English: 85 (0.5%)
- Iranian: 64 (0.4%)
- Brazilian: 61 (0.4%)
- Hungarian: 61 (0.4%)
- Turkish: 56 (0.3%)
- Norwegian: 54 (0.3%)
- Scotch-Irish: 48 (0.3%)
- Swedish: 39 (0.2%)
- Austrian: 36 (0.2%)
- Armenian: 34 (0.2%)
- Jamaican: 31 (0.2%)
- West Indian: 26 (0.2%)
- Scandinavian: 25 (0.2%)
- Swiss: 18 (0.1%)
- Portuguese: 13 (0.08%)
- Ukrainian: 13 (0.08%)
- Dutch: 12 (0.07%)
- Albanian: 12 (0.07%)
- French Canadian: 9 (0.05%)
- Trinidadian and Tobagonian: 9 (0.05%)
- French: 8 (0.05%)
- British: 7 (0.04%)
- Northern European: 6 (0.04%)
- Welsh: 6 (0.04%)
- Danish: 5 (0.03%)
- Romanian: 5 (0.03%)
Most common places of birth for foreign-born residents (%):
| Huntington Station: | 30.7% (2,758) |
| New York: | 2.4% (108,067) |
| Huntington Station: | 8.0% (714) |
| New York: | 11.1% (501,040) |
| Huntington Station: | 7.5% (676) |
| New York: | 4.8% (214,559) |
| Huntington Station: | 5.9% (527) |
| New York: | 1.4% (61,245) |
| Huntington Station: | 5.5% (493) |
| New York: | 2.8% (126,936) |
| Huntington Station: | 4.2% (381) |
| New York: | 2.5% (111,920) |
| Huntington Station: | 3.0% (270) |
| New York: | 1.4% (65,102) |
| Huntington Station: | 2.7% (242) |
| New York: | 1.8% (81,374) |
| Huntington Station: | 2.5% (227) |
| New York: | 1.2% (54,759) |
| Huntington Station: | 2.0% (184) |
| New York: | 1.2% (55,571) |
| Huntington Station: | 1.9% (169) |
| New York: | 3.9% (177,448) |
| Huntington Station: | 1.7% (157) |
| New York: | 1.8% (82,786) |
| Huntington Station: | 1.7% (157) |
| New York: | 0.2% (9,597) |
| Huntington Station: | 1.7% (155) |
| New York: | 9.1% (410,910) |
Place of birth for U.S.-born residents:
- This state: 22,203
- Other state: 2,375
- Northeast: 745
- Midwest: 328
- South: 710
- West: 619
92.5% of Huntington Station residents lived in the same house 1 years ago.
Out of people who lived in different houses, 31.1% lived in this county.
Out of people who lived in different counties, 83.6% lived in New York.
| Huntington Station: | 92.5% |
| State average: | 89.6% |
Education attainment for males 25 years and older:
- No schooling: 1,041
- Nursery to 4th grade: 308
- 5th and 6th grade: 191
- 7th and 8th grade: 173
- 9th grade: 33
- 10th grade: 133
- 11th grade: 357
- 12th grade, no diploma: 297
- High school graduate (or equivalency): 2,627
- Less than 1 year of college: 790
- Some college more than 1 year, no degree: 847
- Associate degree: 828
- Bachelor's degree: 2,906
- Master's degree: 1,221
- Professional school degree: 301
- Doctorate degree: 189

Education attainment for females 25 years and older:
- No schooling: 543
- Nursery to 4th grade: 131
- 5th and 6th grade: 106
- 7th and 8th grade: 279
- 9th grade: 220
- 10th grade: 15
- 11th grade: 102
- 12th grade, no diploma: 181
- High school graduate (or equivalency): 2,831
- Less than 1 year of college: 733
- Some college more than 1 year, no degree: 1,097
- Associate degree: 983
- Bachelor's degree: 2,881
- Master's degree: 1,478
- Professional school degree: 438
- Doctorate degree: 250


Housing units in structures:
- One, detached: 8,472
- One, attached: 1,036
- Two: 825
- 3 or 4: 188
- 5 to 9: 394
- 10 to 19: 175
- 20 to 49: 96
- 50 or more: 199
- Mobile homes: 85
Housing units lacking complete kitchen facilities in 2022: 0.6%
House/condo owner moved in on average 15 years ago
Renter moved in on average 6 years ago

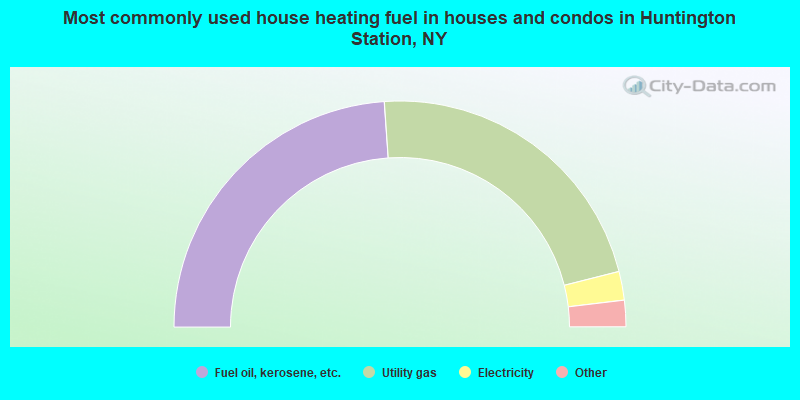
- 47.8%Fuel oil, kerosene, etc.
- 44.3%Utility gas
- 4.1%Electricity
- 2.4%Bottled, tank, or LP gas
- 0.8%No fuel used
- 0.3%Coal or coke
- 0.2%Solar energy
- 0.1%Other fuel
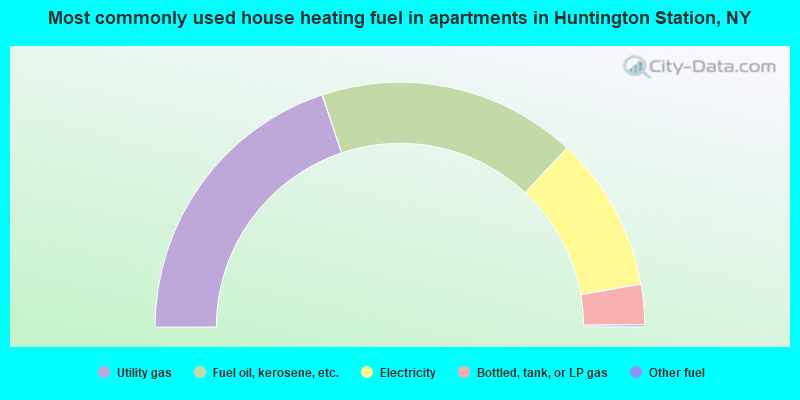
- 39.7%Utility gas
- 34.2%Fuel oil, kerosene, etc.
- 20.5%Electricity
- 5.3%Bottled, tank, or LP gas
- 0.3%Other fuel
Private vs. public school enrollment:
| Here: | 8.8% |
| New York: | 15.6% |
| Here: | 9.9% |
| New York: | 15.0% |
| Here: | 26.8% |
| New York: | 39.2% |


