Holly Springs, NC (North Carolina) Houses and Residents
| Holly Springs: | $548,216 |
| North Carolina: | $280,600 |
Mean price in 2022:
Detached houses: $459,091
Here: $459,091 State: $375,326 Townhouses or other attached units: $295,761
Here: $295,761 State: $317,935 Mobile homes: $471,687
Here: $471,687 State: $124,933
Total population: 30,157 (Urban population: 7,917, Rural population: 1,258 (all nonfarm))
Houses: 15,178 (14,366 occupied: 11,567 owner occupied, 2,501 renter occupied)
| % of renters here: | 18% |
| State: | 33% |
Housing density: 2,027 houses/condos per square mile
Median price asked for vacant for-sale houses and condos in 2022: $298,600.
Median contract rent in 2022: $1,649 (lower quartile is $1,325, upper quartile is over $2,000)
Median rent asked for vacant for-rent units in 2022: $2,739
Median gross rent in Holly Springs, NC in 2022: $1,804
Housing units in Holly Springs with a mortgage: 9,426 (850 second mortgage, 26 home equity loan, 761 both second mortgage and home equity loan)
Houses without a mortgage: 41
Median household income for houses/condos with a mortgage: $143,586
Median household income for apartments without a mortgage: $118,220
Median monthly housing costs: $1,964
Compare current foreclosures in Holly Springs, NC:
| Photo | Address | Area | Beds / Baths | Price | Details |
|---|---|---|---|---|---|

|
#1
Texanna Way
Holly Springs, NC 27540
|
2,348 sq. feet
|
2 baths - beds |
show details | |

|
#2
Horncliffe Way
Holly Springs, NC 27540
|
2,566 sq. feet
|
3 baths - beds |
show details | |

|
#3
Avent Cir
Holly Springs, NC 27540
|
1,412 sq. feet
|
2 baths - beds |
show details | |

|
#4
Braxcarr St
Holly Springs, NC 27540
|
1,820 sq. feet
|
2 baths - beds |
show details | |

|
#5
E Maple Ave
Holly Springs, NC 27540
|
1,291 sq. feet
|
2 baths - beds |
show details | |

|
#6
Springside Dr
Holly Springs, NC 27540
|
1,244 sq. feet
|
2 baths - beds |
show details | |

|
#7
Avent Ferry Rd
Holly Springs, NC 27540
|
1,575 sq. feet
|
2 baths - beds |
show details | |

|
#8
Cottonwood Ln
Holly Springs, NC 27540
|
1,748 sq. feet
|
2 baths - beds |
show details | |

|
#9
Pyracantha Dr
Holly Springs, NC 27540
|
2,614 sq. feet
|
3 baths - beds |
show details | |

|
#10
Earp St
Holly Springs, NC 27540
|
1,080 sq. feet
|
2 baths - beds |
show details |
| Photo | Address | Area | Beds / Baths | Price | Details |
|---|---|---|---|---|---|

|
#11
Palmdale Ct
Holly Springs, NC 27540
|
1,793 sq. feet
|
2 baths - beds |
show details | |

|
#12
Aldeburgh Ct
Holly Springs, NC 27540
|
2,222 sq. feet
|
2 baths - beds |
show details | |

|
#13
Pyracantha Dr
Holly Springs, NC 27540
|
2,784 sq. feet
|
2 baths - beds |
show details | |

|
#14
Penmore Ct
Holly Springs, NC 27540
|
5,414 sq. feet
|
3 baths - beds |
show details | |

|
#15
Chrismill Ln
Holly Springs, NC 27540
|
2,593 sq. feet
|
3 baths - beds |
show details | |

|
#16
Rivendell Dr
Holly Springs, NC 27540
|
3,200 sq. feet
|
2 baths - beds |
show details | |

|
#17
Occidental Dr
Holly Springs, NC 27540
|
- sq. feet
|
- baths - beds |
show details | |

|
#18
Ressler St
Holly Springs, NC 27540
|
- sq. feet
|
- baths - beds |
show details | |

|
#19
Kentworth Dr
Holly Springs, NC 27540
|
- sq. feet
|
- baths - beds |
show details | |

|
#20
Broomstraw Dr
Holly Springs, NC 27540
|
- sq. feet
|
- baths - beds |
show details |
| Photo | Address | Area | Beds / Baths | Price | Details |
|---|---|---|---|---|---|

|
#21
Sweet Almond Dr, Apt 2102
Holly Springs, NC 27540
|
- sq. feet
|
- baths - beds |
show details | |

|
#22
Raccoon Path
Holly Springs, NC 27540
|
- sq. feet
|
- baths - beds |
show details | |

|
#23
Sweet Almond Dr
Holly Springs, NC 27540
|
- sq. feet
|
- baths - beds |
show details | |

|
#24
Lumina Pl
Holly Springs, NC 27540
|
- sq. feet
|
- baths - beds |
show details | |

|
#25
Morgan Ridge Rd
Holly Springs, NC 27540
|
- sq. feet
|
- baths - beds |
show details | |

|
#26
Timber Springs Ct
Holly Springs, NC 27540
|
- sq. feet
|
- baths - beds |
show details | |

|
#27
Asher Exchange Dr
Holly Springs, NC 27540
|
- sq. feet
|
- baths - beds |
show details | |

|
#28
Forest Village Dr
Holly Springs, NC 27540
|
- sq. feet
|
- baths - beds |
show details | |

|
#29
Forest Village Dr
Holly Springs, NC 27540
|
- sq. feet
|
- baths - beds |
show details | |

|
Check over 1 million property listings on Foreclosure.com!
|
browse all offers | |||


 | Apartment Rental - Holly Springs - Holly Grove Zone (4 replies) |
| Apartments in Holly Springs w/o dog breed restrictions? (0 replies) |
| Holly Springs - Beazer Homes (29 replies) |
| Home Schooler Mom searching to transfer child to Holly Springs High? (5 replies) |
| fuquay-varina vs Holly Springs 20201 (34 replies) |
| Holly Springs/Apex short term rental and YR school (5 replies) |

Median year apartment built: 2013
Household type by relationship:
Households: 43,616- Male householders: 7,163 (746 living alone), Female householders: 6,947 (1,304 living alone)
10,033 spouses (10,010 opposite-sex spouses), 843 unmarried partners, (843 opposite-sex unmarried partners), 16,966 children (16,064 natural, 423 adopted, 478 stepchildren), 156 grandchildren, 200 brothers or sisters, 417 parents, 0 foster children, 321 other relatives, 522 non-relatives
- In group quarters: 42
Size of family households: 3,546 2-persons, 2,788 3-persons, 3,414 4-persons, 1,084 5-persons, 640 6-persons, 134 7-or-more-persons.
Size of nonfamily households: 2,070 1-person, 319 2-persons, 36 3-persons, 5 4-persons.
11,736 married couples with children.
2,168 single-parent households (966 men, 1,202 women).
85.4% of residents of Holly Springs speak English at home.
3.6% of residents speak Spanish at home (70% speak English very well, 19% speak English well, 11% speak English not well).
6.1% of residents speak other Indo-European language at home (88% speak English very well, 9% speak English well, 3% speak English not well).
3.3% of residents speak Asian or Pacific Island language at home (85% speak English very well, 12% speak English well, 4% speak English not well).
0.9% of residents speak other language at home (68% speak English very well, 18% speak English well, 12% speak English not well, 3% don't speak English at all).
Foreign born population: 4,555 (10.4%)
(56.8% of them are naturalized citizens)
| Here: | 7.9 |
| State: | 6.4 |
| Here: | 5.3 |
| State: | 4.4 |

- Bedrooms in owner-occupied houses and condos in Holly Springs, North Carolina
- 21no bedroom
- 401 bedroom
- 2842 bedrooms
- 4,1253 bedrooms
- 4,8584 bedrooms
- 2,2405+ bedrooms

- Bedrooms in renter-occupied apartments in Holly Springs, North Carolina
- 59no bedroom
- 3791 bedroom
- 6302 bedrooms
- 7783 bedrooms
- 5184 bedrooms
- 1375+ bedrooms

- Cars and other vehicles available in Holly Springs in owner-occupied houses/condos
- 28no vehicle
- 1,8771 vehicle
- 6,4662 vehicles
- 2,4443 vehicles
- 6224 vehicles
- 1305+ vehicles

- Cars and other vehicles available in Holly Springs in renter-occupied apartments
- 122no vehicle
- 1,1821 vehicle
- 9452 vehicles
- 2373 vehicles
- 164 vehicles
- 05+ vehicles

- Rooms in owner-occupied houses in Holly Springs, North Carolina
- 211 room
- 02 rooms
- 583 rooms
- 4654 rooms
- 1,4705 rooms
- 1,3046 rooms
- 1,5217 rooms
- 2,6018 rooms
- 4,1289+ rooms

- Rooms in renter-occupied apartments in Holly Springs, North Carolina
- 321 room
- 1002 rooms
- 3083 rooms
- 4034 rooms
- 4955 rooms
- 3376 rooms
- 3287 rooms
- 1878 rooms
- 3109+ rooms


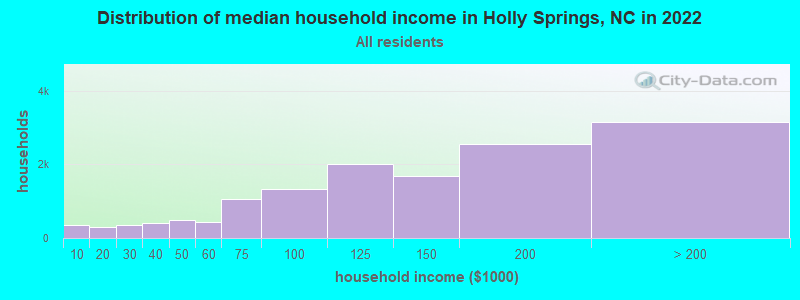
Holly Springs, NC household income distribution

- 343Less than $10,000
- 312$10,000 to $19,999
- 359$20,000 to $29,999
- 395$30,000 to $39,999
- 488$40,000 to $49,999
- 422$50,000 to $59,999
- 1,051$60,000 to $74,999
- 1,322$75,000 to $99,999
- 2,014$100,000 to $124,999
- 1,682$125,000 to $149,999
- 2,565$150,000 to $199,999
- 3,150$200,000 or more
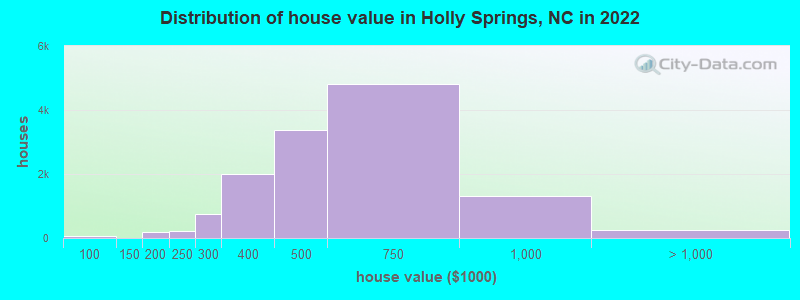
Home value of owner - occupied houses in 2022 in Holly Springs, NC
-
- 16Less than $10,000
- 5$15,000 to $19,999
- 12$40,000 to $49,999
- 11$60,000 to $69,999
- 7$80,000 to $89,999
- 27$90,000 to $99,999
- 91$150,000 to $174,999
- 83$175,000 to $199,999
- 223$200,000 to $249,999
- 754$250,000 to $299,999
- 1,989$300,000 to $399,999
- 3,363$400,000 to $499,999
- 4,803$500,000 to $749,999
- 1,318$750,000 to $999,999
- 201$1,000,000 to $1,499,999
- 46$1,500,000 to $1,999,999
Rent paid by renters in 2022 in Holly Springs, NC
-
- 35$100 to $149
- 30$150 to $199
- 9$250 to $299
- 33$300 to $349
- 43$450 to $499
- 15$500 to $549
- 14$550 to $599
- 21$650 to $699
- 11$700 to $749
- 29$750 to $799
- 39$800 to $899
- 48$900 to $999
- 167$1,000 to $1,249
- 539$1,250 to $1,499
- 1,035$1,500 to $1,999
- 459$2,000 to $2,499
- 86$2,500 to $2,999
- 26$3,000 to $3,499
- 67No cash rent


Percentage of workers working in this county: 90.1%
Number of people working at home: 6,697 (30.6% of all workers)
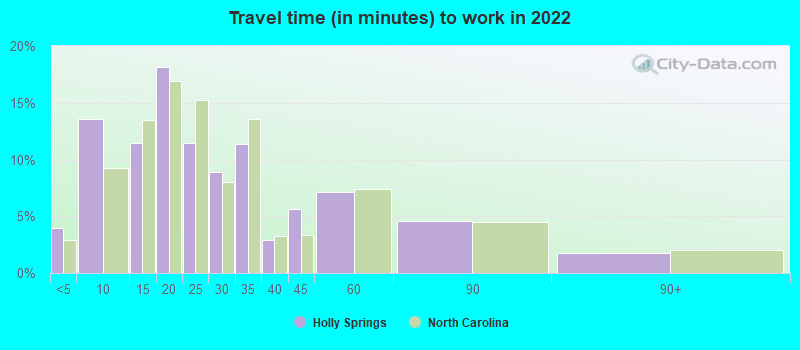
Travel time to work (commute)
- Less than 5 minutes: 418
- 5 to 9 minutes: 1,374
- 10 to 14 minutes: 1,240
- 15 to 19 minutes: 1,347
- 20 to 24 minutes: 1,941
- 25 to 29 minutes: 1,851
- 30 to 34 minutes: 3,155
- 35 to 39 minutes: 985
- 40 to 44 minutes: 822
- 45 to 59 minutes: 1,292
- 60 to 89 minutes: 657
- 90 or more minutes: 131
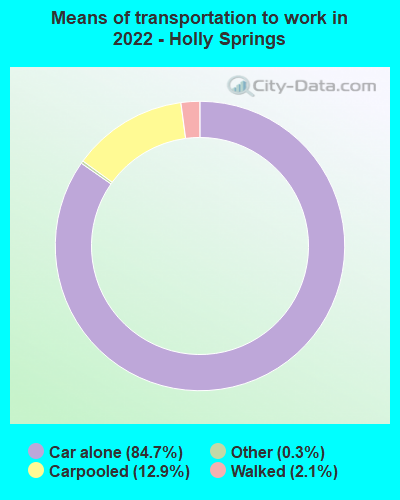
Means of transportation to work:
- Drove a car alone: 7,944 (51.2%)
- Carpooled: 1,288 (8.3%)
- Taxi: 43 (0.3%)
- Walked: 271 (1.7%)
- Worked at home: 6,697 (43.2%)

- Unemployment by race in 2022
- Unemployment rate for White non-Hispanic residents
- 1.5%Males
- 1.5%Females
- Unemployment rate for Black residents
- 3.7%Males
- 5.8%Females
- Unemployment rate for Asian residents
- 2.7%Males
- 1.0%Females
- Unemployment rate for other race residents
- 2.9%Males
- 23.8%Females
- Unemployment rate for two or more race residents
- 3.4%Males
- 8.0%Females
- Unemployment rate for Hispanic or Latino residents
- 2.3%Males
- 14.2%Females

- Year of entry for the foreign-born population in Holly Springs, North Carolina
- 1,4522010 or later
- 8642000 to 2009
- 1,0841990 to 1999
- 1181980 to 1989
- 511970 to 1979
- 55Before 1970

First ancestries reported:
- English: 3,067 (15.2%)
- German: 1,871 (9.3%)
- Irish: 1,611 (8.0%)
- Italian: 1,544 (7.6%)
- American: 1,073 (5.3%)
- European: 832 (4.1%)
- Polish: 433 (2.1%)
- Scottish: 280 (1.4%)
- Scotch-Irish: 211 (1.0%)
- Russian: 198 (1.0%)
- Swiss: 141 (0.7%)
- Ethiopian: 120 (0.6%)
- Greek: 107 (0.5%)
- Moroccan: 91 (0.5%)
- Dutch: 91 (0.5%)
- Norwegian: 87 (0.4%)
- Portuguese: 85 (0.4%)
- French Canadian: 81 (0.4%)
- British: 64 (0.3%)
- Scandinavian: 64 (0.3%)
- Slovene: 63 (0.3%)
- Ukrainian: 61 (0.3%)
- Romanian: 59 (0.3%)
- African: 58 (0.3%)
- French: 57 (0.3%)
- Welsh: 57 (0.3%)
- Cajun: 55 (0.3%)
- Turkish: 53 (0.3%)
- Slovak: 51 (0.3%)
- Slavic: 49 (0.2%)
- Jamaican: 48 (0.2%)
- Canadian: 47 (0.2%)
- Swedish: 45 (0.2%)
- Austrian: 41 (0.2%)
- South African: 38 (0.2%)
- Serbian: 35 (0.2%)
- Eastern European: 31 (0.2%)
- Iranian: 25 (0.1%)
- Egyptian: 24 (0.1%)
- Palestinian: 21 (0.1%)
- Hungarian: 21 (0.1%)
- Macedonian: 20 (0.10%)
- Armenian: 19 (0.09%)
- Brazilian: 16 (0.08%)
- Danish: 13 (0.06%)
- Czechoslovakian: 13 (0.06%)
- Czech: 9 (0.04%)
- Lithuanian: 8 (0.04%)
- Icelander: 8 (0.04%)
Most common places of birth for foreign-born residents (%):
| Holly Springs: | 27.9% (1,210) |
| North Carolina: | 9.3% (80,594) |
| Holly Springs: | 11.8% (511) |
| North Carolina: | 1.8% (15,988) |
| Holly Springs: | 8.6% (374) |
| North Carolina: | 24.7% (214,776) |
| Holly Springs: | 4.0% (174) |
| North Carolina: | 0.9% (8,067) |
| Holly Springs: | 3.9% (170) |
| North Carolina: | 1.1% (9,831) |
| Holly Springs: | 3.5% (153) |
| North Carolina: | 2.1% (18,275) |
| Holly Springs: | 3.0% (131) |
| North Carolina: | 0.8% (6,645) |
| Holly Springs: | 2.3% (100) |
| North Carolina: | 2.1% (18,105) |
| Holly Springs: | 2.3% (99) |
| North Carolina: | 0.3% (2,820) |
| Holly Springs: | 1.8% (80) |
| North Carolina: | 0.5% (4,296) |
| Holly Springs: | 1.7% (74) |
| North Carolina: | 0.6% (4,847) |
| Holly Springs: | 1.6% (71) |
| North Carolina: | 2.9% (24,965) |
| Holly Springs: | 1.6% (69) |
| North Carolina: | 0.2% (1,868) |
| Holly Springs: | 1.6% (68) |
| North Carolina: | 1.3% (11,419) |
Place of birth for U.S.-born residents:
- This state: 15,115
- Other state: 23,502
- Northeast: 8,067
- Midwest: 5,197
- South: 7,772
- West: 2,432
90.2% of Holly Springs residents lived in the same house 1 years ago.
Out of people who lived in different houses, 35.9% lived in this county.
Out of people who lived in different counties, 46.8% lived in North Carolina.
| Holly Springs: | 90.2% |
| State average: | 87.3% |
Education attainment for males 25 years and older:
- No schooling: 193
- Nursery to 4th grade: 18
- 5th and 6th grade: 9
- 7th and 8th grade: 2
- 9th grade: 53
- 10th grade: 114
- 11th grade: 13
- 12th grade, no diploma: 52
- High school graduate (or equivalency): 1,243
- Less than 1 year of college: 348
- Some college more than 1 year, no degree: 1,527
- Associate degree: 888
- Bachelor's degree: 5,830
- Master's degree: 2,177
- Professional school degree: 371
- Doctorate degree: 337

Education attainment for females 25 years and older:
- No schooling: 127
- Nursery to 4th grade: 0
- 5th and 6th grade: 59
- 7th and 8th grade: 39
- 9th grade: 37
- 10th grade: 55
- 11th grade: 30
- 12th grade, no diploma: 429
- High school graduate (or equivalency): 1,276
- Less than 1 year of college: 414
- Some college more than 1 year, no degree: 1,092
- Associate degree: 1,511
- Bachelor's degree: 5,170
- Master's degree: 3,007
- Professional school degree: 571
- Doctorate degree: 189


Housing units in structures:
- One, detached: 12,107
- One, attached: 1,543
- 3 or 4: 43
- 5 to 9: 231
- 10 to 19: 558
- 20 to 49: 450
- 50 or more: 139
- Mobile homes: 103
Median worth of mobile homes: $574,080
House/condo owner moved in on average 6 years ago
Renter moved in on average 3 years ago

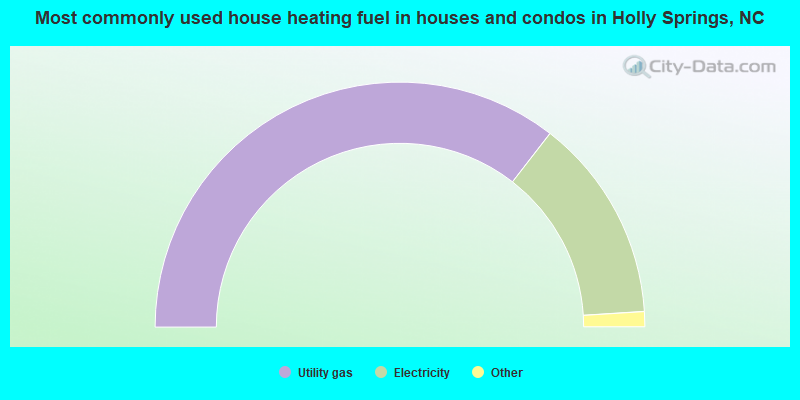
- 71.0%Utility gas
- 27.0%Electricity
- 1.0%Fuel oil, kerosene, etc.
- 0.6%Bottled, tank, or LP gas
- 0.2%Solar energy
- 0.2%No fuel used
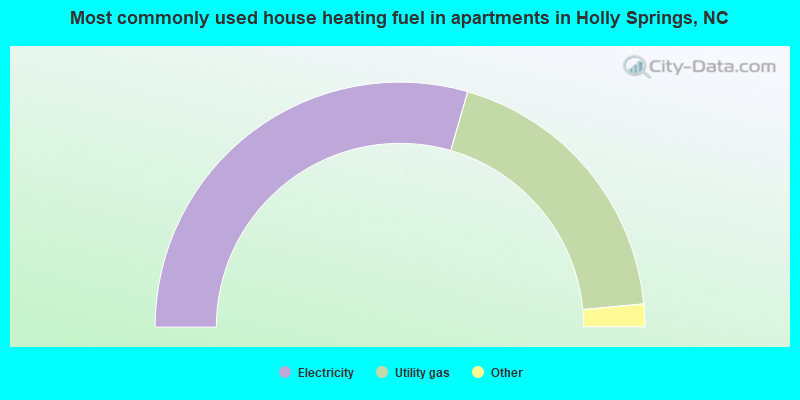
- 59.0%Electricity
- 38.1%Utility gas
- 1.7%Bottled, tank, or LP gas
- 0.7%No fuel used
- 0.5%Fuel oil, kerosene, etc.
Private vs. public school enrollment:
| Here: | 4.8% |
| North Carolina: | 13.8% |
| Here: | 6.3% |
| North Carolina: | 11.9% |
| Here: | 6.4% |
| North Carolina: | 19.3% |


