Holly Springs, GA (Georgia) Houses and Residents
| Holly Springs: | $450,402 |
| Georgia: | $297,400 |
Mean price in 2022:
Detached houses: $391,597
Here: $391,597 State: $376,364 Townhouses or other attached units: $251,938
Here: $251,938 State: $341,709
Total population: 10,237 (Urban population: 3,080, Rural population: 0)
Houses: 6,673 (6,324 occupied: 4,871 owner occupied, 1,546 renter occupied)
| % of renters here: | 24% |
| State: | 34% |
Housing density: 2,106 houses/condos per square mile
Median price asked for vacant for-sale houses and condos in 2022: $411,911.
Median contract rent in 2022: $1,581 (lower quartile is $1,227, upper quartile is $1,918)
Median rent asked for vacant for-rent units in 2022: $1,390
Median gross rent in Holly Springs, GA in 2022: $1,705
Housing units in Holly Springs with a mortgage: 4,137 (59 second mortgage, 0 home equity loan, 57 both second mortgage and home equity loan)
Houses without a mortgage: 39
Median household income for houses/condos with a mortgage: $121,168
Median household income for apartments without a mortgage: $76,428
Median monthly housing costs: $1,853
Compare current foreclosures near Holly Springs, GA:
| Photo | Address | Area | Beds / Baths | Price | Details |
|---|---|---|---|---|---|

|
#1
Creekstone Way
Marietta, GA 30068
|
8,724 sq. feet
|
5 baths 5 beds |
$999,900
|
show details |

|
#2
4th St
Emerson, GA 30137
|
- sq. feet
|
1 baths 2 beds |
$55,000
|
show details |

|
#3
4th St
Emerson, GA 30137
|
- sq. feet
|
1 baths 2 beds |
$55,000
|
show details |

|
#4
Broughton Dr
Canton, GA 30114
|
1,830 sq. feet
|
3 baths 4 beds |
show details | |

|
#5
Masons Creek Cir
Atlanta, GA 30350
|
1,404 sq. feet
|
3 baths 3 beds |
show details | |

|
#6
Antler Rdg
Alpharetta, GA 30009
|
5,422 sq. feet
|
5 baths 4 beds |
show details | |

|
#7
Summer Ridge Ln NW
Kennesaw, GA 30152
|
- sq. feet
|
3 baths 5 beds |
show details | |

|
#8
Wedgewood Falls Dr
Canton, GA 30114
|
3,404 sq. feet
|
5 baths 5 beds |
show details | |

|
#9
Highway 411 NE
White, GA 30184
|
1,930 sq. feet
|
2 baths 3 beds |
show details | |

|
#10
Willow Run Rd
Roswell, GA 30075
|
3,752 sq. feet
|
3 baths 4 beds |
show details |
| Photo | Address | Area | Beds / Baths | Price | Details |
|---|---|---|---|---|---|

|
#11
Tramore Ct
Acworth, GA 30102
|
3,050 sq. feet
|
3 baths 5 beds |
show details | |

|
#12
Tanbark Dr NE
Marietta, GA 30066
|
2,252 sq. feet
|
2 baths 4 beds |
show details | |

|
#13
Santa Fe Pkwy
Atlanta, GA 30350
|
1,260 sq. feet
|
2 baths 3 beds |
show details | |

|
#14
Woodall Rd
Woodstock, GA 30188
|
2,454 sq. feet
|
2 baths 3 beds |
show details | |

|
#15
Woodall Dr
Woodstock, GA 30188
|
2,454 sq. feet
|
2 baths 3 beds |
show details | |

|
#16
Somerset Ct
Atlanta, GA 30350
|
3,238 sq. feet
|
4 baths 3 beds |
show details | |

|
#17
Douglas Fir Ct
Waleska, GA 30183
|
3,766 sq. feet
|
3 baths 4 beds |
show details | |

|
#18
Kellogg Creek Rd
Acworth, GA 30102
|
2,210 sq. feet
|
2 baths 3 beds |
show details | |

|
#19
Bethany Bnd
Alpharetta, GA 30004
|
1,964 sq. feet
|
1 baths 2 beds |
show details | |

|
#20
Old Alabama Rd SE
Emerson, GA 30137
|
1,320 sq. feet
|
2 baths 3 beds |
show details |
| Photo | Address | Area | Beds / Baths | Price | Details |
|---|---|---|---|---|---|

|
#21
Interlaken Dr
Marietta, GA 30062
|
2,612 sq. feet
|
2 baths 3 beds |
show details | |

|
#22
Hopewell Rd
Alpharetta, GA 30004
|
872 sq. feet
|
1 baths 3 beds |
show details | |

|
#23
Ellenton Pl
Canton, GA 30115
|
3,756 sq. feet
|
4 baths 5 beds |
show details | |

|
#24
Sylvan Dr
Marietta, GA 30066
|
1,832 sq. feet
|
2 baths 4 beds |
show details | |

|
#25
Tabbystone St NW
Marietta, GA 30064
|
4,661 sq. feet
|
5 baths 6 beds |
show details | |

|
#26
Heritage Park Trce NW
Kennesaw, GA 30144
|
1,780 sq. feet
|
3 baths 3 beds |
show details | |

|
#27
Windfields Ln
Woodstock, GA 30188
|
5,242 sq. feet
|
5 baths 5 beds |
show details | |

|
#28
Westover Ct
Woodstock, GA 30188
|
2,304 sq. feet
|
2 baths 3 beds |
show details | |

|
#29
Bells Ferry Rd
Canton, GA 30114
|
1,152 sq. feet
|
1 baths 2 beds |
show details | |

|
#30
Old Mill Rd
Ball Ground, GA 30107
|
3,144 sq. feet
|
3 baths 3 beds |
show details |
| Photo | Address | Area | Beds / Baths | Price | Details |
|---|---|---|---|---|---|

|
#31
Tallapoosa Trl
Woodstock, GA 30188
|
2,170 sq. feet
|
3 baths 4 beds |
show details | |

|
#32
Little Willeo Rd
Marietta, GA 30068
|
2,097 sq. feet
|
3 baths 4 beds |
show details | |

|
#33
Orchid Ln
Canton, GA 30114
|
2,684 sq. feet
|
3 baths 5 beds |
show details | |

|
#34
Tennis Court Ln NW
Kennesaw, GA 30144
|
1,969 sq. feet
|
3 baths 3 beds |
show details | |

|
#35
Brighton Pt
Atlanta, GA 30328
|
1,200 sq. feet
|
3 baths 3 beds |
show details | |

|
#36
W Oaks Way
Woodstock, GA 30188
|
1,232 sq. feet
|
2 baths 2 beds |
show details | |

|
#37
Moore St
Cartersville, GA 30120
|
1,456 sq. feet
|
1 baths 2 beds |
show details | |

|
#38
E Carter St
Cartersville, GA 30120
|
2,504 sq. feet
|
2 baths 4 beds |
show details | |

|
#39
Carmel Ct NW
Kennesaw, GA 30144
|
1,458 sq. feet
|
3 baths 3 beds |
show details | |

|
#40
Fox Ln SE
Marietta, GA 30067
|
1,970 sq. feet
|
3 baths 3 beds |
show details |
| Photo | Address | Area | Beds / Baths | Price | Details |
|---|---|---|---|---|---|

|
#41
Clover Ct
Roswell, GA 30075
|
2,336 sq. feet
|
5 baths 3 beds |
show details | |

|
#42
Broadview Dr
Marietta, GA 30062
|
2,127 sq. feet
|
3 baths 3 beds |
show details | |

|
#43
Upper Bethany Rd
Ball Ground, GA 30107
|
1,599 sq. feet
|
1 baths 3 beds |
show details | |

|
#44
Confederate Trl NW
Kennesaw, GA 30152
|
2,718 sq. feet
|
2 baths 4 beds |
show details | |

|
#45
Bethany Bnd
Alpharetta, GA 30004
|
1,964 sq. feet
|
1 baths 2 beds |
show details | |

|
#46
Litchfield Pl
Roswell, GA 30076
|
1,782 sq. feet
|
2 baths 3 beds |
show details | |

|
#47
Streamside Dr
Roswell, GA 30076
|
1,249 sq. feet
|
2 baths 2 beds |
show details | |

|
#48
Barn Swallow Pl
Marietta, GA 30062
|
2,761 sq. feet
|
2 baths 4 beds |
show details | |

|
#49
Starlight Dr
Marietta, GA 30062
|
1,591 sq. feet
|
2 baths 2 beds |
show details | |

|
Check over 1 million property listings on Foreclosure.com!
|
browse all offers | |||


 | Housing prices are ridiculous (82 replies) |
| Cherokee County(Holly Springs) Vs Cumming Schools (9 replies) |
| Hickory Flat Elementary, Holly Springs,GA (4 replies) |
| Commuting from Blue Ridge to ATL, crazy idea? (70 replies) |
| Apartments in Canton, Holly Springs, Woodstock, GA (3 replies) |
| Relocating from FL - looking for best area, for family of 4 with young kids (35 replies) |
Median year apartment built: 2007
Household type by relationship:
Households: 17,464- Male householders: 3,050 (519 living alone), Female householders: 3,246 (600 living alone)
3,844 spouses (3,832 opposite-sex spouses), 236 unmarried partners, (200 opposite-sex unmarried partners), 5,573 children (5,210 natural, 174 adopted, 188 stepchildren), 408 grandchildren, 14 brothers or sisters, 319 parents, 0 foster children, 446 other relatives, 319 non-relatives
- In group quarters: 3
Size of family households: 1,598 2-persons, 1,101 3-persons, 1,045 4-persons, 564 5-persons, 433 6-persons, 77 7-or-more-persons.
Size of nonfamily households: 1,290 1-person, 359 2-persons.
3,544 married couples with children.
513 single-parent households (62 men, 451 women).
88.9% of residents of Holly Springs speak English at home.
5.8% of residents speak Spanish at home (71% speak English very well, 22% speak English well, 1% speak English not well, 5% don't speak English at all).
4.8% of residents speak other Indo-European language at home (71% speak English very well, 15% speak English well, 12% speak English not well, 3% don't speak English at all).
0.2% of residents speak Asian or Pacific Island language at home (66% speak English very well, 34% speak English well).
0.1% of residents speak other language at home (100% speak English very well).
Foreign born population: 1,274 (7.3%)
(47.5% of them are naturalized citizens)
| Here: | 7.3 |
| State: | 6.8 |
| Here: | 5.4 |
| State: | 4.6 |

- Bedrooms in owner-occupied houses and condos in Holly Springs, Georgia
- 0no bedroom
- 01 bedroom
- 3002 bedrooms
- 1,7463 bedrooms
- 1,6074 bedrooms
- 1,2185+ bedrooms

- Bedrooms in renter-occupied apartments in Holly Springs, Georgia
- 0no bedroom
- 3701 bedroom
- 4872 bedrooms
- 5153 bedrooms
- 1744 bedrooms
- 05+ bedrooms

- Cars and other vehicles available in Holly Springs in owner-occupied houses/condos
- 78no vehicle
- 7471 vehicle
- 2,6862 vehicles
- 1,1013 vehicles
- 1344 vehicles
- 1245+ vehicles

- Cars and other vehicles available in Holly Springs in renter-occupied apartments
- 46no vehicle
- 5131 vehicle
- 9722 vehicles
- 153 vehicles
- 04 vehicles
- 05+ vehicles

- Rooms in owner-occupied houses in Holly Springs, Georgia
- 01 room
- 02 rooms
- 163 rooms
- 1204 rooms
- 5885 rooms
- 1,0096 rooms
- 7707 rooms
- 6348 rooms
- 1,7359+ rooms

- Rooms in renter-occupied apartments in Holly Springs, Georgia
- 01 room
- 1282 rooms
- 3033 rooms
- 2614 rooms
- 1015 rooms
- 6466 rooms
- 867 rooms
- 18 rooms
- 199+ rooms


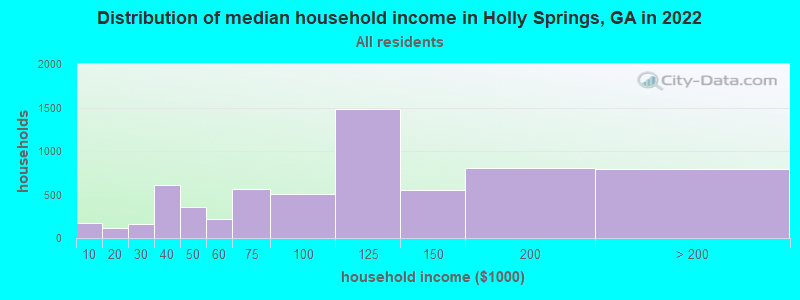
Holly Springs, GA household income distribution

- 173Less than $10,000
- 116$10,000 to $19,999
- 158$20,000 to $29,999
- 609$30,000 to $39,999
- 354$40,000 to $49,999
- 217$50,000 to $59,999
- 562$60,000 to $74,999
- 503$75,000 to $99,999
- 1,483$100,000 to $124,999
- 552$125,000 to $149,999
- 808$150,000 to $199,999
- 796$200,000 or more
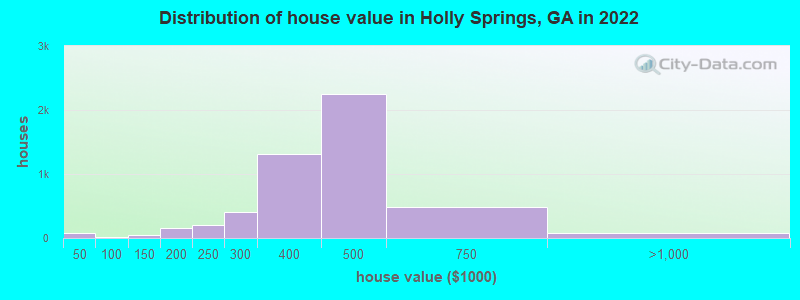
Home value of owner - occupied houses in 2022 in Holly Springs, GA
-
- 25$15,000 to $19,999
- 22$30,000 to $34,999
- 13$35,000 to $39,999
- 12$40,000 to $49,999
- 9$100,000 to $124,999
- 39$125,000 to $149,999
- 39$150,000 to $174,999
- 115$175,000 to $199,999
- 207$200,000 to $249,999
- 405$250,000 to $299,999
- 1,314$300,000 to $399,999
- 2,244$400,000 to $499,999
- 486$500,000 to $749,999
- 74$750,000 to $999,999
Rent paid by renters in 2022 in Holly Springs, GA
-
- 21Less than $100
- 43$600 to $649
- 100$800 to $899
- 263$1,000 to $1,249
- 190$1,250 to $1,499
- 843$1,500 to $1,999
- 118$2,000 to $2,499
- 31No cash rent


Percentage of workers working in this county: 58.0%
Number of people working at home: 2,403 (25.4% of all workers)
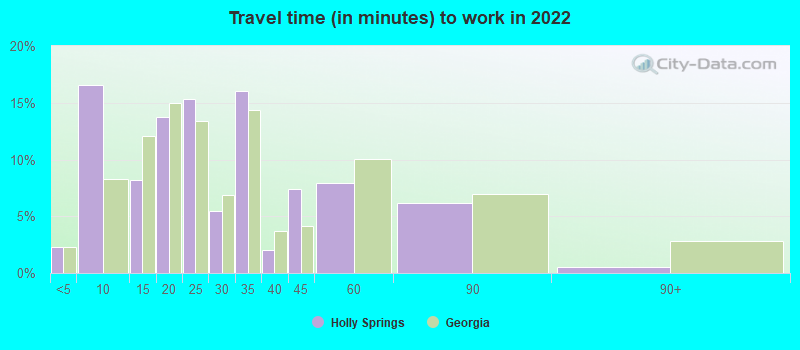
Travel time to work (commute)
- Less than 5 minutes: 129
- 5 to 9 minutes: 1,080
- 10 to 14 minutes: 644
- 15 to 19 minutes: 534
- 20 to 24 minutes: 188
- 25 to 29 minutes: 576
- 30 to 34 minutes: 1,057
- 35 to 39 minutes: 123
- 40 to 44 minutes: 552
- 45 to 59 minutes: 1,327
- 60 to 89 minutes: 812
- 90 or more minutes: 184
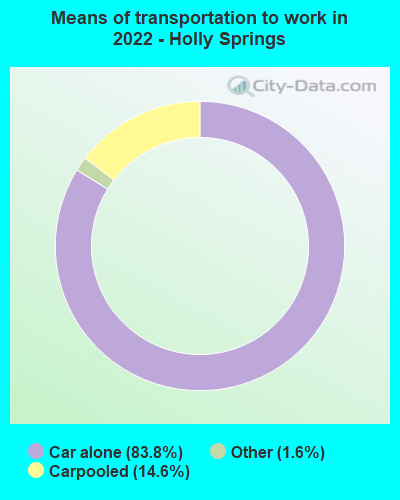
Means of transportation to work:
- Drove a car alone: 2,817 (52.2%)
- Carpooled: 514 (9.5%)
- Taxi: 56 (1.0%)
- Worked at home: 2,480 (46.0%)

- Unemployment by race in 2022
- Unemployment rate for White non-Hispanic residents
- 1.9%Males
- 1.4%Females
- Unemployment rate for Black residents
- 13.0%Males
- 19.3%Females

- Year of entry for the foreign-born population in Holly Springs, Georgia
- 2752010 or later
- 5072000 to 2009
- 2451990 to 1999
- 181980 to 1989
- 01970 to 1979
- 22Before 1970
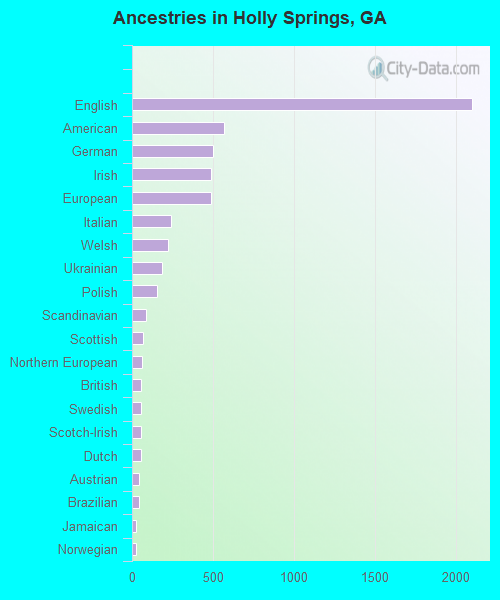
First ancestries reported:
- English: 2,102 (27.8%)
- American: 566 (7.5%)
- German: 502 (6.6%)
- Irish: 490 (6.5%)
- European: 487 (6.4%)
- Italian: 241 (3.2%)
- Welsh: 222 (2.9%)
- Ukrainian: 188 (2.5%)
- Polish: 157 (2.1%)
- Scandinavian: 88 (1.2%)
- Scottish: 68 (0.9%)
- Northern European: 64 (0.8%)
- British: 58 (0.8%)
- Swedish: 56 (0.7%)
- Scotch-Irish: 55 (0.7%)
- Dutch: 53 (0.7%)
- Austrian: 44 (0.6%)
- Brazilian: 43 (0.6%)
- Jamaican: 25 (0.3%)
- Norwegian: 23 (0.3%)
- Egyptian: 16 (0.2%)
- Armenian: 15 (0.2%)
- Portuguese: 15 (0.2%)
- French: 12 (0.2%)
- Hungarian: 10 (0.1%)
- Russian: 10 (0.1%)
Most common places of birth for foreign-born residents (%):
| Holly Springs: | 15.4% (213) |
| Georgia: | 20.0% (223,400) |
| Holly Springs: | 13.5% (187) |
| Georgia: | 0.5% (6,116) |
| Holly Springs: | 13.5% (186) |
| Georgia: | 0.4% (4,193) |
| Holly Springs: | 10.8% (149) |
| Georgia: | 0.4% (4,387) |
| Holly Springs: | 9.4% (130) |
| Georgia: | 1.1% (11,847) |
| Holly Springs: | 4.4% (61) |
| Georgia: | 9.2% (103,325) |
| Holly Springs: | 3.5% (48) |
| Georgia: | 1.6% (17,851) |
| Holly Springs: | 3.3% (46) |
| Georgia: | 1.6% (18,211) |
| Holly Springs: | 3.1% (43) |
| Georgia: | 2.1% (23,813) |
| Holly Springs: | 2.6% (36) |
| Georgia: | 0.1% (792) |
| Holly Springs: | 2.5% (35) |
| Georgia: | 0.2% (1,739) |
| Holly Springs: | 2.5% (35) |
| Georgia: | 1.2% (12,946) |
| Holly Springs: | 2.5% (34) |
| Georgia: | 0.5% (5,046) |
| Holly Springs: | 2.5% (34) |
| Georgia: | 4.6% (51,270) |
| Holly Springs: | 2.4% (33) |
| Georgia: | 0.1% (891) |
| Holly Springs: | 2.3% (32) |
| Georgia: | 0.3% (3,179) |
| Holly Springs: | 1.7% (24) |
| Georgia: | 1.8% (20,700) |
Place of birth for U.S.-born residents:
- This state: 7,444
- Other state: 8,550
- Northeast: 1,284
- Midwest: 2,365
- South: 3,621
- West: 1,382
87.7% of Holly Springs residents lived in the same house 1 years ago.
Out of people who lived in different houses, 25.4% lived in this county.
Out of people who lived in different counties, 63.1% lived in Georgia.
| Holly Springs: | 87.7% |
| State average: | 86.6% |
Education attainment for males 25 years and older:
- No schooling: 0
- Nursery to 4th grade: 12
- 5th and 6th grade: 104
- 7th and 8th grade: 29
- 9th grade: 0
- 10th grade: 0
- 11th grade: 11
- 12th grade, no diploma: 56
- High school graduate (or equivalency): 1,338
- Less than 1 year of college: 242
- Some college more than 1 year, no degree: 819
- Associate degree: 316
- Bachelor's degree: 1,967
- Master's degree: 649
- Professional school degree: 7
- Doctorate degree: 76

Education attainment for females 25 years and older:
- No schooling: 24
- Nursery to 4th grade: 0
- 5th and 6th grade: 0
- 7th and 8th grade: 32
- 9th grade: 0
- 10th grade: 14
- 11th grade: 223
- 12th grade, no diploma: 15
- High school graduate (or equivalency): 1,628
- Less than 1 year of college: 184
- Some college more than 1 year, no degree: 802
- Associate degree: 643
- Bachelor's degree: 1,658
- Master's degree: 661
- Professional school degree: 107
- Doctorate degree: 67

Housing units in structures:
- One, detached: 5,342
- One, attached: 535
- 3 or 4: 232
- 5 to 9: 122
- 10 to 19: 107
- 20 to 49: 189
- 50 or more: 133
- Mobile homes: 11
House/condo owner moved in on average 3 years ago
Renter moved in on average 3 years ago

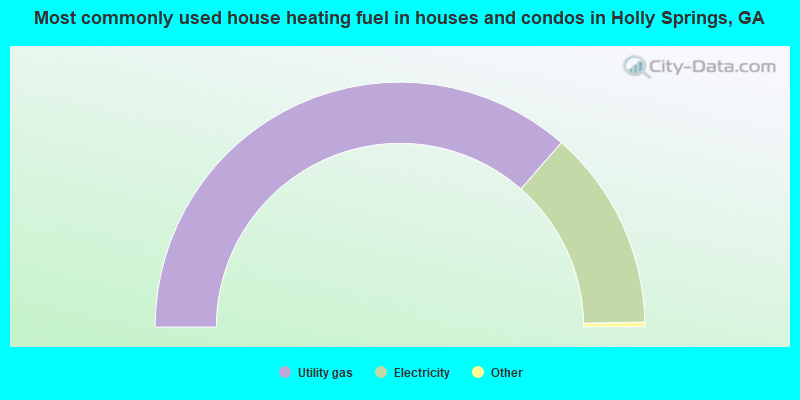
- 72.9%Utility gas
- 26.5%Electricity
- 0.4%Wood
- 0.2%Bottled, tank, or LP gas
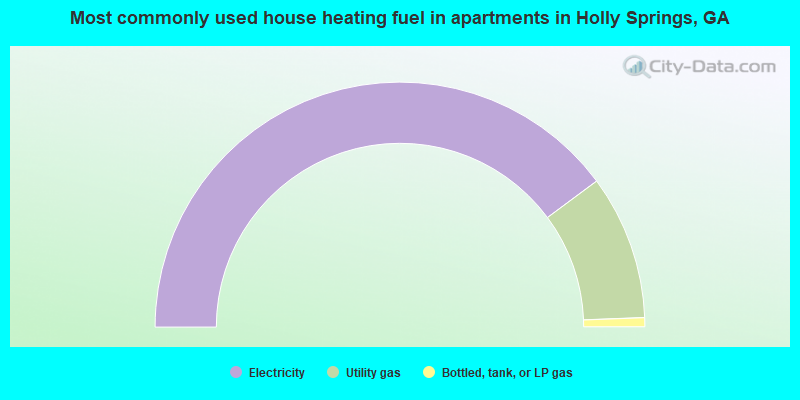
- 79.7%Electricity
- 19.1%Utility gas
- 1.2%Bottled, tank, or LP gas
Private vs. public school enrollment:
| Here: | 9.7% |
| Georgia: | 12.1% |
| Here: | 6.0% |
| Georgia: | 10.8% |
| Here: | 24.5% |
| Georgia: | 17.1% |


