Henderson, NV (Nevada) Houses and Residents
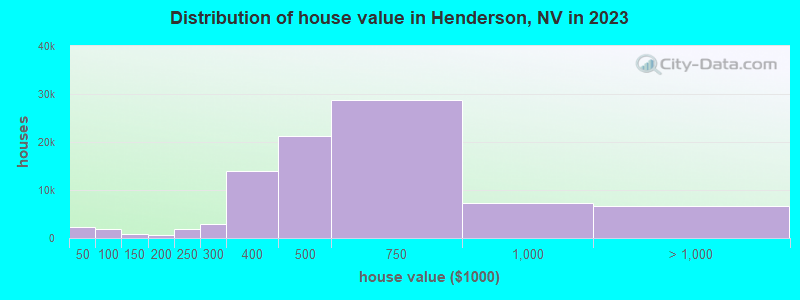
Estimated median house or condo value in 2022: $489,600 (it was $151,400 in 2000 )
Henderson:
$489,600Nevada:
$434,700
Lower value quartile - upper value quartile: $379,500 - $672,500Mean price in 2022: Detached houses: $597,683 Here:
$597,683State:
$549,327
Townhouses or other attached units: $361,060 Here:
$361,060State:
$328,893
In 2-unit structures: $289,009 Here:
$289,009State:
$326,466
In 3-to-4-unit structures: $360,051 Here:
$360,051State:
$295,216
In 5-or-more-unit structures: $246,590 Here:
$246,590State:
$297,847
Mobile homes: $96,780 Here:
$96,780State:
$159,995
Occupied boats, RVs, vans, etc.: $386,102 Here:
$386,102State:
$92,244
Total population: 277,440 (Urban population: 172,455, Rural population: 3,593 (all nonfarm) )
Houses: 143,835 (133,443 occupied: 87,279 owner occupied, 46,164 renter occupied )
% of renters here:
35%State:
40%
Housing density: 1,805 houses/condos per square mile
Median price asked for vacant for-sale houses and condos in 2022: $691,424.
Median contract rent in 2022: $1,567 (lower quartile is $1,231, upper quartile is $1,919)
Median rent asked for vacant for-rent units in 2022: $2,417
Median gross rent in Henderson, NV in 2022: $1,719
Housing units in Henderson with a mortgage: 60,271 (4,199 second mortgage, 80 home equity loan, 4,090 both second mortgage and home equity loan )Houses without a mortgage: 1,034
Median household income for houses/condos with a mortgage: $107,879
Median household income for apartments without a mortgage: $82,795
Median monthly housing costs: $1,632
Data:
Median house or condo value ($)
Median house or condo value ($ change since 2000)
Median house or condo value ($) - White
Median house or condo value ($) - Black or African American
Median house or condo value ($) - Asian
Median house or condo value ($) - Hispanic or Latino
Median house or condo value ($) - American Indian and Alaska Native
Median house or condo value ($) - Multirace
Median house or condo value ($) - Other Race
Median price asked for mobile homes ($)
Household density (households per square mile)
Mean house or condo value by units in structure - 1, detached ($)
Mean house or condo value by units in structure - 1, attached ($)
Mean house or condo value by units in structure - 2 ($)
Mean house or condo value by units in structure by units in structure - 3 or 4 ($)
Mean house or condo value by units in structure - 5 or more ($)
Mean house or condo value by units in structure - Boat, RV, van, etc. ($)
Mean house or condo value by units in structure - Mobile home ($)
Median contract rent ($)
Median contract rent - Lower quartile ($)
Median contract rent - Upper quartile ($)
Median gross rent ($)
Urban houses (%)
Rural houses (%)
Houses occupied (%)
Houses occupied (% change since 2000)
Houses owner occupied (%)
Houses owner occupied (% change since 2000)
Houses renter occupied (%)
Houses renter occupied (% change since 2000)
Vacant housing units - For rent (%)
Vacant housing units - For rent (% change since 2000)
Vacant housing units - For sale only (%)
Vacant housing units - For sale only (% change since 2000)
Vacant housing units - Rented or sold, not occupied (%)
Vacant housing units - Rented or sold, not occupied (% change since 2000)
Vacant housing units - For seasonal, recreational, or occasional use (%)
Vacant housing units - For seasonal, recreational, or occasional use (% change since 2000)
Vacant housing units - For migrant workers (%)
Vacant housing units - For migrant workers (% change since 2000)
Vacant housing units - Other vacant (%)
Vacant housing units - Other vacant (% change since 2000)
Median monthly housing costs ($)
Median household income for houses/condos with a mortgage ($)
Median household income for houses/condos without a mortgage ($)
Median household income ($)
Median household income ($) - White
Median household income ($) - Black or African American
Median household income ($) - Asian
Median household income ($) - Hispanic or Latino
Median household income ($) - American Indian and Alaska Native
Median household income ($) - Multirace
Median household income ($) - Other Race
Mortgage status - with mortgage (%)
Mortgage status - with second mortgage (%)
Mortgage status - with home equity loan (%)
Mortgage status - with both second mortgage and home equity loan (%)
Mortgage status - without a mortgage (%)
Median year house/condo built
Median year apartment built
Household type by relationship - Male householder living alone (%)
Household type by relationship - Male householder not living alone (%)
Household type by relationship - Female householder living alone (%)
Household type by relationship - Female householder not living alone (%)
Household type by relationship - Opposite-Sex spouse (%)
Household type by relationship - Same-Sex spouse (%)
Household type by relationship - Opposite-Sex unmarried partner (%)
Household type by relationship - Same-Sex unmarried partner (%)
Household type by relationship - In group quarters (%)
Size of family households - 2-person household (%)
Size of family households - 3-person household (%)
Size of family households - 4-person household (%)
Size of family households - 5-person household (%)
Size of family households - 6-person household (%)
Size of family households - 7-or-more-person household (%)
Size of nonfamily households - 1-person household (%)
Size of nonfamily households - 2-person household (%)
Size of nonfamily households - 3-person household (%)
Size of nonfamily households - 4-person household (%)
Size of nonfamily households - 5-person household (%)
Size of nonfamily households - 6-person household (%)
Size of nonfamily households - 7-or-moreperson household (%)
Year house built - Built 2010 or later (%)
Year house built - Built 2000 to 2009 (%)
Year house built - Built 1990 to 1999 (%)
Year house built - Built 1980 to 1989 (%)
Year house built - Built 1970 to 1979 (%)
Year house built - Built 1960 to 1969 (%)
Year house built - Built 1950 to 1959 (%)
Year house built - Built 1940 to 1949 (%)
Year house built - Built 1939 or earlier (%)
Median number of rooms in houses and condos
Median number of rooms in apartments
Median number of bedrooms in owner occupied houses
Mean number of bedrooms in owner occupied houses
Median number of bedrooms in renter occupied houses
Mean number of bedrooms in renter occupied houses
Median number of vehichles in owner occupied houses
Mean number of vehichles in owner occupied houses
Median number of vehichles in renter occupied houses
Mean number of vehichles in renter occupied houses
Rooms in owner-occupied houses - 1 room (%)
Rooms in owner-occupied houses - 2 rooms (%)
Rooms in owner-occupied houses - 3 rooms (%)
Rooms in owner-occupied houses - 4 rooms (%)
Rooms in owner-occupied houses - 5 rooms (%)
Rooms in owner-occupied houses - 6 rooms (%)
Rooms in owner-occupied houses - 7 rooms (%)
Rooms in owner-occupied houses - 8 rooms (%)
Rooms in owner-occupied houses - 9+ rooms (%)
Rooms in renter-occupied houses - 1 room (%)
Rooms in renter-occupied houses - 2 rooms (%)
Rooms in renter-occupied houses - 3 rooms (%)
Rooms in renter-occupied houses - 4 rooms (%)
Rooms in renter-occupied houses - 5 rooms (%)
Rooms in renter-occupied houses - 6 rooms (%)
Rooms in renter-occupied houses - 7 rooms (%)
Rooms in renter-occupied houses - 8 rooms (%)
Rooms in renter-occupied houses - 9+ rooms (%)
Bedrooms in owner-occupied houses - no bedrooms (%)
Bedrooms in owner-occupied houses - 1 bedroom (%)
Bedrooms in owner-occupied houses - 2 bedrooms (%)
Bedrooms in owner-occupied houses - 3 bedrooms (%)
Bedrooms in owner-occupied houses - 4 bedrooms (%)
Bedrooms in owner-occupied houses - 5+ bedrooms (%)
Bedrooms in renter-occupied houses - no bedrooms (%)
Bedrooms in renter-occupied houses - 1 bedroom (%)
Bedrooms in renter-occupied houses - 2 bedrooms (%)
Bedrooms in renter-occupied houses - 3 bedrooms (%)
Bedrooms in renter-occupied houses - 4 bedrooms (%)
Bedrooms in renter-occupied houses - 5+ bedrooms (%)
Vehicles available in owner-occupied houses - no vehicle available (%)
Vehicles available in owner-occupied houses - 1 vehicle available(%)
Vehicles available in owner-occupied houses - 2 Vehicles available (%)
Vehicles available in owner-occupied houses - 3 Vehicles available (%)
Vehicles available in owner-occupied houses - 4 Vehicles available (%)
Vehicles available in owner-occupied houses - 5+ Vehicles available (%)
Vehicles available in renter-occupied houses - no vehicle available (%)
Vehicles available in renter-occupied houses - 1 vehicle available (%)
Vehicles available in renter-occupied houses - 2 Vehicles available (%)
Vehicles available in renter-occupied houses - 3 Vehicles available (%)
Vehicles available in renter-occupied houses - 4 Vehicles available (%)
Vehicles available in renter-occupied houses - 5+ Vehicles available (%)
Housing units in structures - 1, detached (%)
Housing units in structures - 1, attached (%)
Housing units in structures - 2 (%)
Housing units in structures - 3 or 4 (%)
Housing units in structures - 5 to 9 (%)
Housing units in structures - 10 to 19 (%)
Housing units in structures - 20 to 49 (%)
Housing units in structures - 50 or more (%)
Housing units in structures - Mobile home (%)
Housing units in structures - Boat, RV, van, etc. (%)
Housing units in structures - Owners - 1, detached (%)
Housing units in structures - Owners - 1, attached (%)
Housing units in structures - Owners - 2 (%)
Housing units in structures - Owners - 3 or 4 (%)
Housing units in structures - Owners - 5 to 9 (%)
Housing units in structures - Owners - 10 to 19 (%)
Housing units in structures - Owners - 20 to 49 (%)
Housing units in structures - Owners - 50 or more (%)
Housing units in structures - Owners - Mobile home (%)
Housing units in structures - Owners - Boat, RV, van, etc. (%)
Housing units in structures - Renters - 1, detached (%)
Housing units in structures - Renters - 1, attached (%)
Housing units in structures - Renters - 2 (%)
Housing units in structures - Renters - 3 or 4 (%)
Housing units in structures - Renters - 5 to 9 (%)
Housing units in structures - Renters - 10 to 19 (%)
Housing units in structures - Renters - 20 to 49 (%)
Housing units in structures - Renters - 50 or more (%)
Housing units in structures - Renters - Mobile home (%)
Housing units in structures - Renters - Boat, RV, van, etc. (%)
House/condo owner moved in on average (years ago)
Renter moved in on average (years ago)
Year householder moved into unit - Moved in 1999 to March 2000 (%)
Year householder moved into unit - Moved in 1999 to March 2000 (%) - White
Year householder moved into unit - Moved in 1999 to March 2000 (%) - Black or African American
Year householder moved into unit - Moved in 1999 to March 2000 (%) - Asian
Year householder moved into unit - Moved in 1999 to March 2000 (%) - Hispanic or Latino
Year householder moved into unit - Moved in 1999 to March 2000 (%) - American Indian and Alaska Native
Year householder moved into unit - Moved in 1999 to March 2000 (%) - Multirace
Year householder moved into unit - Moved in 1999 to March 2000 (%) - Other Race
Year householder moved into unit - Moved in 1995 to 1998 (%)
Year householder moved into unit - Moved in 1995 to 1998 (%) - White
Year householder moved into unit - Moved in 1995 to 1998 (%) - Black or African American
Year householder moved into unit - Moved in 1995 to 1998 (%) - Asian
Year householder moved into unit - Moved in 1995 to 1998 (%) - Hispanic or Latino
Year householder moved into unit - Moved in 1995 to 1998 (%) - American Indian and Alaska Native
Year householder moved into unit - Moved in 1995 to 1998 (%) - Multirace
Year householder moved into unit - Moved in 1995 to 1998 (%) - Other Race
Year householder moved into unit - Moved in 1990 to 1994 (%)
Year householder moved into unit - Moved in 1990 to 1994 (%) - White
Year householder moved into unit - Moved in 1990 to 1994 (%) - Black or African American
Year householder moved into unit - Moved in 1990 to 1994 (%) - Asian
Year householder moved into unit - Moved in 1990 to 1994 (%) - Hispanic or Latino
Year householder moved into unit - Moved in 1990 to 1994 (%) - American Indian and Alaska Native
Year householder moved into unit - Moved in 1990 to 1994 (%) - Multirace
Year householder moved into unit - Moved in 1990 to 1994 (%) - Other Race
Year householder moved into unit - Moved in 1980 to 1989 (%)
Year householder moved into unit - Moved in 1980 to 1989 (%) - White
Year householder moved into unit - Moved in 1980 to 1989 (%) - Black or African American
Year householder moved into unit - Moved in 1980 to 1989 (%) - Asian
Year householder moved into unit - Moved in 1980 to 1989 (%) - Hispanic or Latino
Year householder moved into unit - Moved in 1980 to 1989 (%) - American Indian and Alaska Native
Year householder moved into unit - Moved in 1980 to 1989 (%) - Multirace
Year householder moved into unit - Moved in 1980 to 1989 (%) - Other Race
Year householder moved into unit - Moved in 1970 to 1979 (%)
Year householder moved into unit - Moved in 1970 to 1979 (%) - White
Year householder moved into unit - Moved in 1970 to 1979 (%) - Black or African American
Year householder moved into unit - Moved in 1970 to 1979 (%) - Asian
Year householder moved into unit - Moved in 1970 to 1979 (%) - Hispanic or Latino
Year householder moved into unit - Moved in 1970 to 1979 (%) - American Indian and Alaska Native
Year householder moved into unit - Moved in 1970 to 1979 (%) - Multirace
Year householder moved into unit - Moved in 1970 to 1979 (%) - Other Race
Year householder moved into unit - Moved in 1969 or earlier (%)
Year householder moved into unit - Moved in 1969 or earlier (%) - White
Year householder moved into unit - Moved in 1969 or earlier (%) - Black or African American
Year householder moved into unit - Moved in 1969 or earlier (%) - Asian
Year householder moved into unit - Moved in 1969 or earlier (%) - Hispanic or Latino
Year householder moved into unit - Moved in 1969 or earlier (%) - American Indian and Alaska Native
Year householder moved into unit - Moved in 1969 or earlier (%) - Multirace
Year householder moved into unit - Moved in 1969 or earlier (%) - Other Race
Housing units lacking complete plumbing facilities (%)
Housing units lacking complete kitchen facilities (%)
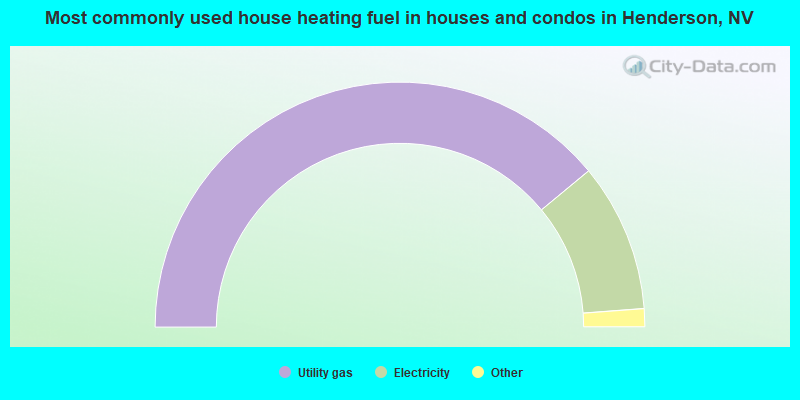
House heating fuel used in houses and condos - Utility gas (%)
House heating fuel used in houses and condos - Bottled, tank, or LP gas (%)
House heating fuel used in houses and condos - Electricity (%)
House heating fuel used in houses and condos - Fuel oil, kerosene, etc. (%)
House heating fuel used in houses and condos - Coal or coke (%)
House heating fuel used in houses and condos - Wood (%)
House heating fuel used in houses and condos - Solar energy (%)
House heating fuel used in houses and condos - Other fuel (%)
House heating fuel used in houses and condos - No fuel used (%)
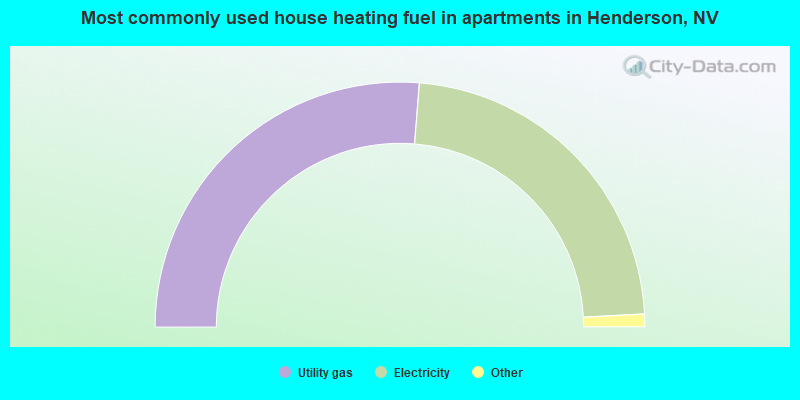
House heating fuel used in apartments - Utility gas (%)
House heating fuel used in apartments - Bottled, tank, or LP gas (%)
House heating fuel used in apartments - Electricity (%)
House heating fuel used in apartments - Fuel oil, kerosene, etc. (%)
House heating fuel used in apartments - Coal or coke (%)
House heating fuel used in apartments - Wood (%)
House heating fuel used in apartments - Solar energy (%)
House heating fuel used in apartments - Other fuel (%)
House heating fuel used in apartments - No fuel used (%)
Latest news about housing in Henderson, NV collected exclusively by city-data.com from local newspapers, TV, and radio stations
Median year house/condo built: 2001Median year apartment built: 2003Household type by relationship:
Households: 331,408
Male householders: 64,850 (16,284 living alone ), Female householders: 68,593 (21,685 living alone )64,661 spouses (63,871 opposite-sex spouses ), 9,057 unmarried partners , (8,704 opposite-sex unmarried partners ), 88,125 children (82,356 natural , 2,198 adopted , 3,571 stepchildren ), 8,790 grandchildren , 3,406 brothers or sisters , 6,107 parents , 262 foster children , 6,583 other relatives , 9,686 non-relatives In group quarters: 1,288
Size of family households: 41,941 2-persons , 16,039 3-persons , 17,279 4-persons , 6,155 5-persons , 2,449 6-persons , 1,824 7-or-more-persons .
Size of nonfamily households: 37,969 1-person , 8,879 2-persons , 837 3-persons , 71 5-persons .
43,489 married couples with children. single-parent households (4,373 men , 12,977 women ).
81.2% of residents of Henderson speak English at home. of residents speak Spanish at home (72% speak English very well , 18% speak English well , 8% speak English not well , 2% don't speak English at all ).of residents speak other Indo-European language at home (78% speak English very well , 16% speak English well , 6% speak English not well , 1% don't speak English at all ).of residents speak Asian or Pacific Island language at home (71% speak English very well , 25% speak English well , 4% speak English not well , 1% don't speak English at all ).of residents speak other language at home (64% speak English very well , 30% speak English well , 6% don't speak English at all ).
Foreign born population: 47,702 (14.4%)of them are naturalized citizens )
Median number of rooms in houses and condos:
Median number of rooms in apartments
Owner-occupied Renter-occupied
Bedrooms in owner-occupied houses and condos in Henderson, Nevada
181 no bedroom 966 1 bedroom 13,972 2 bedrooms 38,890 3 bedrooms 23,650 4 bedrooms 9,620 5+ bedrooms
Bedrooms in renter-occupied apartments in Henderson, Nevada
2,212 no bedroom 8,655 1 bedroom 17,171 2 bedrooms 12,751 3 bedrooms 4,181 4 bedrooms 1,194 5+ bedrooms
Owner-occupied Renter-occupied
Cars and other vehicles available in Henderson in owner-occupied houses/condos
2,487 no vehicle 27,909 1 vehicle 36,904 2 vehicles 14,193 3 vehicles 4,106 4 vehicles 1,680 5+ vehicles
Cars and other vehicles available in Henderson in renter-occupied apartments
4,181 no vehicle 22,120 1 vehicle 14,783 2 vehicles 3,487 3 vehicles 1,463 4 vehicles 130 5+ vehicles
Owner-occupied Renter-occupied
Rooms in owner-occupied houses in Henderson, Nevada
110 1 room 100 2 rooms 2,660 3 rooms 10,550 4 rooms 15,763 5 rooms 20,322 6 rooms 12,882 7 rooms 10,347 8 rooms 14,545 9+ rooms
Rooms in renter-occupied apartments in Henderson, Nevada
2,212 1 room 2,616 2 rooms 8,451 3 rooms 12,256 4 rooms 8,169 5 rooms 6,810 6 rooms 2,407 7 rooms 1,548 8 rooms 1,695 9+ rooms
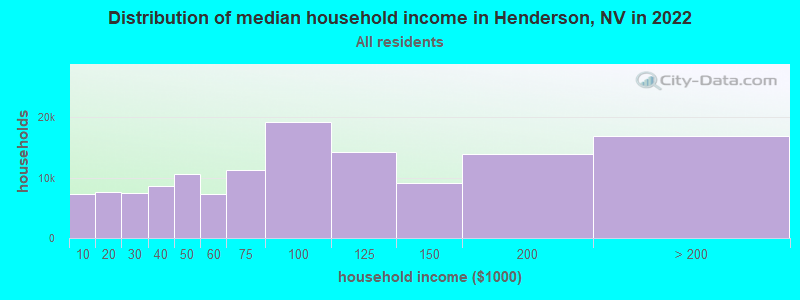
Henderson, NV household income distribution 7,298 Less than $10,0007,655 $10,000 to $19,9997,433 $20,000 to $29,9998,544 $30,000 to $39,99910,610 $40,000 to $49,9997,243 $50,000 to $59,99911,327 $60,000 to $74,99919,211 $75,000 to $99,99914,258 $100,000 to $124,9999,059 $125,000 to $149,99913,834 $150,000 to $199,99916,971 $200,000 or more
Home value of owner - occupied houses in 2022 in Henderson, NV 961 Less than $10,00040 $10,000 to $14,999105 $15,000 to $19,999289 $20,000 to $24,99990 $25,000 to $29,999224 $30,000 to $34,999344 $35,000 to $39,999325 $40,000 to $49,999458 $50,000 to $59,99956 $60,000 to $69,99956 $70,000 to $79,999524 $80,000 to $89,999170 $90,000 to $99,999325 $100,000 to $124,99990 $125,000 to $149,999492 $150,000 to $174,9991,460 $200,000 to $249,9994,505 $250,000 to $299,99914,230 $300,000 to $399,99921,098 $400,000 to $499,99928,438 $500,000 to $749,9999,138 $750,000 to $999,9991,816 $1,000,000 to $1,499,999773 $1,500,000 to $1,999,9991,272 $2,000,000 or moreRent paid by renters in 2022 in Henderson, NV 38 Less than $10052 $100 to $149109 $150 to $19957 $250 to $299187 $400 to $449452 $500 to $549290 $550 to $599478 $600 to $649807 $650 to $699463 $700 to $749244 $750 to $799515 $800 to $899913 $900 to $9997,245 $1,000 to $1,2498,617 $1,250 to $1,49916,013 $1,500 to $1,9996,586 $2,000 to $2,4991,477 $2,500 to $2,999496 $3,000 to $3,499178 $3,500 or more947 No cash rent
Percentage of workers working in this county: 97.8%Number of people working at home: 30,733 (19.9% of all workers )
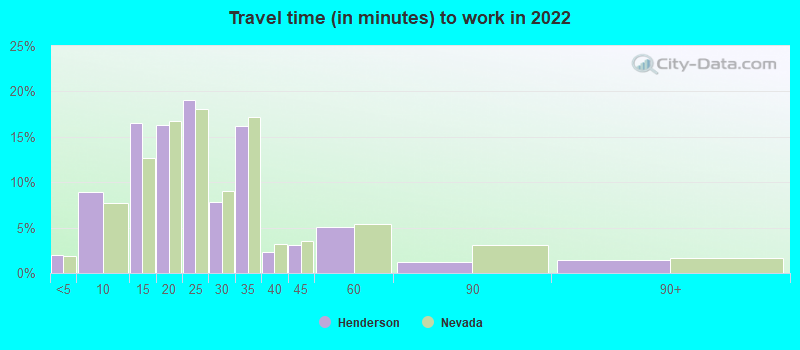
Travel time to work (commute)
Less than 5 minutes: 2,7225 to 9 minutes: 7,69110 to 14 minutes: 17,06215 to 19 minutes: 18,47820 to 24 minutes: 23,08125 to 29 minutes: 14,26330 to 34 minutes: 20,97035 to 39 minutes: 4,26240 to 44 minutes: 6,33645 to 59 minutes: 5,01560 to 89 minutes: 1,63790 or more minutes: 1,828
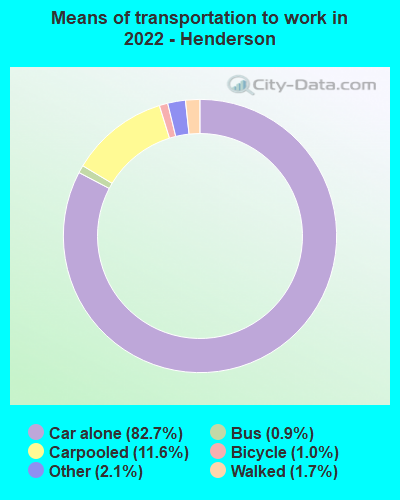
Means of transportation to work:
Drove a car alone: 73,824 (61.5%)Carpooled: 10,353 (8.6%)Bus : 776 (0.6%)Taxi: 1,857 (1.5%)Bicycle: 916 (0.8%)Walked: 1,546 (1.3%)Worked at home: 30,733 (25.6%)
Unemployment by race in 2022
Unemployment rate for White non-Hispanic residents 3.7% Males4.6% FemalesUnemployment rate for Black residents 4.9% Males6.3% FemalesUnemployment rate for American Indian and Alaska Native residents 16.8% Males7.2% FemalesUnemployment rate for Asian residents 8.1% Males1.5% FemalesUnemployment rate for other race residents 6.3% Males3.7% FemalesUnemployment rate for two or more race residents 0.9% Males8.5% FemalesUnemployment rate for Hispanic or Latino residents 2.4% Males10.5% Females
Year of entry for the foreign-born population in Henderson, Nevada
7,332 2010 or later 9,893 2000 to 2009 8,536 1990 to 1999 3,838 1980 to 1989 2,751 1970 to 1979 3,872 Before 1970
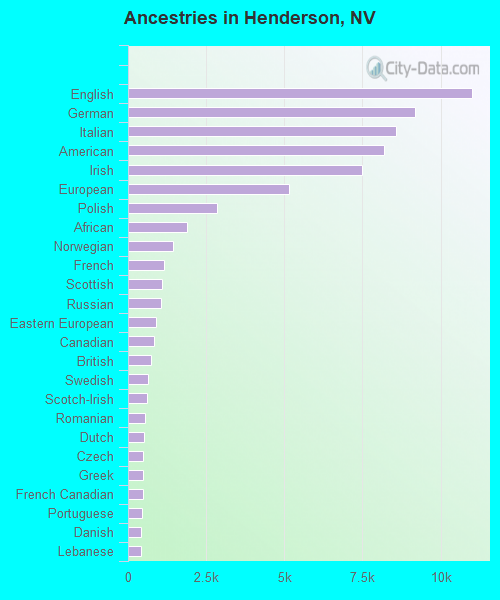
First ancestries reported:
English: 10,997 (7.0%)
German: 9,190 (5.9%)
Italian: 8,584 (5.5%)
American: 8,182 (5.2%)
Irish: 7,485 (4.8%)
European: 5,162 (3.3%)
Polish: 2,851 (1.8%)
African: 1,880 (1.2%)
Norwegian: 1,427 (0.9%)
French: 1,166 (0.7%)
Scottish: 1,089 (0.7%)
Russian: 1,054 (0.7%)
Eastern European: 909 (0.6%)
Canadian: 817 (0.5%)
British: 727 (0.5%)
Swedish: 653 (0.4%)
Scotch-Irish: 605 (0.4%)
Romanian: 551 (0.4%)
Dutch: 512 (0.3%)
Czech: 487 (0.3%)
Greek: 479 (0.3%)
French Canadian: 465 (0.3%)
Portuguese: 439 (0.3%)
Danish: 424 (0.3%)
Lebanese: 421 (0.3%)
Hungarian: 413 (0.3%)
Ukrainian: 405 (0.3%)
Welsh: 384 (0.2%)
Scandinavian: 369 (0.2%)
Egyptian: 321 (0.2%)
Lithuanian: 312 (0.2%)
Syrian: 280 (0.2%)
Serbian: 268 (0.2%)
Armenian: 256 (0.2%)
Iranian: 226 (0.1%)
Slovak: 221 (0.1%)
Jamaican: 218 (0.1%)
Trinidadian and Tobagonian: 207 (0.1%)
Belgian: 203 (0.1%)
Israeli: 172 (0.1%)
Croatian: 172 (0.1%)
Finnish: 168 (0.1%)
Swiss: 167 (0.1%)
Northern European: 136 (0.09%)
Bulgarian: 127 (0.08%)
Haitian: 122 (0.08%)
Moroccan: 116 (0.07%)
Iraqi: 112 (0.07%)
Austrian: 110 (0.07%)
Kenyan: 109 (0.07%)
Nigerian: 105 (0.07%)
South African: 97 (0.06%)
Czechoslovakian: 96 (0.06%)
Brazilian: 96 (0.06%)
Zimbabwean: 85 (0.05%)
Ghanaian: 80 (0.05%)
Yugoslavian: 66 (0.04%)
Icelander: 63 (0.04%)
Somali: 61 (0.04%)
British West Indian: 55 (0.04%)
Albanian: 50 (0.03%)
Australian: 49 (0.03%)
Palestinian: 47 (0.03%)
Cajun: 42 (0.03%)
Turkish: 40 (0.03%)
Slavic: 37 (0.02%)
Assyrian: 35 (0.02%)
Macedonian: 29 (0.02%)
Basque: 29 (0.02%)
Jordanian: 26 (0.02%)
Latvian: 25 (0.02%)
Pennsylvania German: 15 (0.01%)
Arab: 12 (0.01%)
Cape Verdean: 10 (0.01%)
Luxembourger: 9 (0.01%)
Most common places of birth for foreign-born residents (%): Philippines Henderson:
20.9% (9,541)Nevada:
15.5% (91,628)
Mexico Henderson:
19.1% (8,724)Nevada:
36.8% (218,248)
Canada Henderson:
4.2% (1,935)Nevada:
1.9% (11,407)
India Henderson:
3.7% (1,676)Nevada:
1.5% (9,074)
China, excluding Hong Kong and Taiwan Henderson:
3.6% (1,629)Nevada:
3.3% (19,621)
Cuba Henderson:
3.4% (1,534)Nevada:
4.2% (24,711)
Korea Henderson:
3.3% (1,528)Nevada:
1.8% (10,941)
Taiwan Henderson:
2.5% (1,126)Nevada:
0.9% (5,094)
El Salvador Henderson:
1.9% (850)Nevada:
4.0% (23,923)
Thailand Henderson:
1.7% (782)Nevada:
1.0% (5,914)
England Henderson:
1.6% (747)Nevada:
0.7% (4,038)
Japan Henderson:
1.6% (718)Nevada:
0.8% (4,783)
Germany Henderson:
1.5% (705)Nevada:
1.1% (6,392)
Place of birth for U.S.-born residents:
This state: 73,655Other state: 203,448Northeast: 35,474Midwest: 39,779South: 26,763West: 101,432 86.6% of Henderson residents lived in the same house 1 years ago.
Out of people who lived in different houses, 34.0% lived in this county.
Out of people who lived in different counties, 1.3% lived in Nevada.
Henderson:
86.6%State average:
86.4%
Education attainment for males 25 years and older:
No schooling: 998Nursery to 4th grade: 05th and 6th grade: 1517th and 8th grade: 5199th grade: 22010th grade: 79611th grade: 83212th grade, no diploma: 2,932High school graduate (or equivalency): 30,731Less than 1 year of college: 8,025Some college more than 1 year, no degree: 21,366Associate degree: 8,740Bachelor's degree: 26,778Master's degree: 8,503Professional school degree: 3,747Doctorate degree: 2,864
Education attainment for females 25 years and older:
No schooling: 1,502Nursery to 4th grade: 2305th and 6th grade: 5617th and 8th grade: 3259th grade: 32810th grade: 74211th grade: 1,34612th grade, no diploma: 1,454High school graduate (or equivalency): 27,074Less than 1 year of college: 9,965Some college more than 1 year, no degree: 24,135Associate degree: 13,456Bachelor's degree: 29,214Master's degree: 12,588Professional school degree: 3,386Doctorate degree: 1,010
Housing units in structures:
One, detached: 98,001One, attached: 10,019Two: 1,2443 or 4: 7,0855 to 9: 9,80710 to 19: 4,73320 to 49: 2,02350 or more: 7,785Mobile homes: 2,927Boats, RVs, vans, etc.: 211Median worth of mobile homes: $56,600
Housing units lacking complete plumbing facilities in 2022: 0.1%Housing units lacking complete kitchen facilities in 2022: 1.1%House/condo owner moved in on average 7 years ago
Renter moved in on average 2 years ago
Private vs. public school enrollment:
Students in private schools in grades 1 to 8 (elementary and middle school): 5,645 Students in private schools in grades 9 to 12 (high school): 513 Students in private undergraduate colleges: 2,489