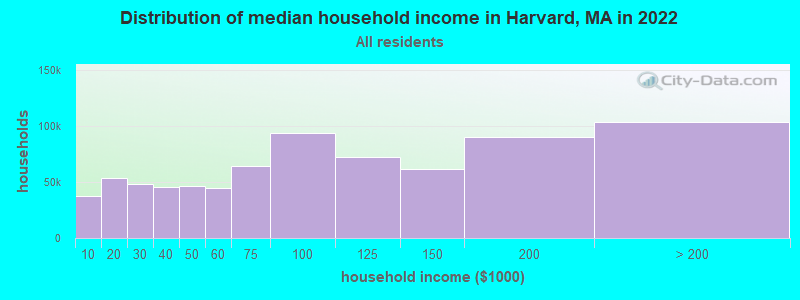
Median price asked for vacant for-sale houses and condos in 2022 in this county: $182,682.
Median contract rent in 2022: over $2,000 (lower quartile is $872, upper quartile is over $2,000)
Median rent asked for vacant for-rent units in 2022: $4,421
Median gross rent in Harvard, MA in 2022: over $2,000
Housing units in Harvard with a mortgage: 1,110 (113 second mortgage, 139 home equity loan, 0 both second mortgage and home equity loan) Houses without a mortgage: 324
In family households: 644,137 (138,415 male householders, 64,187 female householders)
151,406 spouses, 234,038 children (220,335 natural, 5,096 adopted, 8,607 stepchildren), 11,080 grandchildren, 6,742 brothers or sisters, 7,870 parents, foster children, 7,297 other relatives, 18,119 non-relatives
In nonfamily households: 127,370 (47,312 male householders (35,337 living alone)), 53,166 female householders (44,100 living alone)), 26,892 nonrelatives
In group quarters: 27,045 (11,315 institutionalized population)
135,695 married couples with children.
42,745 single-parent households (8,218 men, 34,527 women).
86.4% of residents of Harvard speak English at home.
6.8% of residents speak Spanish at home (20% speak English very well, 34% speak English well, 34% speak English not well, 12% don't speak English at all).
4.8% of residents speak other Indo-European language at home (77% speak English very well, 19% speak English well, 4% speak English not well).
1.2% of residents speak Asian or Pacific Island language at home (43% speak English very well, 20% speak English well, 29% speak English not well, 7% don't speak English at all).
0.8% of residents speak other language at home (76% speak English very well, 24% speak English well).
Foreign born population: 1,522 (22.1%)
(34.6% of them are naturalized citizens)
Year of entry for the foreign-born population in Harvard, Massachusetts
1301995 to March 2000
1481990 to 1994
1501985 to 1989
1201980 to 1984
931975 to 1979
91970 to 1974
211965 to 1969
77Before 1965
First ancestries reported:
English: 1,216 (17.3%)
Other: 1,109 (15.7%)
Irish: 1,088 (15.4%)
German: 680 (9.7%)
Italian: 400 (5.7%)
United States: 315 (4.5%)
Polish: 271 (3.8%)
Scottish: 265 (3.8%)
Russian: 259 (3.7%)
French: 226 (3.2%)
Swedish: 198 (2.8%)
French Canadian: 159 (2.3%)
West Indian: 102 (1.4%)
Scotch-Irish: 81 (1.1%)
Norwegian: 79 (1.1%)
Lithuanian: 75 (1.1%)
Dutch: 74 (1.1%)
Arab: 73 (1.0%)
Greek: 70 (1.0%)
Portuguese: 67 (1.0%)
Swiss: 66 (0.9%)
Welsh: 46 (0.7%)
Hungarian: 41 (0.6%)
Subsaharan African: 37 (0.5%)
Ukrainian: 24 (0.3%)
Czech: 16 (0.2%)
Slovak: 8 (0.1%)
Most common places of birth for foreign-born residents (%):
Mexico
Harvard:
15.4% (115)
Massachusetts:
1.0% (7,867)
Jamaica
Harvard:
13.4% (100)
Massachusetts:
1.7% (12,808)
Dominican Republic
Harvard:
11.6% (87)
Massachusetts:
6.0% (46,744)
Colombia
Harvard:
10.7% (80)
Massachusetts:
2.0% (15,286)
Russia
Harvard:
10.0% (75)
Massachusetts:
2.3% (17,449)
United Kingdom
Harvard:
5.2% (39)
Massachusetts:
3.3% (25,403)
China, excluding Hong Kong and Taiwan
Harvard:
3.3% (25)
Massachusetts:
5.1% (39,255)
Canada
Harvard:
3.2% (24)
Massachusetts:
5.2% (40,247)
Romania
Harvard:
2.4% (18)
Massachusetts:
0.3% (2,058)
Austria
Harvard:
2.0% (15)
Massachusetts:
0.2% (1,418)
Germany
Harvard:
1.9% (14)
Massachusetts:
1.9% (14,883)
Other Northern Europe
Harvard:
1.6% (12)
Massachusetts:
0.4% (3,051)
Syria
Harvard:
1.6% (12)
Massachusetts:
0.3% (2,084)
Place of birth for U.S.-born residents:
This state: 2,843
Other state: 2,255
Northeast: 1,360
Midwest: 395
South: 330
West: 170
64% of Harvard residents lived in the same house 5 years ago. Out of people who lived in different houses, 21% lived in this county. Out of people who lived in different counties, 55% lived in Massachusetts.
Education attainment for males 25 years and older:
No schooling: 35
Nursery to 4th grade: 0
5th and 6th grade: 18
7th and 8th grade: 30
9th grade: 52
10th grade: 43
11th grade: 26
12th grade, no diploma: 102
High school graduate (or equivalency): 319
Less than 1 year of college: 92
Some college more than 1 year, no degree: 191
Associate degree: 65
Bachelor's degree: 598
Master's degree: 503
Professional school degree: 78
Doctorate degree: 177
Education attainment for females 25 years and older: