Haledon, NJ (New Jersey) Houses and Residents
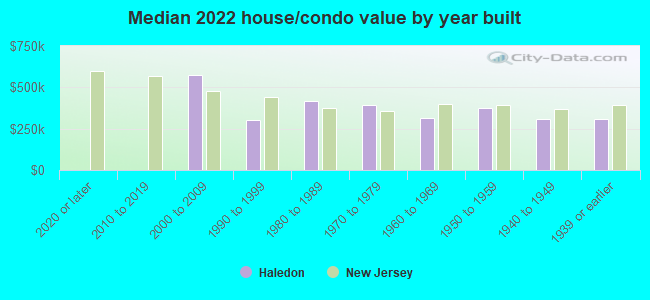
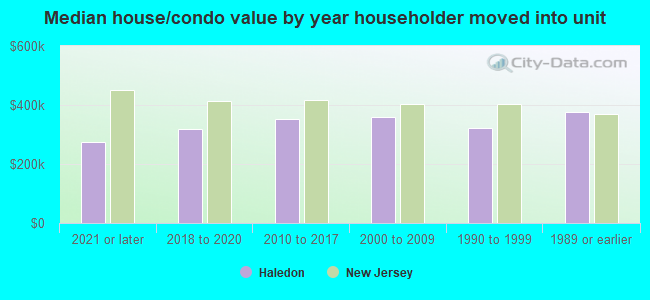
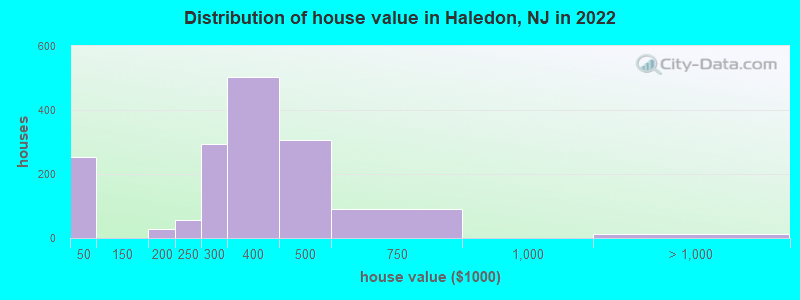
Estimated median house or condo value in 2022: $346,734 (it was $170,100 in 2000 )
Haledon:
$346,734New Jersey:
$428,900
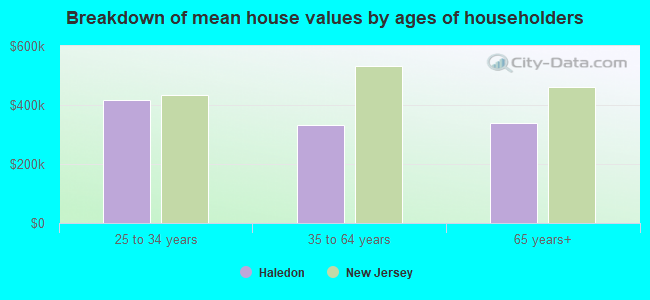
Lower value quartile - upper value quartile: $276,814 - $441,243Mean price in 2022: Detached houses: $367,790 Here:
$367,790State:
$537,591
Townhouses or other attached units: $2,022,618 Here:
$2,022,618State:
$381,113
In 2-unit structures: $427,647 Here:
$427,647State:
$444,476
In 3-to-4-unit structures: $386,635 Here:
$386,635State:
$457,463
In 5-or-more-unit structures: $263,072 Here:
$263,072State:
$368,745
Total population: 8,471 (Urban population: 8,252, Rural population: 0)
Houses: 3,282 (3,203 occupied: 1,600 owner occupied, 1,628 renter occupied )
% of renters here:
50%State:
35%
Housing density: 2,828 houses/condos per square mile
Median price asked for vacant for-sale houses and condos in 2022 in this county: $113,595.
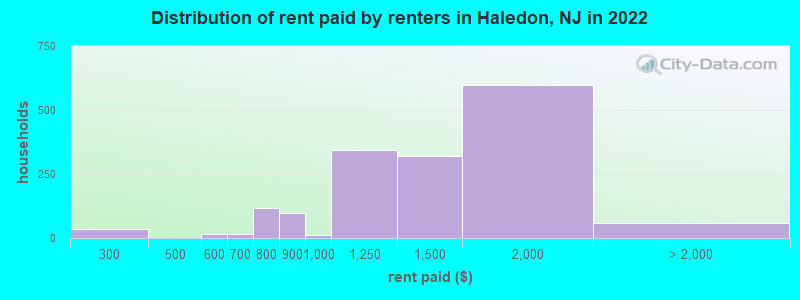
Median contract rent in 2022: $1,341 (lower quartile is $1,044, upper quartile is $1,659)
Median rent asked for vacant for-rent units in 2022: $1,155
Median gross rent in Haledon, NJ in 2022: $1,558
Housing units in Haledon with a mortgage: 1,153 (106 second mortgage, 0 home equity loan, 108 both second mortgage and home equity loan )Houses without a mortgage: 153
Median household income for houses/condos with a mortgage: $126,318
Median household income for apartments without a mortgage: $98,324
Median monthly housing costs: $1,651
Data:
Median house or condo value ($)
Median house or condo value ($ change since 2000)
Median house or condo value ($) - White
Median house or condo value ($) - Black or African American
Median house or condo value ($) - Asian
Median house or condo value ($) - Hispanic or Latino
Median house or condo value ($) - American Indian and Alaska Native
Median house or condo value ($) - Multirace
Median house or condo value ($) - Other Race
Median price asked for mobile homes ($)
Household density (households per square mile)
Mean house or condo value by units in structure - 1, detached ($)
Mean house or condo value by units in structure - 1, attached ($)
Mean house or condo value by units in structure - 2 ($)
Mean house or condo value by units in structure by units in structure - 3 or 4 ($)
Mean house or condo value by units in structure - 5 or more ($)
Mean house or condo value by units in structure - Boat, RV, van, etc. ($)
Mean house or condo value by units in structure - Mobile home ($)
Median contract rent ($)
Median contract rent - Lower quartile ($)
Median contract rent - Upper quartile ($)
Median gross rent ($)
Urban houses (%)
Rural houses (%)
Houses occupied (%)
Houses occupied (% change since 2000)
Houses owner occupied (%)
Houses owner occupied (% change since 2000)
Houses renter occupied (%)
Houses renter occupied (% change since 2000)
Vacant housing units - For rent (%)
Vacant housing units - For rent (% change since 2000)
Vacant housing units - For sale only (%)
Vacant housing units - For sale only (% change since 2000)
Vacant housing units - Rented or sold, not occupied (%)
Vacant housing units - Rented or sold, not occupied (% change since 2000)
Vacant housing units - For seasonal, recreational, or occasional use (%)
Vacant housing units - For seasonal, recreational, or occasional use (% change since 2000)
Vacant housing units - For migrant workers (%)
Vacant housing units - For migrant workers (% change since 2000)
Vacant housing units - Other vacant (%)
Vacant housing units - Other vacant (% change since 2000)
Median monthly housing costs ($)
Median household income for houses/condos with a mortgage ($)
Median household income for houses/condos without a mortgage ($)
Median household income ($)
Median household income ($) - White
Median household income ($) - Black or African American
Median household income ($) - Asian
Median household income ($) - Hispanic or Latino
Median household income ($) - American Indian and Alaska Native
Median household income ($) - Multirace
Median household income ($) - Other Race
Mortgage status - with mortgage (%)
Mortgage status - with second mortgage (%)
Mortgage status - with home equity loan (%)
Mortgage status - with both second mortgage and home equity loan (%)
Mortgage status - without a mortgage (%)
Median year house/condo built
Median year apartment built
Household type by relationship - Male householder living alone (%)
Household type by relationship - Male householder not living alone (%)
Household type by relationship - Female householder living alone (%)
Household type by relationship - Female householder not living alone (%)
Household type by relationship - Opposite-Sex spouse (%)
Household type by relationship - Same-Sex spouse (%)
Household type by relationship - Opposite-Sex unmarried partner (%)
Household type by relationship - Same-Sex unmarried partner (%)
Household type by relationship - In group quarters (%)
Size of family households - 2-person household (%)
Size of family households - 3-person household (%)
Size of family households - 4-person household (%)
Size of family households - 5-person household (%)
Size of family households - 6-person household (%)
Size of family households - 7-or-more-person household (%)
Size of nonfamily households - 1-person household (%)
Size of nonfamily households - 2-person household (%)
Size of nonfamily households - 3-person household (%)
Size of nonfamily households - 4-person household (%)
Size of nonfamily households - 5-person household (%)
Size of nonfamily households - 6-person household (%)
Size of nonfamily households - 7-or-moreperson household (%)
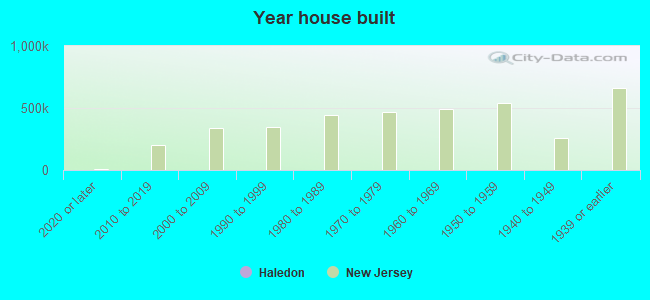
Year house built - Built 2010 or later (%)
Year house built - Built 2000 to 2009 (%)
Year house built - Built 1990 to 1999 (%)
Year house built - Built 1980 to 1989 (%)
Year house built - Built 1970 to 1979 (%)
Year house built - Built 1960 to 1969 (%)
Year house built - Built 1950 to 1959 (%)
Year house built - Built 1940 to 1949 (%)
Year house built - Built 1939 or earlier (%)
Median number of rooms in houses and condos
Median number of rooms in apartments
Median number of bedrooms in owner occupied houses
Mean number of bedrooms in owner occupied houses
Median number of bedrooms in renter occupied houses
Mean number of bedrooms in renter occupied houses
Median number of vehichles in owner occupied houses
Mean number of vehichles in owner occupied houses
Median number of vehichles in renter occupied houses
Mean number of vehichles in renter occupied houses
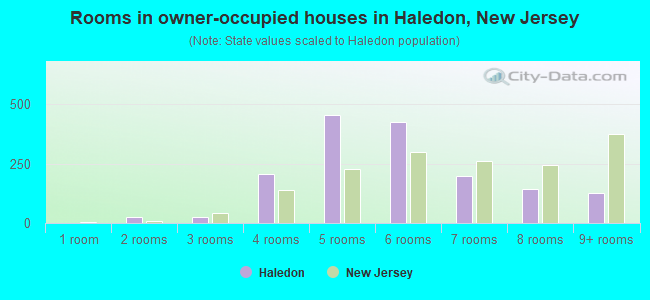
Rooms in owner-occupied houses - 1 room (%)
Rooms in owner-occupied houses - 2 rooms (%)
Rooms in owner-occupied houses - 3 rooms (%)
Rooms in owner-occupied houses - 4 rooms (%)
Rooms in owner-occupied houses - 5 rooms (%)
Rooms in owner-occupied houses - 6 rooms (%)
Rooms in owner-occupied houses - 7 rooms (%)
Rooms in owner-occupied houses - 8 rooms (%)
Rooms in owner-occupied houses - 9+ rooms (%)
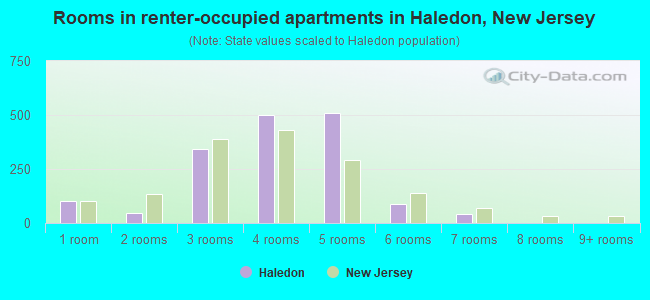
Rooms in renter-occupied houses - 1 room (%)
Rooms in renter-occupied houses - 2 rooms (%)
Rooms in renter-occupied houses - 3 rooms (%)
Rooms in renter-occupied houses - 4 rooms (%)
Rooms in renter-occupied houses - 5 rooms (%)
Rooms in renter-occupied houses - 6 rooms (%)
Rooms in renter-occupied houses - 7 rooms (%)
Rooms in renter-occupied houses - 8 rooms (%)
Rooms in renter-occupied houses - 9+ rooms (%)
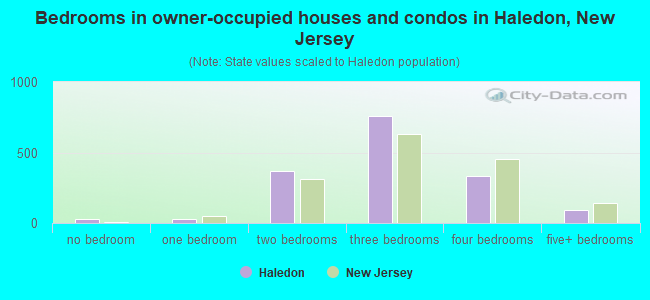
Bedrooms in owner-occupied houses - no bedrooms (%)
Bedrooms in owner-occupied houses - 1 bedroom (%)
Bedrooms in owner-occupied houses - 2 bedrooms (%)
Bedrooms in owner-occupied houses - 3 bedrooms (%)
Bedrooms in owner-occupied houses - 4 bedrooms (%)
Bedrooms in owner-occupied houses - 5+ bedrooms (%)
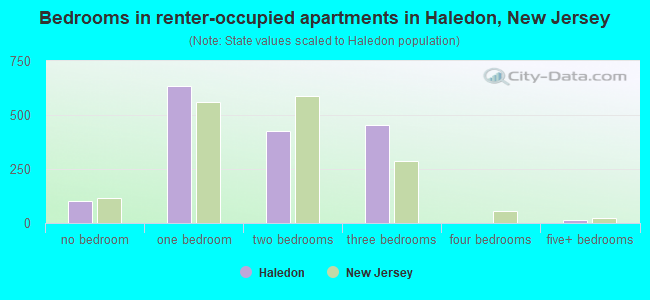
Bedrooms in renter-occupied houses - no bedrooms (%)
Bedrooms in renter-occupied houses - 1 bedroom (%)
Bedrooms in renter-occupied houses - 2 bedrooms (%)
Bedrooms in renter-occupied houses - 3 bedrooms (%)
Bedrooms in renter-occupied houses - 4 bedrooms (%)
Bedrooms in renter-occupied houses - 5+ bedrooms (%)
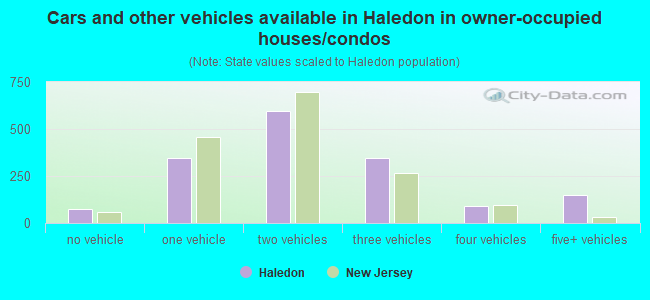
Vehicles available in owner-occupied houses - no vehicle available (%)
Vehicles available in owner-occupied houses - 1 vehicle available(%)
Vehicles available in owner-occupied houses - 2 Vehicles available (%)
Vehicles available in owner-occupied houses - 3 Vehicles available (%)
Vehicles available in owner-occupied houses - 4 Vehicles available (%)
Vehicles available in owner-occupied houses - 5+ Vehicles available (%)
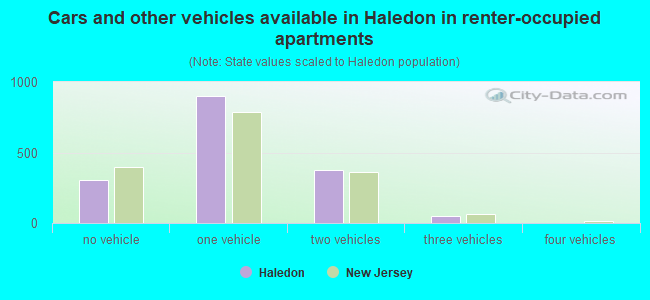
Vehicles available in renter-occupied houses - no vehicle available (%)
Vehicles available in renter-occupied houses - 1 vehicle available (%)
Vehicles available in renter-occupied houses - 2 Vehicles available (%)
Vehicles available in renter-occupied houses - 3 Vehicles available (%)
Vehicles available in renter-occupied houses - 4 Vehicles available (%)
Vehicles available in renter-occupied houses - 5+ Vehicles available (%)
Housing units in structures - 1, detached (%)
Housing units in structures - 1, attached (%)
Housing units in structures - 2 (%)
Housing units in structures - 3 or 4 (%)
Housing units in structures - 5 to 9 (%)
Housing units in structures - 10 to 19 (%)
Housing units in structures - 20 to 49 (%)
Housing units in structures - 50 or more (%)
Housing units in structures - Mobile home (%)
Housing units in structures - Boat, RV, van, etc. (%)
Housing units in structures - Owners - 1, detached (%)
Housing units in structures - Owners - 1, attached (%)
Housing units in structures - Owners - 2 (%)
Housing units in structures - Owners - 3 or 4 (%)
Housing units in structures - Owners - 5 to 9 (%)
Housing units in structures - Owners - 10 to 19 (%)
Housing units in structures - Owners - 20 to 49 (%)
Housing units in structures - Owners - 50 or more (%)
Housing units in structures - Owners - Mobile home (%)
Housing units in structures - Owners - Boat, RV, van, etc. (%)
Housing units in structures - Renters - 1, detached (%)
Housing units in structures - Renters - 1, attached (%)
Housing units in structures - Renters - 2 (%)
Housing units in structures - Renters - 3 or 4 (%)
Housing units in structures - Renters - 5 to 9 (%)
Housing units in structures - Renters - 10 to 19 (%)
Housing units in structures - Renters - 20 to 49 (%)
Housing units in structures - Renters - 50 or more (%)
Housing units in structures - Renters - Mobile home (%)
Housing units in structures - Renters - Boat, RV, van, etc. (%)
House/condo owner moved in on average (years ago)
Renter moved in on average (years ago)
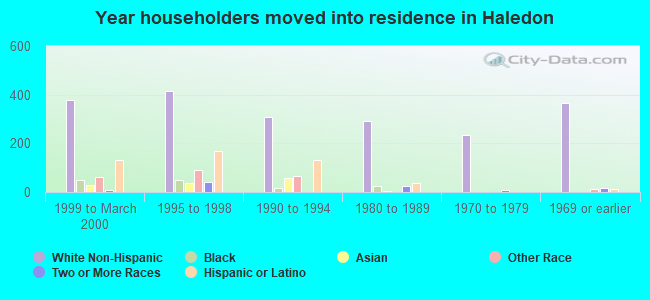
Year householder moved into unit - Moved in 1999 to March 2000 (%)
Year householder moved into unit - Moved in 1999 to March 2000 (%) - White
Year householder moved into unit - Moved in 1999 to March 2000 (%) - Black or African American
Year householder moved into unit - Moved in 1999 to March 2000 (%) - Asian
Year householder moved into unit - Moved in 1999 to March 2000 (%) - Hispanic or Latino
Year householder moved into unit - Moved in 1999 to March 2000 (%) - American Indian and Alaska Native
Year householder moved into unit - Moved in 1999 to March 2000 (%) - Multirace
Year householder moved into unit - Moved in 1999 to March 2000 (%) - Other Race
Year householder moved into unit - Moved in 1995 to 1998 (%)
Year householder moved into unit - Moved in 1995 to 1998 (%) - White
Year householder moved into unit - Moved in 1995 to 1998 (%) - Black or African American
Year householder moved into unit - Moved in 1995 to 1998 (%) - Asian
Year householder moved into unit - Moved in 1995 to 1998 (%) - Hispanic or Latino
Year householder moved into unit - Moved in 1995 to 1998 (%) - American Indian and Alaska Native
Year householder moved into unit - Moved in 1995 to 1998 (%) - Multirace
Year householder moved into unit - Moved in 1995 to 1998 (%) - Other Race
Year householder moved into unit - Moved in 1990 to 1994 (%)
Year householder moved into unit - Moved in 1990 to 1994 (%) - White
Year householder moved into unit - Moved in 1990 to 1994 (%) - Black or African American
Year householder moved into unit - Moved in 1990 to 1994 (%) - Asian
Year householder moved into unit - Moved in 1990 to 1994 (%) - Hispanic or Latino
Year householder moved into unit - Moved in 1990 to 1994 (%) - American Indian and Alaska Native
Year householder moved into unit - Moved in 1990 to 1994 (%) - Multirace
Year householder moved into unit - Moved in 1990 to 1994 (%) - Other Race
Year householder moved into unit - Moved in 1980 to 1989 (%)
Year householder moved into unit - Moved in 1980 to 1989 (%) - White
Year householder moved into unit - Moved in 1980 to 1989 (%) - Black or African American
Year householder moved into unit - Moved in 1980 to 1989 (%) - Asian
Year householder moved into unit - Moved in 1980 to 1989 (%) - Hispanic or Latino
Year householder moved into unit - Moved in 1980 to 1989 (%) - American Indian and Alaska Native
Year householder moved into unit - Moved in 1980 to 1989 (%) - Multirace
Year householder moved into unit - Moved in 1980 to 1989 (%) - Other Race
Year householder moved into unit - Moved in 1970 to 1979 (%)
Year householder moved into unit - Moved in 1970 to 1979 (%) - White
Year householder moved into unit - Moved in 1970 to 1979 (%) - Black or African American
Year householder moved into unit - Moved in 1970 to 1979 (%) - Asian
Year householder moved into unit - Moved in 1970 to 1979 (%) - Hispanic or Latino
Year householder moved into unit - Moved in 1970 to 1979 (%) - American Indian and Alaska Native
Year householder moved into unit - Moved in 1970 to 1979 (%) - Multirace
Year householder moved into unit - Moved in 1970 to 1979 (%) - Other Race
Year householder moved into unit - Moved in 1969 or earlier (%)
Year householder moved into unit - Moved in 1969 or earlier (%) - White
Year householder moved into unit - Moved in 1969 or earlier (%) - Black or African American
Year householder moved into unit - Moved in 1969 or earlier (%) - Asian
Year householder moved into unit - Moved in 1969 or earlier (%) - Hispanic or Latino
Year householder moved into unit - Moved in 1969 or earlier (%) - American Indian and Alaska Native
Year householder moved into unit - Moved in 1969 or earlier (%) - Multirace
Year householder moved into unit - Moved in 1969 or earlier (%) - Other Race
Housing units lacking complete plumbing facilities (%)
Housing units lacking complete kitchen facilities (%)
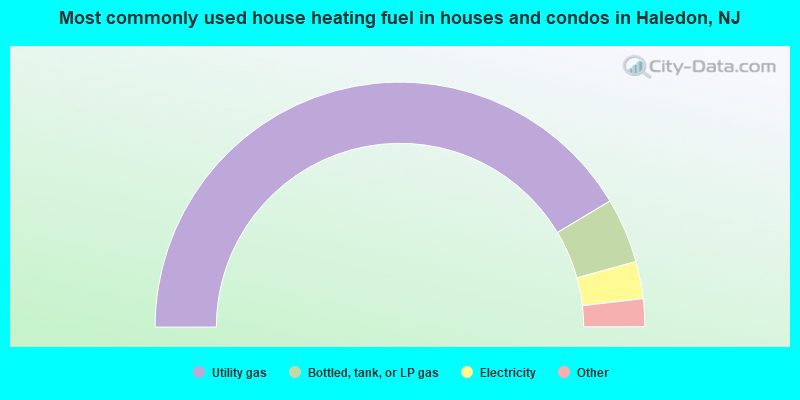
House heating fuel used in houses and condos - Utility gas (%)
House heating fuel used in houses and condos - Bottled, tank, or LP gas (%)
House heating fuel used in houses and condos - Electricity (%)
House heating fuel used in houses and condos - Fuel oil, kerosene, etc. (%)
House heating fuel used in houses and condos - Coal or coke (%)
House heating fuel used in houses and condos - Wood (%)
House heating fuel used in houses and condos - Solar energy (%)
House heating fuel used in houses and condos - Other fuel (%)
House heating fuel used in houses and condos - No fuel used (%)
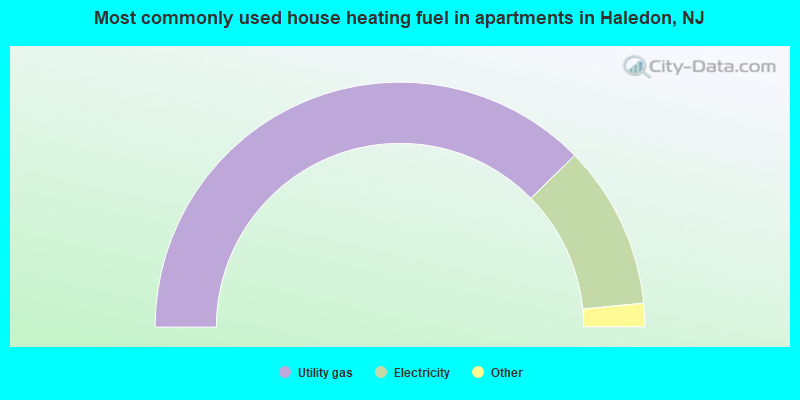
House heating fuel used in apartments - Utility gas (%)
House heating fuel used in apartments - Bottled, tank, or LP gas (%)
House heating fuel used in apartments - Electricity (%)
House heating fuel used in apartments - Fuel oil, kerosene, etc. (%)
House heating fuel used in apartments - Coal or coke (%)
House heating fuel used in apartments - Wood (%)
House heating fuel used in apartments - Solar energy (%)
House heating fuel used in apartments - Other fuel (%)
House heating fuel used in apartments - No fuel used (%)
Latest news about housing in Haledon, NJ collected exclusively by city-data.com from local newspapers, TV, and radio stations
Median year house/condo built: 1957Median year apartment built: 1968Household type by relationship:
Households: 8,840
Male householders: 1,460 (154 living alone ), Female householders: 1,694 (360 living alone )1,389 spouses (1,389 opposite-sex spouses ), 256 unmarried partners , (256 opposite-sex unmarried partners ), 2,772 children (2,746 natural , 25 adopted , 0 stepchildren ), 178 grandchildren , 332 brothers or sisters , 510 parents , 0 foster children , 98 other relatives , 112 non-relatives In group quarters: 33
Size of family households: 783 2-persons , 812 3-persons , 606 4-persons , 181 5-persons , 52 6-persons , 12 7-or-more-persons .
Size of nonfamily households: 608 1-person , 119 2-persons , 14 3-persons .
1,003 married couples with children. single-parent households (153 men , 484 women ).
44.8% of residents of Haledon speak English at home. of residents speak Spanish at home (66% speak English very well , 15% speak English well , 12% speak English not well , 6% don't speak English at all ).of residents speak other Indo-European language at home (48% speak English very well , 36% speak English well , 12% speak English not well , 5% don't speak English at all ).of residents speak Asian or Pacific Island language at home (55% speak English very well , 21% speak English well , 24% speak English not well ).of residents speak other language at home (76% speak English very well , 24% don't speak English at all ).
Foreign born population: 2,766 (31.3%)of them are naturalized citizens )
Median number of rooms in houses and condos:
Median number of rooms in apartments
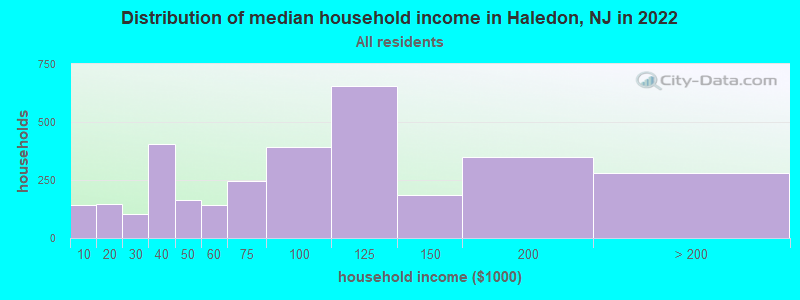
Haledon, NJ household income distribution 144 Less than $10,000146 $10,000 to $19,999104 $20,000 to $29,999406 $30,000 to $39,999165 $40,000 to $49,999143 $50,000 to $59,999244 $60,000 to $74,999391 $75,000 to $99,999656 $100,000 to $124,999187 $125,000 to $149,999351 $150,000 to $199,999281 $200,000 or more
Home value of owner - occupied houses in 2022 in Haledon, NJ 252 Less than $10,00029 $150,000 to $174,99954 $200,000 to $249,999293 $250,000 to $299,999503 $300,000 to $399,999305 $400,000 to $499,99992 $500,000 to $749,99911 $1,500,000 to $1,999,999Rent paid by renters in 2022 in Haledon, NJ 37 $200 to $2498 $500 to $5495 $550 to $59914 $600 to $649116 $750 to $79998 $800 to $89912 $900 to $999345 $1,000 to $1,249320 $1,250 to $1,499596 $1,500 to $1,99914 $2,500 to $2,9994 $3,000 to $3,49940 No cash rent
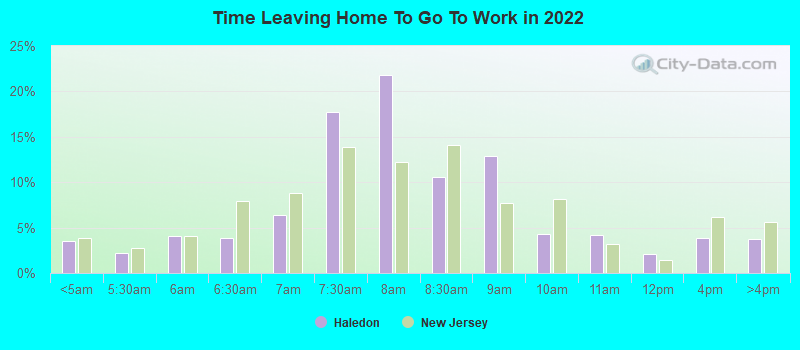
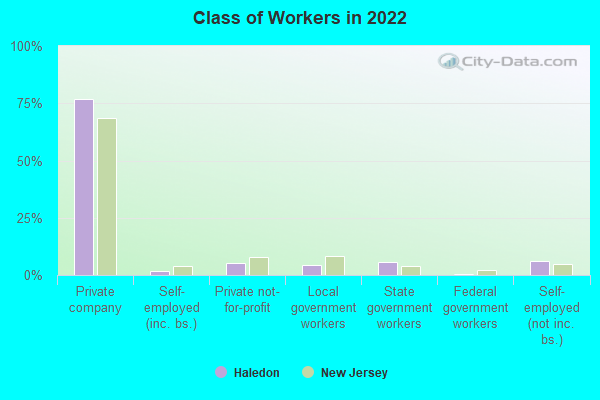
Percentage of workers working in this county: 60.8%Number of people working at home: 476 (10.2% of all workers )
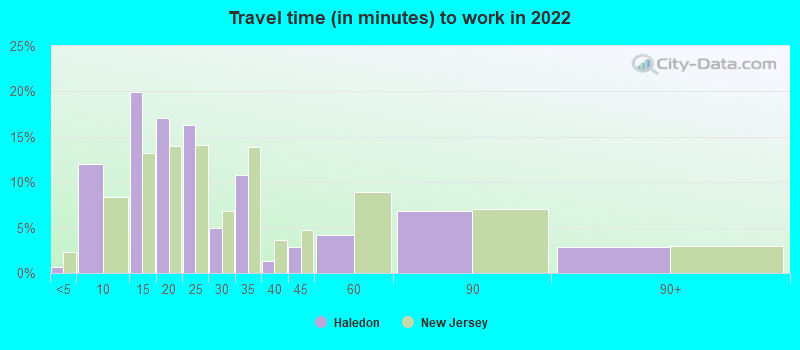
Travel time to work (commute)
Less than 5 minutes: 245 to 9 minutes: 27610 to 14 minutes: 35015 to 19 minutes: 96720 to 24 minutes: 77025 to 29 minutes: 51830 to 34 minutes: 35135 to 39 minutes: 20540 to 44 minutes: 5845 to 59 minutes: 31460 to 89 minutes: 16990 or more minutes: 152
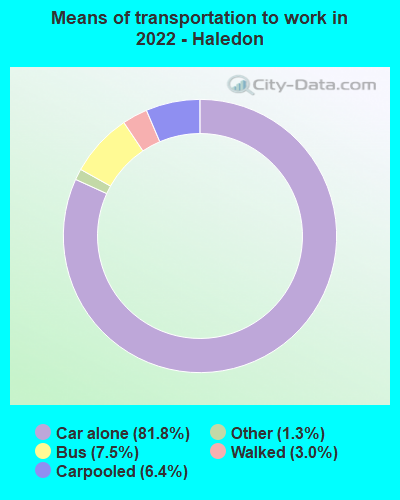
Means of transportation to work:
Drove a car alone: 923 (58.4%)Carpooled: 75 (4.7%)Bus : 103 (6.5%)Taxi: 16 (1.0%)Walked: 41 (2.6%)Worked at home: 476 (30.1%)
Unemployment by race in 2022
Unemployment rate for White non-Hispanic residents 2.1% FemalesUnemployment rate for Black residents 22.6% FemalesUnemployment rate for Asian residents 12.0% FemalesUnemployment rate for other race residents 11.0% Males4.7% FemalesUnemployment rate for two or more race residents 1.9% Males14.3% FemalesUnemployment rate for Hispanic or Latino residents 3.6% Males6.4% Females
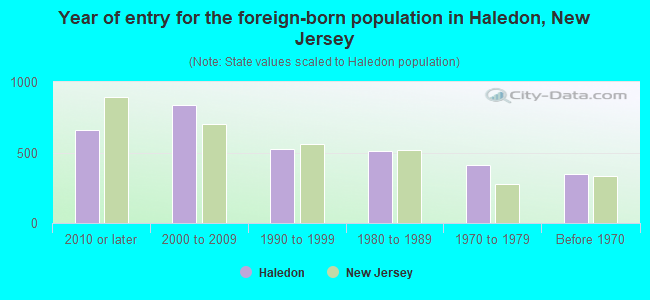
Year of entry for the foreign-born population in Haledon, New Jersey
659 2010 or later 838 2000 to 2009 523 1990 to 1999 509 1980 to 1989 413 1970 to 1979 346 Before 1970
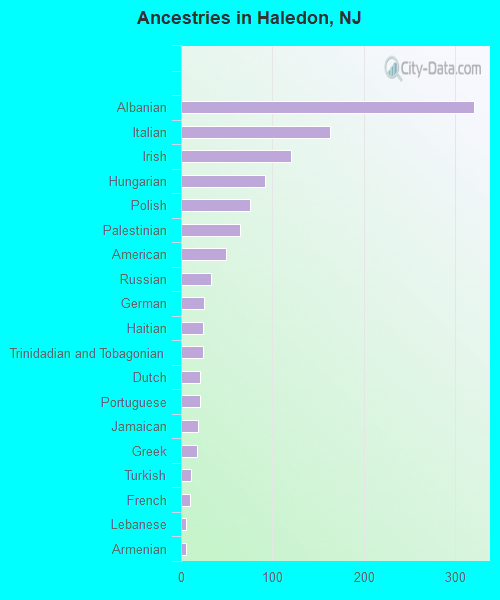
First ancestries reported:
Albanian: 321 (5.6%)
Italian: 163 (2.9%)
Irish: 120 (2.1%)
Hungarian: 92 (1.6%)
Polish: 75 (1.3%)
Palestinian: 65 (1.1%)
American: 49 (0.9%)
Russian: 33 (0.6%)
German: 25 (0.4%)
Haitian: 24 (0.4%)
Trinidadian and Tobagonian: 24 (0.4%)
Dutch: 21 (0.4%)
Portuguese: 21 (0.4%)
Jamaican: 19 (0.3%)
Greek: 18 (0.3%)
Turkish: 11 (0.2%)
French: 10 (0.2%)
Lebanese: 5 (0.09%)
Armenian: 5 (0.09%)
Syrian: 2 (0.04%) Most common places of birth for foreign-born residents (%): Dominican Republic Haledon:
20.9% (608)New Jersey:
9.7% (209,055)
Peru Haledon:
11.7% (341)New Jersey:
2.7% (58,563)
Bolivia Haledon:
8.2% (239)New Jersey:
0.2% (3,252)
Cuba Haledon:
6.7% (194)New Jersey:
2.1% (45,435)
Albania Haledon:
6.3% (183)New Jersey:
0.3% (6,130)
Mexico Haledon:
6.2% (180)New Jersey:
4.8% (102,527)
India Haledon:
6.1% (179)New Jersey:
12.8% (274,609)
Colombia Haledon:
3.9% (115)New Jersey:
4.2% (90,817)
North Macedonia (Macedonia) Haledon:
3.3% (96)New Jersey:
0.2% (5,094)
Asia, n.e.c. Haledon:
3.1% (90)New Jersey:
0.1% (2,620)
Venezuela Haledon:
2.7% (79)New Jersey:
0.6% (12,929)
Poland Haledon:
1.9% (54)New Jersey:
2.3% (48,811)
Argentina Haledon:
1.7% (49)New Jersey:
0.5% (10,607)
Ecuador Haledon:
1.6% (48)New Jersey:
4.4% (95,275)
Jamaica Haledon:
1.5% (45)New Jersey:
2.2% (47,365)
Place of birth for U.S.-born residents:
This state: 4,271Other state: 952Northeast: 521Midwest: 35South: 364West: 40 86.1% of Haledon residents lived in the same house 1 years ago.
Out of people who lived in different houses, 38.9% lived in this county.
Out of people who lived in different counties, 55.4% lived in New Jersey.
Haledon:
86.1%State average:
90.4%
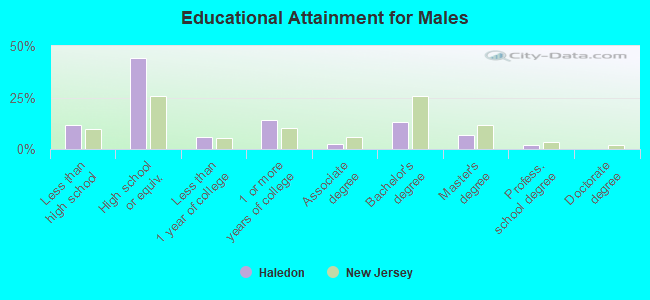
Education attainment for males 25 years and older:
No schooling: 104Nursery to 4th grade: 135th and 6th grade: 137th and 8th grade: 329th grade: 5210th grade: 4811th grade: 1812th grade, no diploma: 84High school graduate (or equivalency): 1,374Less than 1 year of college: 185Some college more than 1 year, no degree: 446Associate degree: 71Bachelor's degree: 404Master's degree: 207Professional school degree: 66Doctorate degree: 0
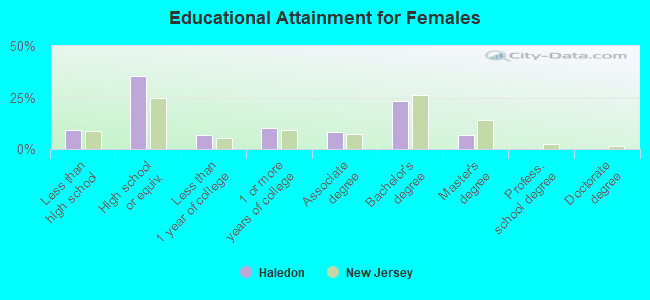
Education attainment for females 25 years and older:
No schooling: 124Nursery to 4th grade: 05th and 6th grade: 467th and 8th grade: 149th grade: 1010th grade: 011th grade: 412th grade, no diploma: 105High school graduate (or equivalency): 1,157Less than 1 year of college: 230Some college more than 1 year, no degree: 340Associate degree: 274Bachelor's degree: 764Master's degree: 219Professional school degree: 0Doctorate degree: 0
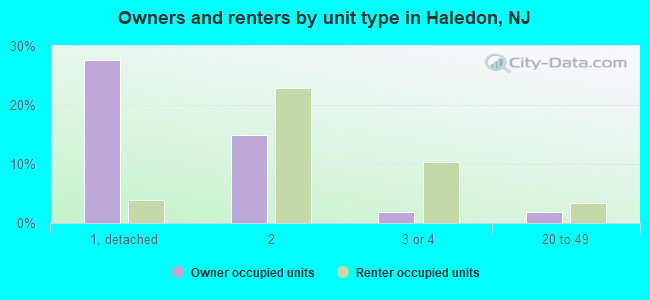
Housing units in structures:
One, detached: 1,122One, attached: 189Two: 1,2493 or 4: 2425 to 9: 7010 to 19: 9120 to 49: 19850 or more: 118Housing units lacking complete plumbing facilities in 2022: 0.4%Housing units lacking complete kitchen facilities in 2022: 0.4%House/condo owner moved in on average 14 years ago
Renter moved in on average 5 years ago
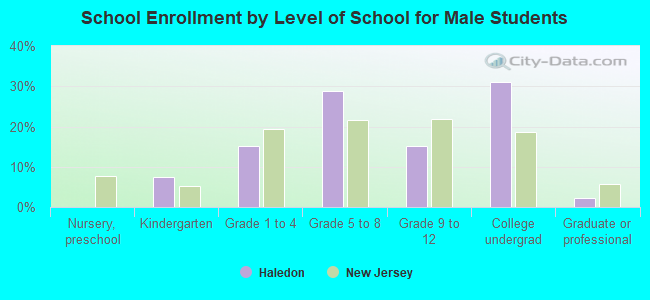
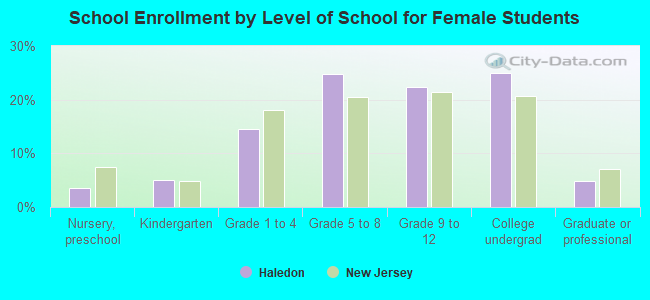
Private vs. public school enrollment:
Students in private schools in grades 1 to 8 (elementary and middle school): 9 Here:
1.1%New Jersey:
12.3%
Students in private schools in grades 9 to 12 (high school): 18 Here:
4.7%New Jersey:
13.1%
Students in private undergraduate colleges: 258 Here:
43.5%New Jersey:
33.2%