Housing density: 1,910 houses/condos per square mile
Median price asked for vacant for-sale houses and condos in 2022 in this county: $157,543.
Median contract rent in 2022: $1,697 (lower quartile is $1,191, upper quartile is over $2,000)
Median rent asked for vacant for-rent units in 2022: $1,861
Median gross rent in Green Haven, MD in 2022: $1,886
Housing units in Green Haven with a mortgage: 4,241 (615 second mortgage, 541 home equity loan, 26 both second mortgage and home equity loan) Houses without a mortgage: 574
Compare current foreclosures near Green Haven, MD:
In family households: 446,432 (97,396 male householders, 41,866 female householders)
105,955 spouses, 153,971 children (143,390 natural, 3,378 adopted, 7,203 stepchildren), 11,866 grandchildren, 5,147 brothers or sisters, 5,066 parents, foster children, 7,373 other relatives, 13,819 non-relatives
In nonfamily households: 77,091 (27,830 male householders (20,470 living alone)), 32,286 female householders (26,725 living alone)), 16,975 nonrelatives
In group quarters: 14,133 (7,339 institutionalized population)
87,003 married couples with children.
24,525 single-parent households (5,795 men, 18,730 women).
95.7% of residents of Green Haven speak English at home.
1.8% of residents speak Spanish at home (72% speak English very well, 10% speak English well, 18% speak English not well).
1.3% of residents speak other Indo-European language at home (81% speak English very well, 6% speak English well, 13% speak English not well).
1.2% of residents speak Asian or Pacific Island language at home (61% speak English very well, 25% speak English well, 14% speak English not well).
Foreign born population: 556 (2.6%)
(63.7% of them are naturalized citizens)
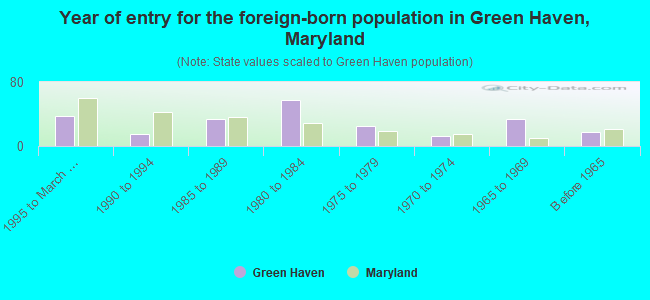
Year of entry for the foreign-born population in Green Haven, Maryland
381995 to March 2000
151990 to 1994
341985 to 1989
571980 to 1984
251975 to 1979
121970 to 1974
341965 to 1969
17Before 1965
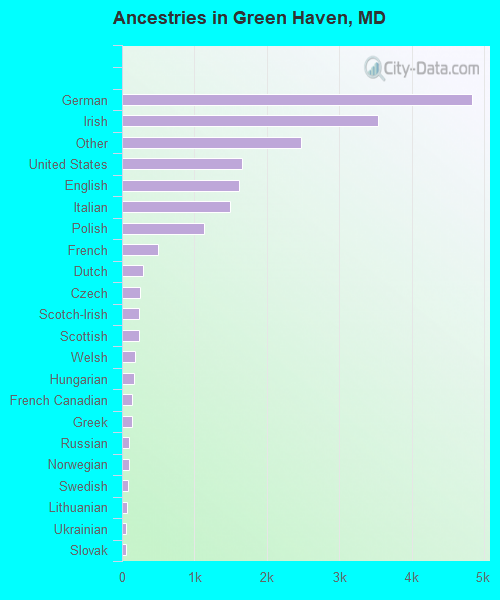
First ancestries reported:
German: 4,828 (24.8%)
Irish: 3,541 (18.2%)
Other: 2,476 (12.7%)
United States: 1,662 (8.5%)
English: 1,616 (8.3%)
Italian: 1,490 (7.7%)
Polish: 1,129 (5.8%)
French: 494 (2.5%)
Dutch: 291 (1.5%)
Czech: 242 (1.2%)
Scotch-Irish: 241 (1.2%)
Scottish: 240 (1.2%)
Welsh: 184 (0.9%)
Hungarian: 159 (0.8%)
French Canadian: 141 (0.7%)
Greek: 138 (0.7%)
Russian: 98 (0.5%)
Norwegian: 95 (0.5%)
Swedish: 80 (0.4%)
Lithuanian: 72 (0.4%)
Ukrainian: 59 (0.3%)
Slovak: 54 (0.3%)
Subsaharan African: 43 (0.2%)
Arab: 35 (0.2%)
Swiss: 33 (0.2%)
West Indian: 20 (0.1%)
Most common places of birth for foreign-born residents (%):
Korea
Green Haven:
21.6% (50)
Maryland:
6.0% (31,249)
Mexico
Green Haven:
9.1% (21)
Maryland:
3.7% (19,287)
Taiwan
Green Haven:
7.8% (18)
Maryland:
1.5% (7,928)
Philippines
Green Haven:
7.3% (17)
Maryland:
4.1% (21,007)
United Kingdom
Green Haven:
6.9% (16)
Maryland:
2.7% (14,206)
Japan
Green Haven:
5.6% (13)
Maryland:
1.0% (5,354)
Germany
Green Haven:
5.2% (12)
Maryland:
2.8% (14,555)
Spain
Green Haven:
4.7% (11)
Maryland:
0.4% (1,949)
Trinidad and Tobago
Green Haven:
4.7% (11)
Maryland:
2.1% (11,050)
Melanesia
Green Haven:
3.4% (8)
Maryland:
0.0% (127)
Jamaica
Green Haven:
3.4% (8)
Maryland:
3.7% (18,988)
Guatemala
Green Haven:
3.4% (8)
Maryland:
2.0% (10,309)
Panama
Green Haven:
3.4% (8)
Maryland:
0.5% (2,850)
Pakistan
Green Haven:
3.0% (7)
Maryland:
1.4% (7,183)
Dominican Republic
Green Haven:
3.0% (7)
Maryland:
1.0% (5,419)
Egypt
Green Haven:
2.6% (6)
Maryland:
0.5% (2,477)
Africa, n.e.c.
Green Haven:
2.6% (6)
Maryland:
0.5% (2,804)
Canada
Green Haven:
2.2% (5)
Maryland:
1.7% (9,019)
Place of birth for U.S.-born residents:
This state: 12,547
Other state: 4,264
Northeast: 1,517
Midwest: 543
South: 1,675
West: 529
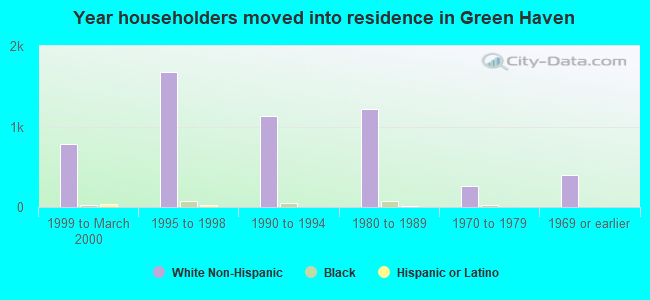
58% of Green Haven residents lived in the same house 5 years ago. Out of people who lived in different houses, 61% lived in this county. Out of people who lived in different counties, 65% lived in Maryland.
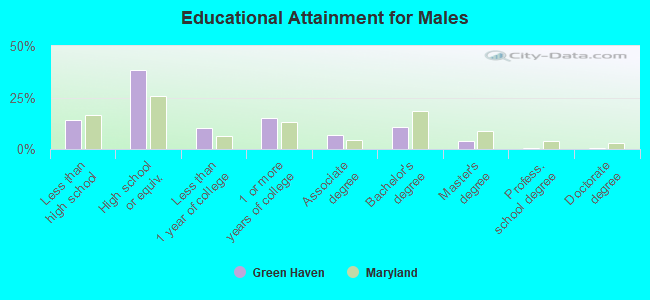
Education attainment for males 25 years and older:
No schooling: 18
Nursery to 4th grade: 0
5th and 6th grade: 81
7th and 8th grade: 96
9th grade: 93
10th grade: 90
11th grade: 149
12th grade, no diploma: 212
High school graduate (or equivalency): 2,000
Less than 1 year of college: 524
Some college more than 1 year, no degree: 793
Associate degree: 344
Bachelor's degree: 551
Master's degree: 206
Professional school degree: 15
Doctorate degree: 29
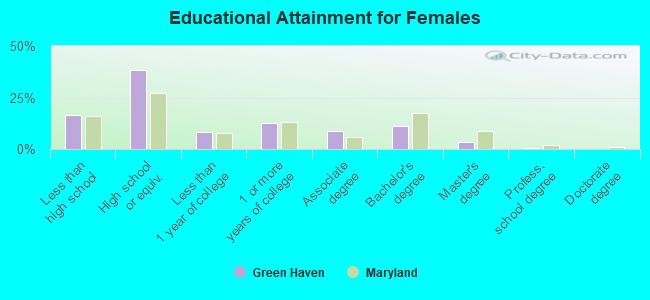
Education attainment for females 25 years and older:
No schooling: 13
Nursery to 4th grade: 0
5th and 6th grade: 23
7th and 8th grade: 200
9th grade: 115
10th grade: 184
11th grade: 226
12th grade, no diploma: 149
High school graduate (or equivalency): 2,152
Less than 1 year of college: 474
Some college more than 1 year, no degree: 711
Associate degree: 498
Bachelor's degree: 616
Master's degree: 188
Professional school degree: 26
Doctorate degree: 5
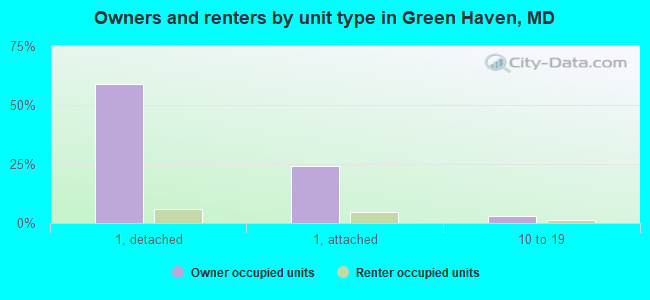
Housing units in structures:
One, detached: 3,964
One, attached: 1,727
Two: 27
3 or 4: 23
5 to 9: 62
10 to 19: 277
Mobile homes: 9
Median worth of mobile homes: $25,203
Housing units lacking complete plumbing facilities: 0.5%
Housing units lacking complete kitchen facilities: 0.7%