Greater Landover, MD (Maryland) Houses and Residents
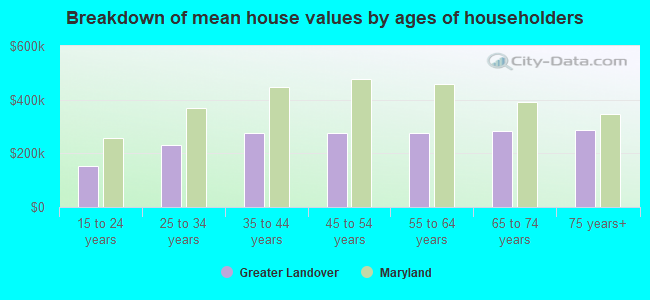
| Greater Landover: | $267,863 |
| Maryland: | $398,100 |
Total population: 23,741 (Urban population: 22,807, Rural population: 0)
Houses: 8,554 (7,663 occupied: 3,667 owner occupied, 3,996 renter occupied)
| % of renters here: | 52% |
| State: | 32% |
Housing density: 2,077 houses/condos per square mile
Median price asked for vacant for-sale houses and condos in 2022 in this county: $422,373.
Median contract rent in 2022: $1,378 (lower quartile is $1,194, upper quartile is $1,660)
Median rent asked for vacant for-rent units in 2022: $1,252
Median gross rent in Greater Landover, MD in 2022: $1,591
Housing units in Greater Landover with a mortgage: 2,964 (351 second mortgage, 230 home equity loan, 14 both second mortgage and home equity loan)
Houses without a mortgage: 561
Compare current foreclosures near Greater Landover, MD:
| Photo | Address | Area | Beds / Baths | Price | Details |
|---|---|---|---|---|---|

|
#1
Trubador Dr
Clinton, MD 20735
|
1,144 sq. feet
|
3 baths 4 beds |
$481,500
|
show details |

|
#2
Fitzgibbon Ct
Bowie, MD 20721
|
1,300 sq. feet
|
2 baths 3 beds |
$369,200
|
show details |

|
#3
24th Pl
Hyattsville, MD 20782
|
1,216 sq. feet
|
1 baths 3 beds |
$289,900
|
show details |

|
#4
3rd St
Lanham, MD 20706
|
1,104 sq. feet
|
2 baths 3 beds |
$369,200
|
show details |

|
#5
Heming Ln
Bowie, MD 20716
|
1,800 sq. feet
|
2 baths 3 beds |
$400,000
|
show details |

|
#6
23rd Pl
Hyattsville, MD 20783
|
1,188 sq. feet
|
2 baths 4 beds |
$379,600
|
show details |

|
#7
Carousel Ct
Upper Marlboro, MD 20772
|
2,112 sq. feet
|
2 baths 3 beds |
$385,000
|
show details |

|
#8
Applegarth Pl
Capitol Heights, MD 20743
|
1,200 sq. feet
|
1 baths 3 beds |
$314,900
|
show details |

|
#9
Henson Ln
Temple Hills, MD 20748
|
1,566 sq. feet
|
2 baths 3 beds |
$300,000
|
show details |

|
#10
Interlachen Dr Apt 111
Silver Spring, MD 20906
|
965 sq. feet
|
1 baths 2 beds |
$148,000
|
show details |
| Photo | Address | Area | Beds / Baths | Price | Details |
|---|---|---|---|---|---|

|
#11
Pickett Dr
Suitland, MD 20746
|
1,296 sq. feet
|
1 baths 2 beds |
$335,000
|
show details |

|
#12
Buchanan St NE
Washington, DC 20017
|
1,240 sq. feet
|
2 baths 3 beds |
$325,000
|
show details |

|
#13
S Leisure World Blvd # 29-1d
Silver Spring, MD 20906
|
990 sq. feet
|
1 baths 1 beds |
$129,900
|
show details |

|
#14
17th St NW Apt 504
Washington, DC 20009
|
800 sq. feet
|
1 baths 1 beds |
$395,000
|
show details |

|
#15
Old Fort Rd
Fort Washington, MD 20744
|
721 sq. feet
|
1 baths 2 beds |
$179,900
|
show details |

|
#16
Pooks Hill Rd Apt 1612s
Bethesda, MD 20814
|
1,250 sq. feet
|
1 baths 2 beds |
$289,000
|
show details |

|
#17
Elkhorn Ln
Bowie, MD 20716
|
1,514 sq. feet
|
2 baths 3 beds |
$415,000
|
show details |

|
#18
Cathedral Ave NW Apt 108
Washington, DC 20016
|
765 sq. feet
|
1 baths 1 beds |
$259,900
|
show details |

|
#19
Rolling Meadows Rd
Upper Marlboro, MD 20772
|
2,459 sq. feet
|
2 baths 3 beds |
$405,000
|
show details |

|
#20
Crafford Pl
Fort Washington, MD 20744
|
1,890 sq. feet
|
1 baths 3 beds |
$265,900
|
show details |
| Photo | Address | Area | Beds / Baths | Price | Details |
|---|---|---|---|---|---|

|
#21
Delaware Ave SW Apt N720
Washington, DC 20024
|
- sq. feet
|
1 baths 1 beds |
$139,900
|
show details |

|
#22
T St SE Apt 3
Washington, DC 20020
|
- sq. feet
|
2 baths 4 beds |
$307,500
|
show details |

|
#23
Wilson Bridge Dr Unit #6770 A-2
Oxon Hill, MD 20745
|
- sq. feet
|
1 baths 1 beds |
$99,750
|
show details |

|
#24
Snowflower Blvd
Oxon Hill, MD 20745
|
- sq. feet
|
2 baths 3 beds |
$331,760
|
show details |

|
#25
Brooke Ln
Upper Marlboro, MD 20772
|
- sq. feet
|
5 baths 6 beds |
$899,900
|
show details |

|
#26
Yoakum Pkwy Apt 22304
Alexandria, VA 22304
|
1,098 sq. feet
|
2 baths 1 beds |
show details | |

|
#27
Piano Ln
Silver Spring, MD 20904
|
1,377 sq. feet
|
2 baths 3 beds |
show details | |

|
#28
Campus Way S
Upper Marlboro, MD 20774
|
1,428 sq. feet
|
2 baths 3 beds |
show details | |

|
#29
Beechcliff Dr
Alexandria, VA 22306
|
2,365 sq. feet
|
3 baths 3 beds |
show details | |

|
#30
Oglethorpe St Apt 717
Hyattsville, MD 20781
|
888 sq. feet
|
1 baths 2 beds |
show details |
| Photo | Address | Area | Beds / Baths | Price | Details |
|---|---|---|---|---|---|

|
#31
Oakwood St SE Apt B5
Washington, DC 20032
|
628 sq. feet
|
1 baths 1 beds |
show details | |

|
#32
Gunwood Pl
Crofton, MD 21114
|
1,496 sq. feet
|
1 baths 3 beds |
show details | |

|
#33
36th St NE
Washington, DC 20019
|
992 sq. feet
|
1 baths 3 beds |
show details | |

|
#34
Connecticut Ave NW Apt 211
Washington, DC 20008
|
761 sq. feet
|
1 baths 1 beds |
show details | |

|
#35
N Capitol St NE
Washington, DC 20011
|
1,216 sq. feet
|
2 baths 3 beds |
show details | |

|
#36
Upshur St NW
Washington, DC 20011
|
1,352 sq. feet
|
3 baths 3 beds |
show details | |

|
#37
Neal St NE
Washington, DC 20002
|
1,020 sq. feet
|
1 baths 3 beds |
show details | |

|
#38
13th St NE
Washington, DC 20017
|
1,628 sq. feet
|
1 baths 3 beds |
show details | |

|
#39
29th St SE
Washington, DC 20020
|
2,640 sq. feet
|
4 baths 4 beds |
show details | |

|
#40
Talbert St SE # 17a
Washington, DC 20020
|
1,530 sq. feet
|
3 baths 3 beds |
show details |
| Photo | Address | Area | Beds / Baths | Price | Details |
|---|---|---|---|---|---|

|
#41
Eads St NE
Washington, DC 20019
|
1,040 sq. feet
|
1 baths 3 beds |
show details | |

|
#42
Wisconsin Ave NW Apt 614
Washington, DC 20007
|
439 sq. feet
|
1 baths 1 beds |
show details | |

|
#43
Kirby Rd
Mc Lean, VA 22101
|
7,708 sq. feet
|
10 baths 7 beds |
show details | |

|
#44
K St NW
Washington, DC 20001
|
1,360 sq. feet
|
3 baths 4 beds |
show details | |

|
#45
Warner St NW
Washington, DC 20001
|
1,279 sq. feet
|
2 baths 3 beds |
show details | |

|
#46
Pickett Dr
Suitland, MD 20746
|
1,190 sq. feet
|
1 baths 3 beds |
show details | |

|
#47
Upland Ter NW
Washington, DC 20015
|
1,854 sq. feet
|
3 baths 3 beds |
show details | |

|
#48
New Hampshire Ave NW
Washington, DC 20011
|
1,260 sq. feet
|
3 baths 3 beds |
show details | |

|
#49
Ames St NE
Washington, DC 20019
|
1,211 sq. feet
|
2 baths 2 beds |
show details | |

|
Check over 1 million property listings on Foreclosure.com!
|
browse all offers | |||


Household type by relationship:
Households: 844,092- In family households: 710,220 (114,456 male householders, 89,064 female householders)
122,000 spouses, 253,142 children (236,469 natural, 5,681 adopted, 10,992 stepchildren), 29,677 grandchildren, 18,092 brothers or sisters, 12,087 parents, foster children, 29,298 other relatives, 35,579 non-relatives
- In nonfamily households: 133,872 (44,509 male householders (32,938 living alone)), 56,013 female householders (46,437 living alone)), 33,350 nonrelatives
- In group quarters: 19,328 (4,283 institutionalized population)
114,918 married couples with children.
64,724 single-parent households (11,519 men, 53,205 women).
89.9% of residents of Greater Landover speak English at home.
4.3% of residents speak Spanish at home (49% speak English very well, 26% speak English well, 14% speak English not well, 11% don't speak English at all).
1.5% of residents speak other Indo-European language at home (60% speak English very well, 24% speak English well, 17% speak English not well).
0.6% of residents speak Asian or Pacific Island language at home (63% speak English very well, 27% speak English well, 11% speak English not well).
3.7% of residents speak other language at home (57% speak English very well, 30% speak English well, 6% speak English not well, 7% don't speak English at all).
Foreign born population: 4,063 (15.1%)
(28.6% of them are naturalized citizens)
| Here: | 5.2 |
| State: | 7.3 |
| Here: | 4.1 |
| State: | 4.2 |
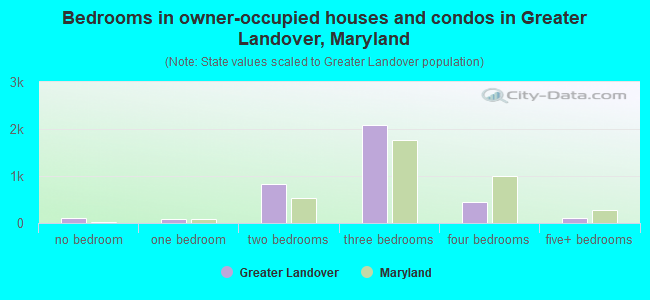
- Bedrooms in owner-occupied houses and condos in Greater Landover, Maryland
- 99no bedroom
- 891 bedroom
- 8262 bedrooms
- 2,0933 bedrooms
- 4444 bedrooms
- 1165+ bedrooms
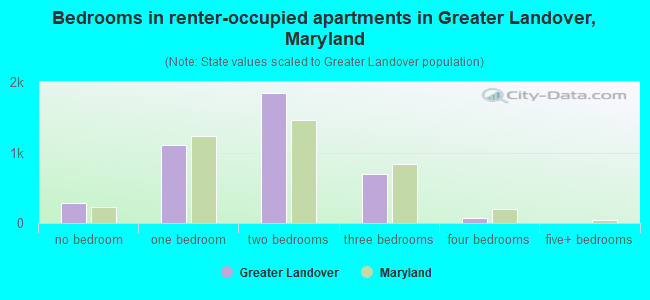
- Bedrooms in renter-occupied apartments in Greater Landover, Maryland
- 277no bedroom
- 1,1081 bedroom
- 1,8482 bedrooms
- 6913 bedrooms
- 674 bedrooms
- 55+ bedrooms
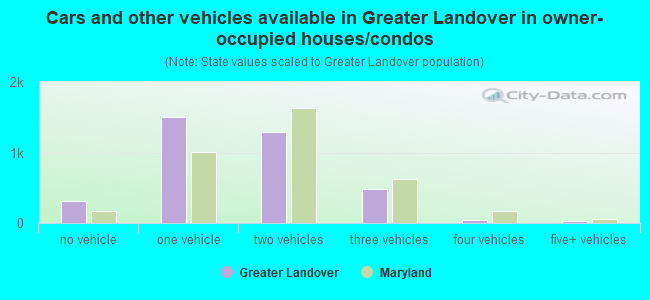
- Cars and other vehicles available in Greater Landover in owner-occupied houses/condos
- 313no vehicle
- 1,4981 vehicle
- 1,2932 vehicles
- 4853 vehicles
- 494 vehicles
- 295+ vehicles
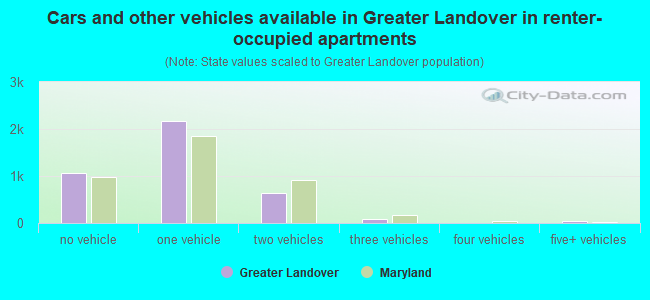
- Cars and other vehicles available in Greater Landover in renter-occupied apartments
- 1,054no vehicle
- 2,1611 vehicle
- 6412 vehicles
- 833 vehicles
- 84 vehicles
- 495+ vehicles
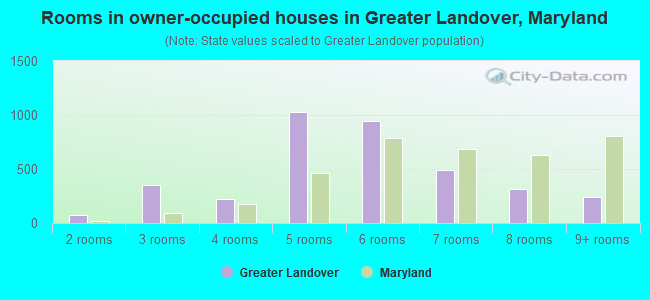
- Rooms in owner-occupied houses in Greater Landover, Maryland
- 51 room
- 782 rooms
- 3513 rooms
- 2254 rooms
- 1,0275 rooms
- 9416 rooms
- 4907 rooms
- 3128 rooms
- 2389+ rooms
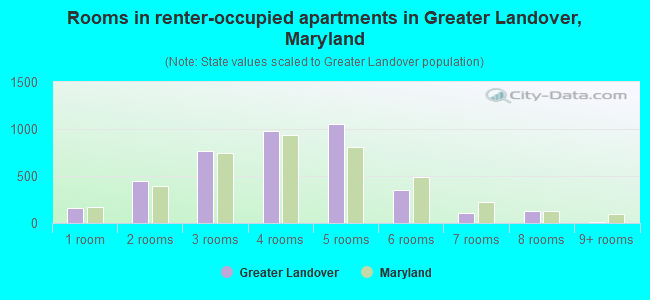
- Rooms in renter-occupied apartments in Greater Landover, Maryland
- 1621 room
- 4472 rooms
- 7703 rooms
- 9764 rooms
- 1,0535 rooms
- 3536 rooms
- 1037 rooms
- 1268 rooms
- 69+ rooms
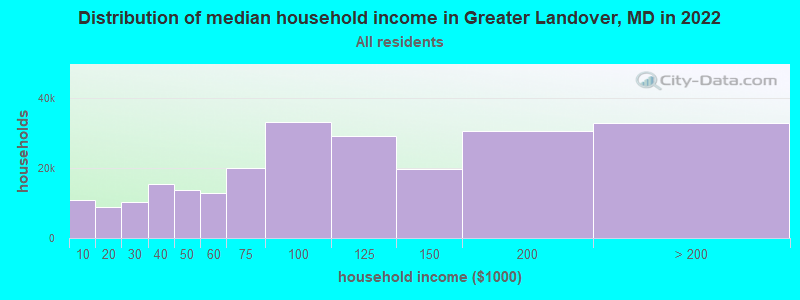
Greater Landover, MD household income distribution

- 10,921Less than $10,000
- 8,965$10,000 to $19,999
- 10,185$20,000 to $29,999
- 15,451$30,000 to $39,999
- 13,705$40,000 to $49,999
- 12,807$50,000 to $59,999
- 19,874$60,000 to $74,999
- 33,128$75,000 to $99,999
- 29,065$100,000 to $124,999
- 19,580$125,000 to $149,999
- 30,526$150,000 to $199,999
- 32,876$200,000 or more
Percentage of workers working in this county: 55.4%
Number of people working at home: 2,037 (17.9% of all workers)
Travel time to work (commute)
- Less than 5 minutes: 122
- 5 to 9 minutes: 443
- 10 to 14 minutes: 565
- 15 to 19 minutes: 1,076
- 20 to 24 minutes: 1,211
- 25 to 29 minutes: 612
- 30 to 34 minutes: 1,658
- 35 to 39 minutes: 266
- 40 to 44 minutes: 415
- 45 to 59 minutes: 1,480
- 60 to 89 minutes: 961
- 90 or more minutes: 333
Means of transportation to work:
- Drove a car alone: 5,221 (56.3%)
- Carpooled: 1,767 (19.1%)
- Bus or trolley bus: 705 (7.6%)
- Subway or elevated: 1,135 (12.2%)
- Railroad: 38 (0.4%)
- Taxi: 50 (0.5%)
- Walked: 177 (1.9%)
- Other means: 49 (0.5%)
- Worked at home: 130 (1.4%)
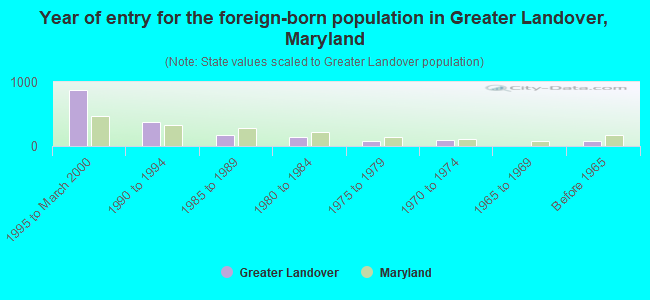
- Year of entry for the foreign-born population in Greater Landover, Maryland
- 8741995 to March 2000
- 3721990 to 1994
- 1741985 to 1989
- 1401980 to 1984
- 771975 to 1979
- 891970 to 1974
- 31965 to 1969
- 71Before 1965
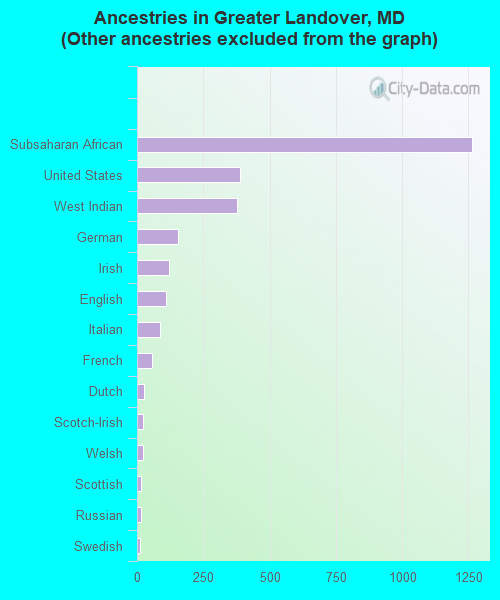
First ancestries reported:
- Other: 17,259 (86.5%)
- Subsaharan African: 1,265 (6.3%)
- United States: 389 (1.9%)
- West Indian: 377 (1.9%)
- German: 153 (0.8%)
- Irish: 119 (0.6%)
- English: 109 (0.5%)
- Italian: 88 (0.4%)
- French: 57 (0.3%)
- Dutch: 28 (0.1%)
- Scotch-Irish: 24 (0.1%)
- Welsh: 23 (0.1%)
- Scottish: 16 (0.08%)
- Russian: 15 (0.08%)
- Swedish: 12 (0.06%)
- Arab: 10 (0.05%)
- Swiss: 7 (0.04%)
- Ukrainian: 7 (0.04%)
Most common places of birth for foreign-born residents (%):
| Greater Landover: | 17.7% (319) |
| Maryland: | 2.9% (15,071) |
| Greater Landover: | 12.1% (217) |
| Maryland: | 1.7% (8,678) |
| Greater Landover: | 9.8% (177) |
| Maryland: | 3.7% (18,988) |
| Greater Landover: | 7.9% (143) |
| Maryland: | 1.4% (7,047) |
| Greater Landover: | 7.9% (142) |
| Maryland: | 8.1% (41,818) |
| Greater Landover: | 6.6% (118) |
| Maryland: | 3.7% (19,287) |
| Greater Landover: | 5.4% (97) |
| Maryland: | 1.0% (5,156) |
| Greater Landover: | 4.9% (89) |
| Maryland: | 1.3% (6,550) |
| Greater Landover: | 4.7% (85) |
| Maryland: | 2.1% (11,050) |
| Greater Landover: | 3.7% (67) |
| Maryland: | 1.2% (6,190) |
| Greater Landover: | 3.7% (66) |
| Maryland: | 0.5% (2,804) |
| Greater Landover: | 1.8% (33) |
| Maryland: | 2.0% (10,309) |
Place of birth for U.S.-born residents:
- This state: 5,856
- Other state: 15,000
- Northeast: 986
- Midwest: 236
- South: 13,213
- West: 565
53% of Greater Landover residents lived in the same house 5 years ago.
Out of people who lived in different houses, 65% lived in this county.
Out of people who lived in different counties, 14% lived in Maryland.
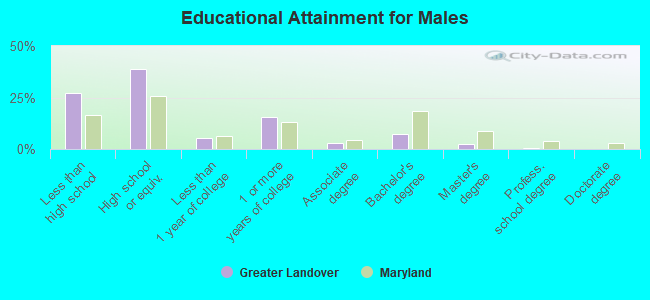
Education attainment for males 25 years and older:
- No schooling: 75
- Nursery to 4th grade: 45
- 5th and 6th grade: 55
- 7th and 8th grade: 192
- 9th grade: 140
- 10th grade: 259
- 11th grade: 286
- 12th grade, no diploma: 468
- High school graduate (or equivalency): 2,167
- Less than 1 year of college: 303
- Some college more than 1 year, no degree: 877
- Associate degree: 158
- Bachelor's degree: 417
- Master's degree: 127
- Professional school degree: 22
- Doctorate degree: 7
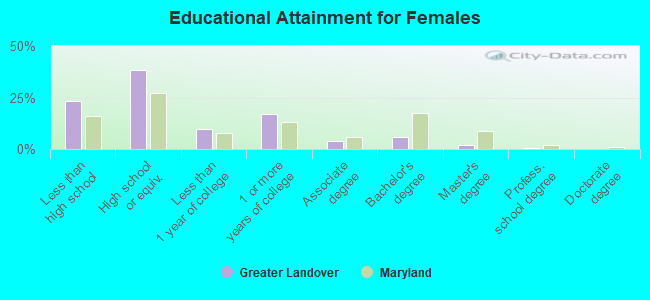
Education attainment for females 25 years and older:
- No schooling: 88
- Nursery to 4th grade: 35
- 5th and 6th grade: 52
- 7th and 8th grade: 178
- 9th grade: 149
- 10th grade: 291
- 11th grade: 408
- 12th grade, no diploma: 489
- High school graduate (or equivalency): 2,809
- Less than 1 year of college: 697
- Some college more than 1 year, no degree: 1,249
- Associate degree: 296
- Bachelor's degree: 421
- Master's degree: 134
- Professional school degree: 18
- Doctorate degree: 9


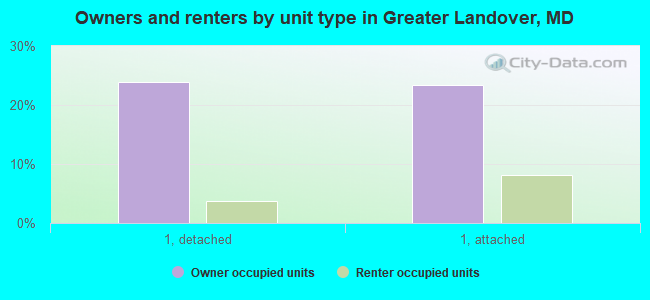
Housing units in structures:
- One, detached: 2,317
- One, attached: 2,676
- Two: 14
- 3 or 4: 200
- 5 to 9: 1,697
- 10 to 19: 1,358
- 20 to 49: 188
- 50 or more: 102
- Mobile homes: 2
Median worth of mobile homes: $37,125
Housing units lacking complete kitchen facilities: 1.3%
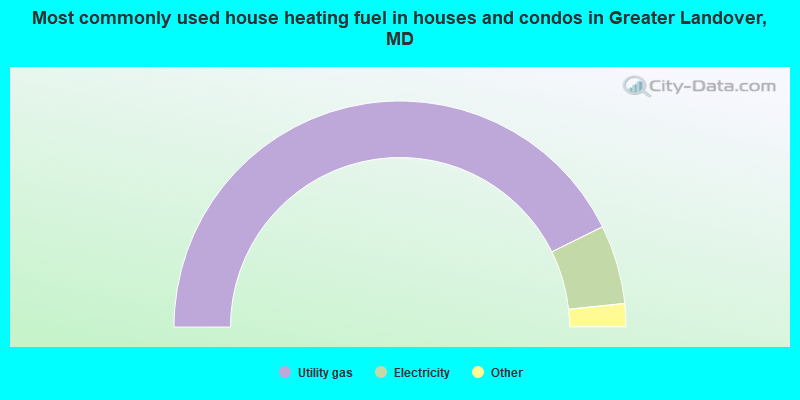
- 85.4%Utility gas
- 11.3%Electricity
- 1.8%Fuel oil, kerosene, etc.
- 1.1%Bottled, tank, or LP gas
- 0.2%Other fuel
- 0.2%Wood
- 0.1%Coal or coke
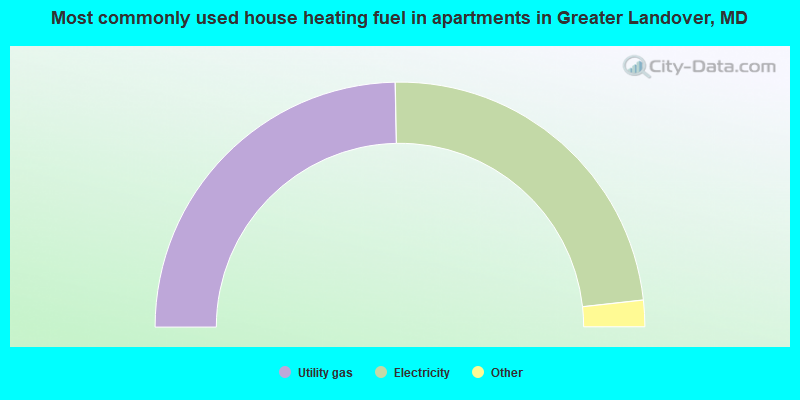
- 49.4%Utility gas
- 47.1%Electricity
- 1.5%Bottled, tank, or LP gas
- 1.2%Fuel oil, kerosene, etc.
- 0.8%No fuel used
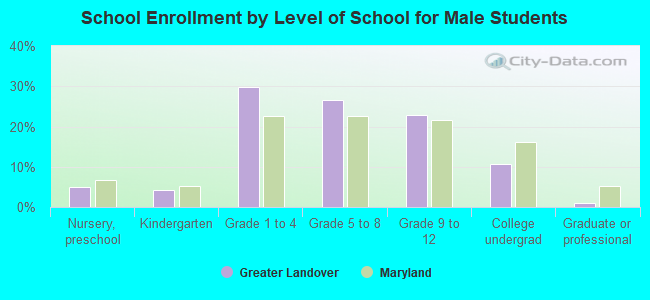
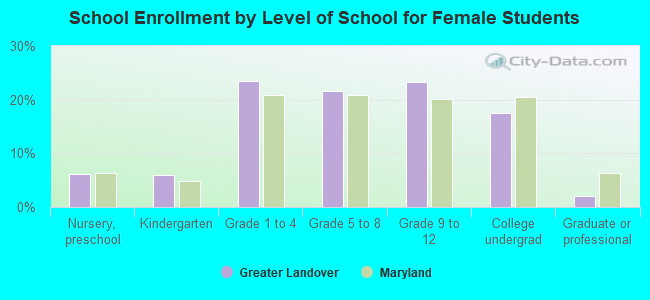
Private vs. public school enrollment:
| Here: | 2.2% |
| Maryland: | 14.8% |
| Here: | 3.0% |
| Maryland: | 13.3% |
| Here: | 18.5% |
| Maryland: | 21.7% |