Grandview, MO (Missouri) Houses and Residents
| Grandview: | $173,925 |
| Missouri: | $221,200 |
Total population: 25,290 (Urban population: 24,889, Rural population: 78 (all nonfarm))
Houses: 12,103 (11,352 occupied: 5,765 owner occupied, 5,777 renter occupied)
| % of renters here: | 50% |
| State: | 32% |
Housing density: 822 houses/condos per square mile
Median price asked for vacant for-sale houses and condos in 2022: $63,505.
Median contract rent in 2022: $799 (lower quartile is $662, upper quartile is $980)
Median rent asked for vacant for-rent units in 2022: $581
Median gross rent in Grandview, MO in 2022: $963
Housing units in Grandview with a mortgage: 3,791 (312 second mortgage, 0 home equity loan, 188 both second mortgage and home equity loan)
Houses without a mortgage: 5
Median household income for houses/condos with a mortgage: $71,525
Median household income for apartments without a mortgage: $60,010
Median monthly housing costs: $982
Compare current foreclosures in Grandview, MO:
| Photo | Address | Area | Beds / Baths | Price | Details |
|---|---|---|---|---|---|

|
#1
E 133rd Ter
Grandview, MO 64030
|
1,432 sq. feet
|
3 baths 3 beds |
show details | |

|
#2
E 151st St
Grandview, MO 64030
|
925 sq. feet
|
1 baths 3 beds |
show details | |

|
#3
Spring St
Grandview, MO 64030
|
934 sq. feet
|
2 baths 3 beds |
show details | |

|
#4
E 124th Ter
Grandview, MO 64030
|
1,351 sq. feet
|
2 baths 3 beds |
show details | |

|
#5
E 133rd Ter
Grandview, MO 64030
|
1,213 sq. feet
|
2 baths 3 beds |
show details | |

|
#6
Ewing Ave
Grandview, MO 64030
|
1,202 sq. feet
|
3 baths 3 beds |
show details | |

|
#7
E 136th St
Grandview, MO 64030
|
804 sq. feet
|
2 baths 3 beds |
show details | |

|
#8
8th St
Grandview, MO 64030
|
1,115 sq. feet
|
1 baths 1 beds |
show details | |

|
#9
Belmont Ave
Grandview, MO 64030
|
1,148 sq. feet
|
2 baths 3 beds |
show details | |

|
#10
Lowell Ave
Grandview, MO 64030
|
1,279 sq. feet
|
2 baths 3 beds |
show details |
| Photo | Address | Area | Beds / Baths | Price | Details |
|---|---|---|---|---|---|

|
#11
E 140th Pl
Grandview, MO 64030
|
1,398 sq. feet
|
2 baths 3 beds |
show details | |

|
#12
Falkirk Cir
Grandview, MO 64030
|
1,330 sq. feet
|
3 baths 3 beds |
show details | |

|
#13
E 129th St
Grandview, MO 64030
|
1,172 sq. feet
|
2 baths 3 beds |
show details | |

|
#14
Oakland Ave
Grandview, MO 64030
|
1,434 sq. feet
|
2 baths 3 beds |
show details | |

|
#15
12th St
Grandview, MO 64030
|
925 sq. feet
|
1 baths 3 beds |
show details | |

|
#16
Southview Dr
Grandview, MO 64030
|
1,114 sq. feet
|
2 baths 3 beds |
show details | |

|
#17
Corrington Ave
Grandview, MO 64030
|
1,179 sq. feet
|
2 baths 3 beds |
show details | |

|
#18
11th Ter
Grandview, MO 64030
|
912 sq. feet
|
1 baths 3 beds |
show details | |

|
#19
Herrick Ave
Grandview, MO 64030
|
912 sq. feet
|
1 baths 3 beds |
show details | |

|
#20
Corrington Ave
Grandview, MO 64030
|
- sq. feet
|
2 baths 3 beds |
show details |
| Photo | Address | Area | Beds / Baths | Price | Details |
|---|---|---|---|---|---|

|
#21
Botts Rd
Grandview, MO 64030
|
1,050 sq. feet
|
1 baths 3 beds |
show details | |

|
#22
Pinkston St
Grandview, MO 64030
|
1,343 sq. feet
|
2 baths 3 beds |
show details | |

|
#23
Cambridge Ave
Grandview, MO 64030
|
800 sq. feet
|
2 baths 2 beds |
show details | |

|
#24
E 119th Ter
Grandview, MO 64030
|
926 sq. feet
|
2 baths 3 beds |
show details | |

|
#25
11th Ter
Grandview, MO 64030
|
912 sq. feet
|
1 baths 3 beds |
show details | |

|
#26
12th St
Grandview, MO 64030
|
1,248 sq. feet
|
2 baths 3 beds |
show details | |

|
#27
E 119th Ter
Grandview, MO 64030
|
1,158 sq. feet
|
1 baths 3 beds |
show details | |

|
#28
Sycamore Ave
Grandview, MO 64030
|
1,627 sq. feet
|
2 baths 3 beds |
show details | |

|
#29
Overhill Rd
Grandview, MO 64030
|
1,470 sq. feet
|
2 baths 3 beds |
show details | |

|
#30
Saint Andrews Dr
Grandview, MO 64030
|
- sq. feet
|
2 baths 3 beds |
show details |
| Photo | Address | Area | Beds / Baths | Price | Details |
|---|---|---|---|---|---|

|
#31
Craig Dr
Grandview, MO 64030
|
- sq. feet
|
3 baths 3 beds |
show details | |

|
#32
Crystal Ave
Grandview, MO 64030
|
- sq. feet
|
2 baths 3 beds |
show details | |

|
#33
E 134th Ter
Grandview, MO 64030
|
- sq. feet
|
2 baths 4 beds |
show details | |

|
#34
Monroe Ave
Grandview, MO 64030
|
- sq. feet
|
3 baths 4 beds |
show details | |

|
#35
E 126th St Apt 202
Grandview, MO 64030
|
- sq. feet
|
- baths - beds |
show details | |

|
#36
E 126th St
Grandview, MO 64030
|
- sq. feet
|
- baths - beds |
show details | |

|
#37
White Ave Apt 205
Grandview, MO 64030
|
- sq. feet
|
- baths - beds |
show details | |

|
#38
Blue Ridge Ext Apt 4
Grandview, MO 64030
|
- sq. feet
|
- baths - beds |
show details | |

|
#39
Holiday Dr Apt 249
Grandview, MO 64030
|
- sq. feet
|
- baths - beds |
show details | |

|
#40
Craig Ave
Grandview, MO 64030
|
- sq. feet
|
- baths - beds |
show details |
| Photo | Address | Area | Beds / Baths | Price | Details |
|---|---|---|---|---|---|

|
#41
Corrington Ave
Grandview, MO 64030
|
- sq. feet
|
- baths - beds |
show details | |

|
#42
Bellaire Ave Apt A
Grandview, MO 64030
|
- sq. feet
|
- baths - beds |
show details | |

|
#43
Grand Summit Ext Apt 106
Grandview, MO 64030
|
- sq. feet
|
- baths - beds |
show details | |

|
#44
E 127th St
Grandview, MO 64030
|
- sq. feet
|
- baths - beds |
show details | |

|
#45
Grand Summit Blvd Apt 203
Grandview, MO 64030
|
- sq. feet
|
- baths - beds |
show details | |

|
#46
E 119th Ter
Grandview, MO 64030
|
- sq. feet
|
- baths - beds |
show details | |

|
#47
E 138th Ter
Grandview, MO 64030
|
- sq. feet
|
- baths - beds |
show details | |

|
#48
Grandboro Ln Apt 90
Grandview, MO 64030
|
- sq. feet
|
- baths - beds |
show details | |

|
#49
E 150th St
Grandview, MO 64030
|
- sq. feet
|
- baths - beds |
show details | |

|
Check over 1 million property listings on Foreclosure.com!
|
browse all offers | |||

Latest news about housing in Grandview, MO collected exclusively by city-data.com from local newspapers, TV, and radio stations

 | Why are rents higher in KS than MO parts of the metro? (34 replies) |
| Potentially moving to Kansas City, need some insight (33 replies) |
| Any Homeschooling Associations? (9 replies) |
| 12,000 vacant homes in KCMO (26 replies) |
| Kansas vs Missouri (taxwise) when buying a home, but working in Kansas City, Kansas. (9 replies) |
| Why KC's Lack of Traffic Isn't So Great (55 replies) |

Median year apartment built: 1977
Household type by relationship:
Households: 25,957- Male householders: 5,284 (1,974 living alone), Female householders: 5,890 (2,385 living alone)
3,570 spouses (3,513 opposite-sex spouses), 583 unmarried partners, (569 opposite-sex unmarried partners), 7,343 children (6,775 natural, 342 adopted, 225 stepchildren), 522 grandchildren, 350 brothers or sisters, 256 parents, 57 foster children, 536 other relatives, 1,391 non-relatives
- In group quarters: 170
Size of family households: 2,613 2-persons, 1,553 3-persons, 907 4-persons, 410 5-persons, 306 6-persons, 142 7-or-more-persons.
Size of nonfamily households: 4,660 1-person, 807 2-persons, 39 3-persons, 185 4-persons.
3,156 married couples with children.
2,107 single-parent households (885 men, 1,222 women).
86.6% of residents of Grandview speak English at home.
10.4% of residents speak Spanish at home (57% speak English very well, 20% speak English well, 16% speak English not well, 7% don't speak English at all).
1.3% of residents speak other Indo-European language at home (88% speak English very well, 1% speak English well, 11% speak English not well).
1.8% of residents speak Asian or Pacific Island language at home (44% speak English very well, 2% speak English well, 54% speak English not well).
0.9% of residents speak other language at home (96% speak English very well, 4% speak English well).
Foreign born population: 1,961 (7.6%)
(56.1% of them are naturalized citizens)
| Here: | 6.3 |
| State: | 6.4 |
| Here: | 4.2 |
| State: | 4.4 |

- Bedrooms in owner-occupied houses and condos in Grandview, Missouri
- 13no bedroom
- 81 bedroom
- 6282 bedrooms
- 3,5163 bedrooms
- 1,2114 bedrooms
- 3895+ bedrooms

- Bedrooms in renter-occupied apartments in Grandview, Missouri
- 121no bedroom
- 1,4311 bedroom
- 2,4462 bedrooms
- 1,6343 bedrooms
- 1094 bedrooms
- 365+ bedrooms

- Cars and other vehicles available in Grandview in owner-occupied houses/condos
- 48no vehicle
- 1,5071 vehicle
- 2,1462 vehicles
- 1,5473 vehicles
- 2754 vehicles
- 2425+ vehicles

- Cars and other vehicles available in Grandview in renter-occupied apartments
- 699no vehicle
- 3,3661 vehicle
- 1,4252 vehicles
- 2603 vehicles
- 04 vehicles
- 275+ vehicles

- Rooms in owner-occupied houses in Grandview, Missouri
- 131 room
- 02 rooms
- 323 rooms
- 3984 rooms
- 1,1365 rooms
- 1,4216 rooms
- 9597 rooms
- 8658 rooms
- 9419+ rooms

- Rooms in renter-occupied apartments in Grandview, Missouri
- 1211 room
- 4722 rooms
- 1,3213 rooms
- 1,4924 rooms
- 1,1115 rooms
- 7776 rooms
- 2407 rooms
- 1128 rooms
- 1329+ rooms


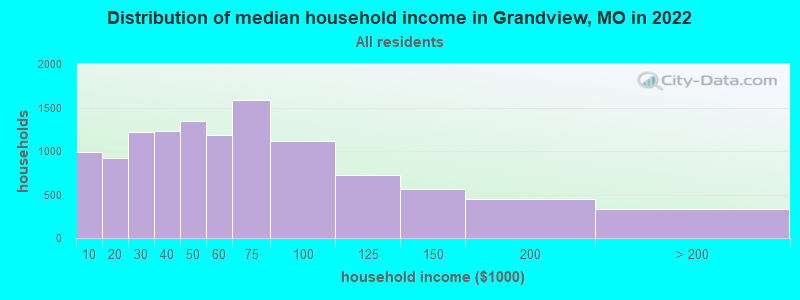
Grandview, MO household income distribution

- 988Less than $10,000
- 917$10,000 to $19,999
- 1,219$20,000 to $29,999
- 1,233$30,000 to $39,999
- 1,350$40,000 to $49,999
- 1,182$50,000 to $59,999
- 1,591$60,000 to $74,999
- 1,112$75,000 to $99,999
- 727$100,000 to $124,999
- 561$125,000 to $149,999
- 449$150,000 to $199,999
- 338$200,000 or more
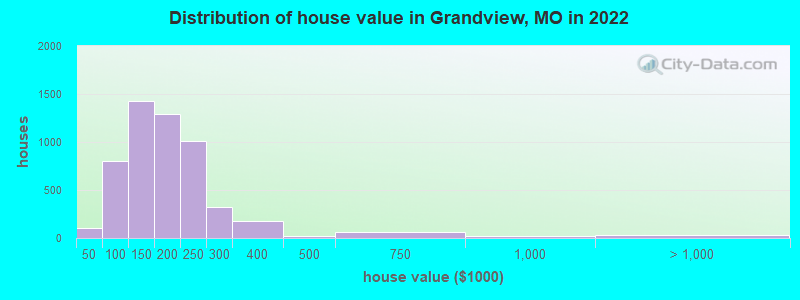
Home value of owner - occupied houses in 2022 in Grandview, MO
-
- 9Less than $10,000
- 17$10,000 to $14,999
- 22$15,000 to $19,999
- 25$20,000 to $24,999
- 28$40,000 to $49,999
- 56$50,000 to $59,999
- 189$60,000 to $69,999
- 121$70,000 to $79,999
- 218$80,000 to $89,999
- 189$90,000 to $99,999
- 750$100,000 to $124,999
- 678$125,000 to $149,999
- 802$150,000 to $174,999
- 490$175,000 to $199,999
- 1,015$200,000 to $249,999
- 328$250,000 to $299,999
- 172$300,000 to $399,999
- 17$400,000 to $499,999
- 64$500,000 to $749,999
- 20$750,000 to $999,999
- 8$1,000,000 to $1,499,999
- 4$1,500,000 to $1,999,999
- 21$2,000,000 or more
Rent paid by renters in 2022 in Grandview, MO
-
- 53Less than $100
- 4$100 to $149
- 141$200 to $249
- 8$250 to $299
- 68$300 to $349
- 47$350 to $399
- 12$400 to $449
- 79$450 to $499
- 171$500 to $549
- 374$550 to $599
- 303$600 to $649
- 571$650 to $699
- 486$700 to $749
- 546$750 to $799
- 817$800 to $899
- 666$900 to $999
- 498$1,000 to $1,249
- 408$1,250 to $1,499
- 52$1,500 to $1,999
- 128No cash rent


Percentage of workers working in this county: 67.1%
Number of people working at home: 1,969 (15.6% of all workers)
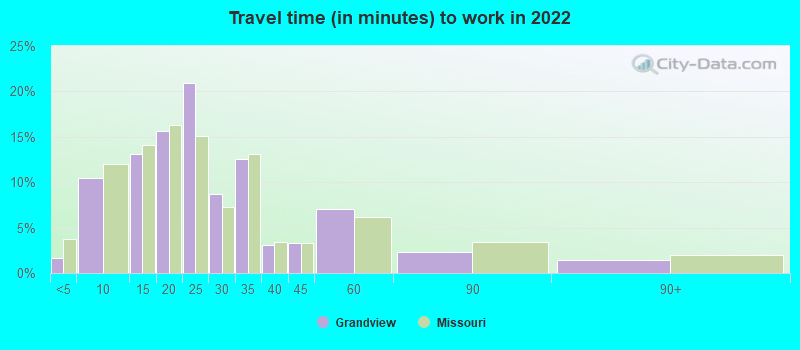
Travel time to work (commute)
- Less than 5 minutes: 170
- 5 to 9 minutes: 1,184
- 10 to 14 minutes: 1,603
- 15 to 19 minutes: 1,422
- 20 to 24 minutes: 2,099
- 25 to 29 minutes: 1,304
- 30 to 34 minutes: 1,878
- 35 to 39 minutes: 29
- 40 to 44 minutes: 415
- 45 to 59 minutes: 516
- 60 to 89 minutes: 48
- 90 or more minutes: 115
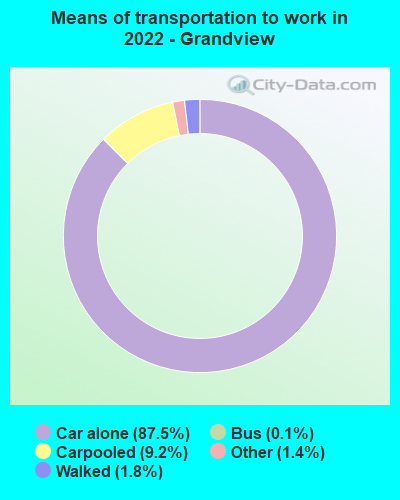
Means of transportation to work:
- Drove a car alone: 8,185 (73.3%)
- Carpooled: 851 (7.6%)
- Bus: 7 (0.1%)
- Taxi: 129 (1.2%)
- Walked: 138 (1.2%)
- Worked at home: 1,969 (17.6%)

- Unemployment by race in 2022
- Unemployment rate for White non-Hispanic residents
- 4.8%Males
- 1.7%Females
- Unemployment rate for Black residents
- 6.8%Males
- 10.4%Females
- Unemployment rate for Asian residents
- 3.8%Females
- Unemployment rate for other race residents
- 3.3%Males
- 6.0%Females
- Unemployment rate for two or more race residents
- 5.3%Males
- 5.2%Females
- Unemployment rate for Hispanic or Latino residents
- 2.5%Males
- 5.4%Females

- Year of entry for the foreign-born population in Grandview, Missouri
- 4932010 or later
- 4762000 to 2009
- 4291990 to 1999
- 1461980 to 1989
- 941970 to 1979
- 117Before 1970
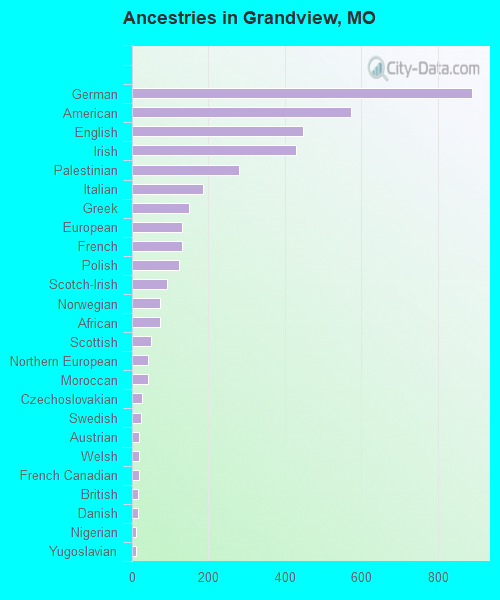
First ancestries reported:
- German: 889 (6.5%)
- American: 572 (4.2%)
- English: 448 (3.3%)
- Irish: 429 (3.1%)
- Palestinian: 280 (2.0%)
- Italian: 186 (1.4%)
- Greek: 150 (1.1%)
- European: 132 (1.0%)
- French: 132 (1.0%)
- Polish: 124 (0.9%)
- Scotch-Irish: 91 (0.7%)
- Norwegian: 74 (0.5%)
- African: 74 (0.5%)
- Scottish: 50 (0.4%)
- Northern European: 42 (0.3%)
- Moroccan: 41 (0.3%)
- Czechoslovakian: 25 (0.2%)
- Swedish: 24 (0.2%)
- Austrian: 19 (0.1%)
- Welsh: 19 (0.1%)
- French Canadian: 17 (0.1%)
- British: 16 (0.1%)
- Danish: 16 (0.1%)
- Nigerian: 11 (0.08%)
- Yugoslavian: 10 (0.07%)
- Egyptian: 9 (0.07%)
- Eastern European: 8 (0.06%)
- Ukrainian: 7 (0.05%)
- Slovene: 5 (0.04%)
- Dutch: 4 (0.03%)
- Finnish: 4 (0.03%)
- Cypriot: 2 (0.01%)
Most common places of birth for foreign-born residents (%):
| Grandview: | 34.9% (656) |
| Missouri: | 14.9% (38,568) |
| Grandview: | 17.8% (335) |
| Missouri: | 1.5% (3,926) |
| Grandview: | 9.4% (177) |
| Missouri: | 2.9% (7,525) |
| Grandview: | 9.1% (172) |
| Missouri: | 2.8% (7,146) |
| Grandview: | 5.3% (99) |
| Missouri: | 1.9% (4,806) |
| Grandview: | 4.4% (83) |
| Missouri: | 1.4% (3,640) |
| Grandview: | 2.8% (53) |
| Missouri: | 0.5% (1,233) |
| Grandview: | 2.2% (42) |
| Missouri: | 4.2% (10,873) |
| Grandview: | 2.0% (38) |
| Missouri: | 1.7% (4,518) |
| Grandview: | 2.0% (37) |
| Missouri: | 2.1% (5,346) |
| Grandview: | 1.6% (30) |
| Missouri: | 0.0% (124) |
| Grandview: | 1.5% (29) |
| Missouri: | 3.0% (7,803) |
Place of birth for U.S.-born residents:
- This state: 12,559
- Other state: 11,170
- Northeast: 588
- Midwest: 5,866
- South: 2,717
- West: 2,006
86.6% of Grandview residents lived in the same house 1 years ago.
Out of people who lived in different houses, 38.0% lived in this county.
Out of people who lived in different counties, 56.8% lived in Missouri.
| Grandview: | 86.6% |
| State average: | 87.1% |
Education attainment for males 25 years and older:
- No schooling: 229
- Nursery to 4th grade: 138
- 5th and 6th grade: 59
- 7th and 8th grade: 5
- 9th grade: 51
- 10th grade: 70
- 11th grade: 217
- 12th grade, no diploma: 190
- High school graduate (or equivalency): 2,852
- Less than 1 year of college: 718
- Some college more than 1 year, no degree: 1,225
- Associate degree: 634
- Bachelor's degree: 1,222
- Master's degree: 457
- Professional school degree: 26
- Doctorate degree: 60

Education attainment for females 25 years and older:
- No schooling: 90
- Nursery to 4th grade: 36
- 5th and 6th grade: 0
- 7th and 8th grade: 50
- 9th grade: 97
- 10th grade: 204
- 11th grade: 50
- 12th grade, no diploma: 165
- High school graduate (or equivalency): 2,820
- Less than 1 year of college: 805
- Some college more than 1 year, no degree: 1,661
- Associate degree: 952
- Bachelor's degree: 1,743
- Master's degree: 681
- Professional school degree: 137
- Doctorate degree: 20


Housing units in structures:
- One, detached: 7,123
- One, attached: 1,118
- Two: 452
- 3 or 4: 431
- 5 to 9: 851
- 10 to 19: 1,749
- 20 to 49: 209
- 50 or more: 166
Housing units lacking complete kitchen facilities in 2022: 1.2%
House/condo owner moved in on average 13 years ago
Renter moved in on average 4 years ago

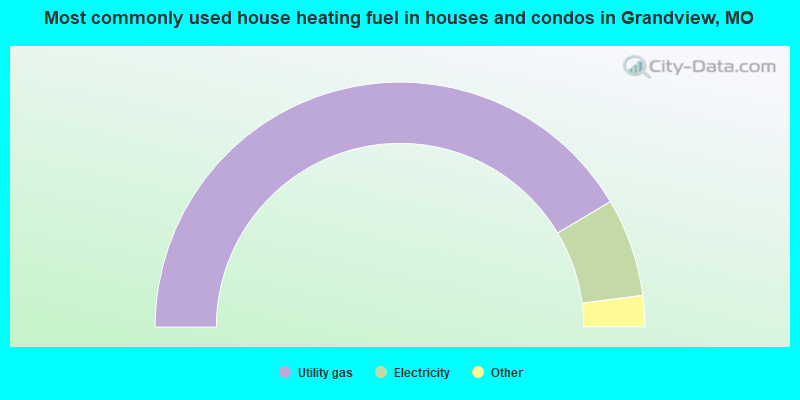
- 83.0%Utility gas
- 13.0%Electricity
- 2.8%Bottled, tank, or LP gas
- 1.0%Wood
- 0.3%Solar energy
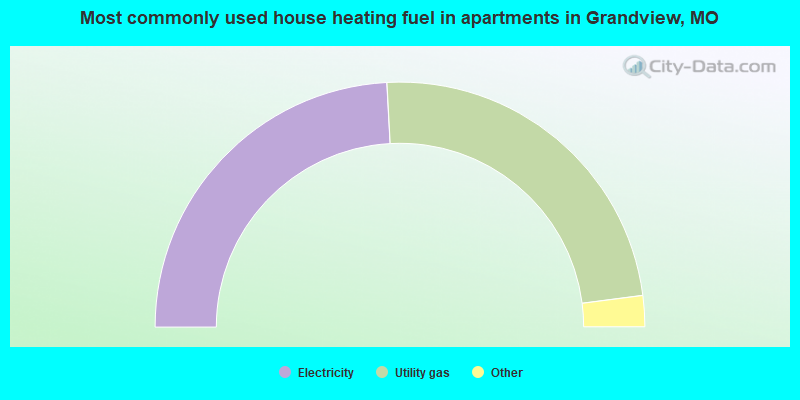
- 48.3%Electricity
- 47.6%Utility gas
- 3.1%Bottled, tank, or LP gas
- 0.9%Wood
Private vs. public school enrollment:
| Here: | 29.5% |
| Missouri: | 15.4% |
| Here: | 14.3% |
| Missouri: | 13.9% |
| Here: | 16.9% |
| Missouri: | 22.6% |


