Goshen, IN (Indiana) Houses and Residents
| Goshen: | $180,448 |
| Indiana: | $208,700 |
Mean price in 2022:
Detached houses: $198,657
Here: $198,657 State: $257,916 Townhouses or other attached units: $252,275
Here: $252,275 State: $224,114 In 2-unit structures: $235,444
Here: $235,444 State: $175,375 In 3-to-4-unit structures: $171,829
Here: $171,829 State: $151,116 In 5-or-more-unit structures: $82,647
Here: $82,647 State: $200,844 Mobile homes: $75,245
Here: $75,245 State: $67,116
Total population: 32,267 (Urban population: 29,187, Rural population: 101 (all nonfarm))
Houses: 14,169 (12,729 occupied: 8,193 owner occupied, 4,879 renter occupied)
| % of renters here: | 37% |
| State: | 29% |
Housing density: 1,074 houses/condos per square mile
Median price asked for vacant for-sale houses and condos in 2022: $236,110.
Median contract rent in 2022: $800 (lower quartile is $647, upper quartile is $1,032)
Median rent asked for vacant for-rent units in 2022: $789
Median gross rent in Goshen, IN in 2022: $1,017
Housing units in Goshen with a mortgage: 4,592 (374 second mortgage, 7 home equity loan, 376 both second mortgage and home equity loan)
Houses without a mortgage: 166
Median household income for houses/condos with a mortgage: $77,579
Median household income for apartments without a mortgage: $47,610
Median monthly housing costs: $911
Compare current foreclosures in Goshen, IN:
| Photo | Address | Area | Beds / Baths | Price | Details |
|---|---|---|---|---|---|

|
#1
S 14th St
Goshen, IN 46526
|
1,128 sq. feet
|
1 baths 3 beds |
show details | |

|
#2
N 23rd St
Goshen, IN 46528
|
2,234 sq. feet
|
2 baths 3 beds |
show details | |

|
#3
Tippecanoe Dr
Goshen, IN 46526
|
1,728 sq. feet
|
1 baths 5 beds |
show details | |

|
#4
Blackhawk Dr
Goshen, IN 46528
|
1,725 sq. feet
|
1 baths 3 beds |
show details | |

|
#5
W Pike St
Goshen, IN 46526
|
1,470 sq. feet
|
1 baths 3 beds |
show details | |

|
#6
Bayberry Dr
Goshen, IN 46526
|
1,400 sq. feet
|
1 baths 3 beds |
show details | |

|
#7
S Main St
Goshen, IN 46526
|
2,072 sq. feet
|
1 baths 3 beds |
show details | |

|
#8
Lexington Dr
Goshen, IN 46526
|
1,680 sq. feet
|
1 baths 3 beds |
show details | |

|
#9
Sequoia Dr
Goshen, IN 46528
|
1,625 sq. feet
|
1 baths 3 beds |
show details | |

|
#10
Blue Heron Dr
Goshen, IN 46528
|
3,624 sq. feet
|
2 baths 4 beds |
show details |
| Photo | Address | Area | Beds / Baths | Price | Details |
|---|---|---|---|---|---|

|
#11
Mandi Ln
Goshen, IN 46528
|
1,236 sq. feet
|
2 baths 3 beds |
show details | |

|
#12
Spring Brooke Dr
Goshen, IN 46528
|
1,498 sq. feet
|
1 baths 2 beds |
show details | |

|
#13
Leana Dr
Goshen, IN 46526
|
1,814 sq. feet
|
2 baths 3 beds |
show details | |

|
#14
Dundee Ct
Goshen, IN 46528
|
1,548 sq. feet
|
1 baths 4 beds |
show details | |

|
#15
N 9th St
Goshen, IN 46528
|
1,256 sq. feet
|
- baths 3 beds |
show details | |

|
#16
N 8th St
Goshen, IN 46528
|
1,232 sq. feet
|
- baths 2 beds |
show details | |

|
#17
County Road 13
Goshen, IN 46526
|
1,050 sq. feet
|
- baths 3 beds |
show details | |

|
#18
S 15th St
Goshen, IN 46526
|
1,056 sq. feet
|
- baths 3 beds |
show details | |

|
#19
S Main St
Goshen, IN 46526
|
1,656 sq. feet
|
- baths 3 beds |
show details | |

|
#20
Franklin St
Goshen, IN 46526
|
2,084 sq. feet
|
- baths 4 beds |
show details |
| Photo | Address | Area | Beds / Baths | Price | Details |
|---|---|---|---|---|---|

|
#21
Cheryl St
Goshen, IN 46526
|
1,344 sq. feet
|
- baths 3 beds |
show details | |

|
#22
S 14th St
Goshen, IN 46526
|
2,089 sq. feet
|
- baths 3 beds |
show details | |

|
#23
N Greene Rd
Goshen, IN 46526
|
1,033 sq. feet
|
- baths 3 beds |
show details | |

|
#24
County Road 27
Goshen, IN 46526
|
1,196 sq. feet
|
- baths 3 beds |
show details | |

|
#25
E Jefferson St
Goshen, IN 46528
|
1,566 sq. feet
|
- baths 2 beds |
show details | |

|
#26
County Road 29
Goshen, IN 46528
|
1,032 sq. feet
|
- baths 3 beds |
show details | |

|
#27
S 11th St
Goshen, IN 46526
|
660 sq. feet
|
- baths 3 beds |
show details | |

|
#28
S Main St
Goshen, IN 46526
|
1,344 sq. feet
|
- baths 2 beds |
show details | |

|
#29
N Main St
Goshen, IN 46528
|
1,310 sq. feet
|
- baths 2 beds |
show details | |

|
#30
County Road 19
Goshen, IN 46528
|
1,092 sq. feet
|
- baths 3 beds |
show details |
| Photo | Address | Area | Beds / Baths | Price | Details |
|---|---|---|---|---|---|

|
#31
Jed Ln
Goshen, IN 46528
|
- sq. feet
|
- baths - beds |
show details | |

|
#32
Arbor Ct Apt 2
Goshen, IN 46528
|
- sq. feet
|
- baths - beds |
show details | |

|
#33
Broadmore Est
Goshen, IN 46528
|
- sq. feet
|
- baths - beds |
show details | |

|
#34
S Silverwood Ln Apt 1
Goshen, IN 46526
|
- sq. feet
|
- baths - beds |
show details | |

|
#35
Roxbury Park
Goshen, IN 46526
|
- sq. feet
|
- baths - beds |
show details | |

|
#36
Roxbury Park
Goshen, IN 46526
|
- sq. feet
|
- baths - beds |
show details | |

|
#37
Palmetto Ln
Goshen, IN 46526
|
- sq. feet
|
- baths - beds |
show details | |

|
#38
Broadmore Est
Goshen, IN 46528
|
- sq. feet
|
- baths - beds |
show details | |

|
#39
Beaver Ln
Goshen, IN 46528
|
- sq. feet
|
- baths - beds |
show details | |

|
#40
Broadmore Est
Goshen, IN 46528
|
- sq. feet
|
- baths - beds |
show details |
| Photo | Address | Area | Beds / Baths | Price | Details |
|---|---|---|---|---|---|

|
#41
Winchester Trl
Goshen, IN 46526
|
- sq. feet
|
- baths - beds |
show details | |

|
#42
W Oakridge Ave
Goshen, IN 46528
|
- sq. feet
|
- baths - beds |
show details | |

|
#43
Brookside Mnr
Goshen, IN 46526
|
- sq. feet
|
- baths - beds |
show details | |

|
#44
Nana Ln
Goshen, IN 46528
|
- sq. feet
|
- baths - beds |
show details | |

|
#45
Brookside Mnr
Goshen, IN 46526
|
- sq. feet
|
- baths - beds |
show details | |

|
#46
County Road 19
Goshen, IN 46528
|
- sq. feet
|
- baths - beds |
show details | |

|
#47
County Road 45
Goshen, IN 46528
|
- sq. feet
|
- baths - beds |
show details | |

|
#48
Huron St
Goshen, IN 46526
|
- sq. feet
|
- baths - beds |
show details | |

|
#49
Winchester Trl
Goshen, IN 46526
|
- sq. feet
|
- baths - beds |
show details | |

|
Check over 1 million property listings on Foreclosure.com!
|
browse all offers | |||

Latest news about housing in Goshen, IN collected exclusively by city-data.com from local newspapers, TV, and radio stations

 | Looking for a place to live. How are the apartments in Goshen? (6 replies) |
| How to find rental homes? (in South Bend) (13 replies) |
| Potentially relocating to Elkhart, advice needed please. (6 replies) |
| Where to park my travel Trailer (3 replies) |
| What happened to the brain drain? (6 replies) |
| Greencastle Up and Coming? (17 replies) |

Median year apartment built: 1977
Household type by relationship:
Households: 34,712- Male householders: 6,268 (1,650 living alone), Female householders: 6,348 (2,609 living alone)
5,844 spouses (5,835 opposite-sex spouses), 757 unmarried partners, (741 opposite-sex unmarried partners), 10,844 children (9,947 natural, 535 adopted, 362 stepchildren), 812 grandchildren, 428 brothers or sisters, 326 parents, 0 foster children, 649 other relatives, 1,115 non-relatives
- In group quarters: 1,318
Size of family households: 3,671 2-persons, 1,413 3-persons, 1,217 4-persons, 1,016 5-persons, 289 6-persons, 120 7-or-more-persons.
Size of nonfamily households: 4,741 1-person, 519 2-persons, 212 3-persons, 14 4-persons, 11 5-persons, 21 6-persons.
4,593 married couples with children.
3,006 single-parent households (898 men, 2,108 women).
74.3% of residents of Goshen speak English at home.
22.6% of residents speak Spanish at home (67% speak English very well, 23% speak English well, 9% speak English not well, 1% don't speak English at all).
2.3% of residents speak other Indo-European language at home (86% speak English very well, 11% speak English well, 2% speak English not well, 2% don't speak English at all).
0.4% of residents speak Asian or Pacific Island language at home (54% speak English very well, 19% speak English well, 27% speak English not well).
1.2% of residents speak other language at home (43% speak English very well, 57% speak English well).
Foreign born population: 5,571 (16.0%)
(26.5% of them are naturalized citizens)
| Here: | 6.4 |
| State: | 6.6 |
| Here: | 4.4 |
| State: | 4.3 |

- Bedrooms in owner-occupied houses and condos in Goshen, Indiana
- 50no bedroom
- 2551 bedroom
- 1,9642 bedrooms
- 4,4183 bedrooms
- 1,2914 bedrooms
- 2165+ bedrooms

- Bedrooms in renter-occupied apartments in Goshen, Indiana
- 104no bedroom
- 1,2561 bedroom
- 1,8042 bedrooms
- 1,5943 bedrooms
- 1214 bedrooms
- 05+ bedrooms

- Cars and other vehicles available in Goshen in owner-occupied houses/condos
- 190no vehicle
- 3,1551 vehicle
- 3,2732 vehicles
- 1,1983 vehicles
- 2774 vehicles
- 1025+ vehicles

- Cars and other vehicles available in Goshen in renter-occupied apartments
- 771no vehicle
- 2,9141 vehicle
- 9382 vehicles
- 2123 vehicles
- 444 vehicles
- 05+ vehicles

- Rooms in owner-occupied houses in Goshen, Indiana
- 501 room
- 392 rooms
- 3253 rooms
- 6664 rooms
- 1,8165 rooms
- 1,5536 rooms
- 1,2177 rooms
- 1,2508 rooms
- 1,2789+ rooms

- Rooms in renter-occupied apartments in Goshen, Indiana
- 471 room
- 3632 rooms
- 6293 rooms
- 1,5074 rooms
- 1,2445 rooms
- 6096 rooms
- 2057 rooms
- 1528 rooms
- 1239+ rooms


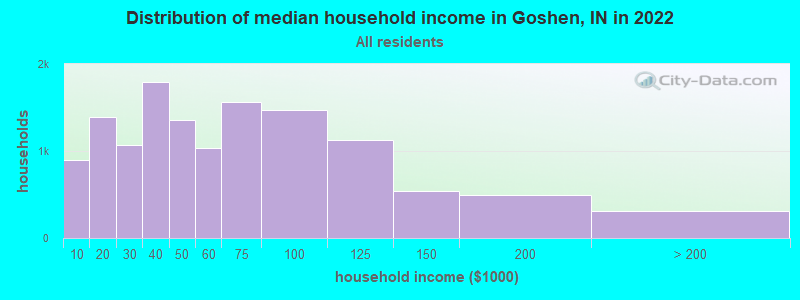
Goshen, IN household income distribution

- 892Less than $10,000
- 1,389$10,000 to $19,999
- 1,068$20,000 to $29,999
- 1,788$30,000 to $39,999
- 1,353$40,000 to $49,999
- 1,039$50,000 to $59,999
- 1,560$60,000 to $74,999
- 1,476$75,000 to $99,999
- 1,130$100,000 to $124,999
- 540$125,000 to $149,999
- 497$150,000 to $199,999
- 306$200,000 or more
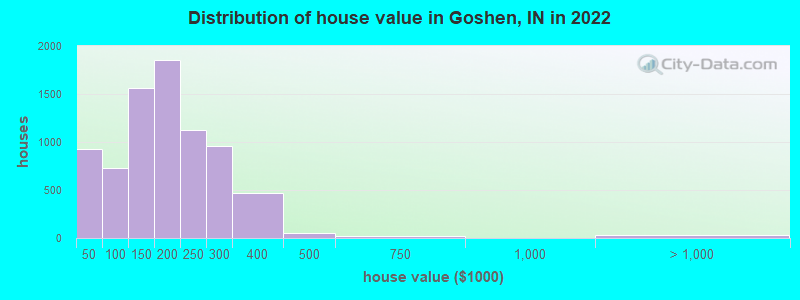
Home value of owner - occupied houses in 2022 in Goshen, IN
-
- 64Less than $10,000
- 49$10,000 to $14,999
- 463$15,000 to $19,999
- 165$20,000 to $24,999
- 13$25,000 to $29,999
- 26$30,000 to $34,999
- 23$35,000 to $39,999
- 115$40,000 to $49,999
- 90$50,000 to $59,999
- 58$60,000 to $69,999
- 110$70,000 to $79,999
- 246$80,000 to $89,999
- 104$90,000 to $99,999
- 718$100,000 to $124,999
- 844$125,000 to $149,999
- 1,161$150,000 to $174,999
- 691$175,000 to $199,999
- 1,125$200,000 to $249,999
- 954$250,000 to $299,999
- 470$300,000 to $399,999
- 52$400,000 to $499,999
- 22$500,000 to $749,999
- 35$1,000,000 to $1,499,999
Rent paid by renters in 2022 in Goshen, IN
-
- 12$150 to $199
- 88$200 to $249
- 5$250 to $299
- 53$300 to $349
- 75$350 to $399
- 155$400 to $449
- 111$450 to $499
- 109$500 to $549
- 303$550 to $599
- 624$600 to $649
- 361$650 to $699
- 562$700 to $749
- 283$750 to $799
- 529$800 to $899
- 639$900 to $999
- 962$1,000 to $1,249
- 361$1,250 to $1,499
- 317$1,500 to $1,999
- 8$2,500 to $2,999
- 16$3,500 or more
- 104No cash rent


Percentage of workers working in this county: 95.6%
Number of people working at home: 901 (6.0% of all workers)
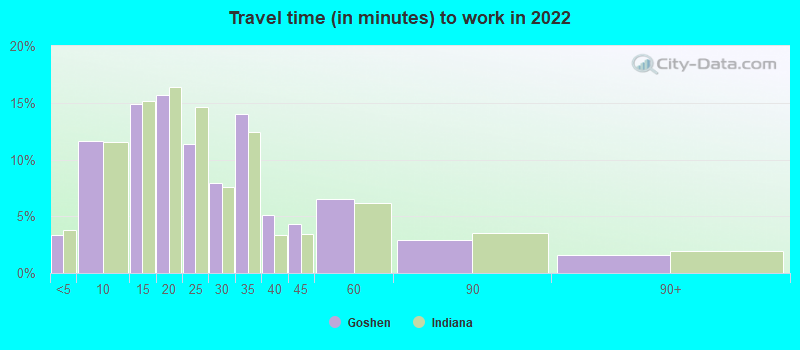
Travel time to work (commute)
- Less than 5 minutes: 600
- 5 to 9 minutes: 2,280
- 10 to 14 minutes: 2,442
- 15 to 19 minutes: 3,235
- 20 to 24 minutes: 1,867
- 25 to 29 minutes: 722
- 30 to 34 minutes: 1,167
- 35 to 39 minutes: 535
- 40 to 44 minutes: 385
- 45 to 59 minutes: 428
- 60 to 89 minutes: 197
- 90 or more minutes: 104
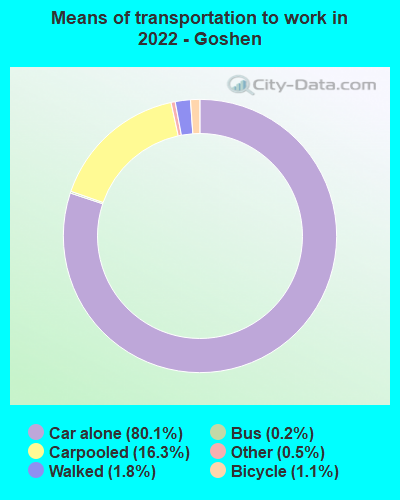
Means of transportation to work:
- Drove a car alone: 20,679 (75.1%)
- Carpooled: 4,755 (17.3%)
- Bus: 78 (0.3%)
- Ferryboat: 3 (0.0%)
- Taxi: 156 (0.6%)
- Bicycle: 340 (1.2%)
- Walked: 521 (1.9%)
- Worked at home: 901 (3.3%)

- Unemployment by race in 2022
- Unemployment rate for White non-Hispanic residents
- 3.2%Males
- 2.1%Females
- Unemployment rate for Black residents
- 20.1%Males
- Unemployment rate for other race residents
- 1.1%Males
- 8.0%Females
- Unemployment rate for two or more race residents
- 0.8%Males
- 16.2%Females
- Unemployment rate for Hispanic or Latino residents
- 1.4%Males
- 11.1%Females

- Year of entry for the foreign-born population in Goshen, Indiana
- 1,8432010 or later
- 1,7672000 to 2009
- 1,0841990 to 1999
- 7071980 to 1989
- 2101970 to 1979
- 307Before 1970

First ancestries reported:
- German: 3,298 (20.6%)
- American: 1,812 (11.3%)
- English: 972 (6.1%)
- European: 930 (5.8%)
- Irish: 688 (4.3%)
- African: 424 (2.6%)
- Dutch: 149 (0.9%)
- Pennsylvania German: 149 (0.9%)
- Swiss: 131 (0.8%)
- French: 119 (0.7%)
- Polish: 106 (0.7%)
- Italian: 85 (0.5%)
- Scotch-Irish: 78 (0.5%)
- Hungarian: 54 (0.3%)
- Eastern European: 48 (0.3%)
- Kenyan: 40 (0.2%)
- Northern European: 36 (0.2%)
- Norwegian: 32 (0.2%)
- Scottish: 26 (0.2%)
- Scandinavian: 23 (0.1%)
- Basque: 20 (0.1%)
- Belizean: 20 (0.1%)
- Estonian: 15 (0.09%)
- Russian: 14 (0.09%)
- Arab: 11 (0.07%)
- British: 11 (0.07%)
- Austrian: 10 (0.06%)
- Czech: 10 (0.06%)
- Romanian: 9 (0.06%)
- Welsh: 9 (0.06%)
- Ukrainian: 7 (0.04%)
- Finnish: 2 (0.01%)
Most common places of birth for foreign-born residents (%):
| Goshen: | 50.1% (2,681) |
| Indiana: | 27.0% (101,996) |
| Goshen: | 7.2% (387) |
| Indiana: | 1.6% (5,892) |
| Goshen: | 6.1% (325) |
| Indiana: | 0.8% (3,114) |
| Goshen: | 5.9% (316) |
| Indiana: | 3.3% (12,337) |
| Goshen: | 5.6% (302) |
| Indiana: | 2.3% (8,656) |
| Goshen: | 3.7% (199) |
| Indiana: | 0.5% (1,776) |
| Goshen: | 3.1% (168) |
| Indiana: | 2.0% (7,653) |
| Goshen: | 1.6% (87) |
| Indiana: | 0.4% (1,465) |
Place of birth for U.S.-born residents:
- This state: 20,428
- Other state: 7,949
- Northeast: 1,026
- Midwest: 4,286
- South: 1,614
- West: 1,016
84.9% of Goshen residents lived in the same house 1 years ago.
Out of people who lived in different houses, 37.8% lived in this county.
Out of people who lived in different counties, 69.3% lived in Indiana.
| Goshen: | 84.9% |
| State average: | 87.1% |
Education attainment for males 25 years and older:
- No schooling: 388
- Nursery to 4th grade: 0
- 5th and 6th grade: 94
- 7th and 8th grade: 302
- 9th grade: 314
- 10th grade: 198
- 11th grade: 168
- 12th grade, no diploma: 245
- High school graduate (or equivalency): 3,659
- Less than 1 year of college: 664
- Some college more than 1 year, no degree: 1,029
- Associate degree: 399
- Bachelor's degree: 1,672
- Master's degree: 751
- Professional school degree: 106
- Doctorate degree: 305

Education attainment for females 25 years and older:
- No schooling: 501
- Nursery to 4th grade: 86
- 5th and 6th grade: 43
- 7th and 8th grade: 156
- 9th grade: 195
- 10th grade: 445
- 11th grade: 363
- 12th grade, no diploma: 182
- High school graduate (or equivalency): 4,529
- Less than 1 year of college: 698
- Some college more than 1 year, no degree: 1,214
- Associate degree: 785
- Bachelor's degree: 1,726
- Master's degree: 877
- Professional school degree: 61
- Doctorate degree: 140


Housing units in structures:
- One, detached: 8,260
- One, attached: 758
- Two: 360
- 3 or 4: 965
- 5 to 9: 752
- 10 to 19: 359
- 20 to 49: 398
- 50 or more: 702
- Mobile homes: 1,610
Median worth of mobile homes: $38,551
Housing units lacking complete kitchen facilities in 2022: 0.9%
House/condo owner moved in on average 12 years ago
Renter moved in on average 3 years ago

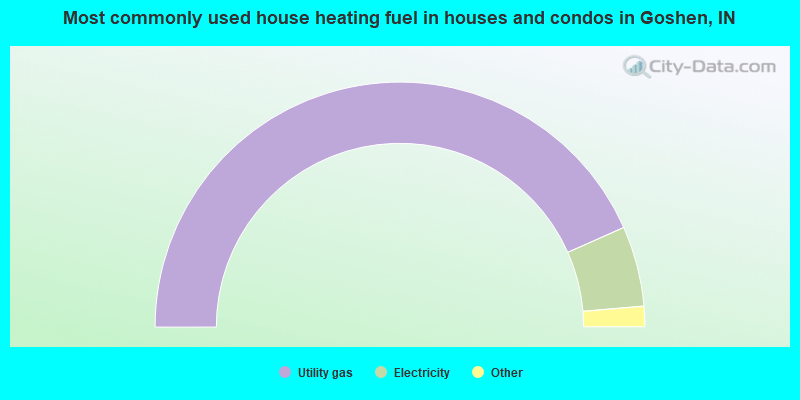
- 86.7%Utility gas
- 10.6%Electricity
- 1.1%Bottled, tank, or LP gas
- 0.8%Wood
- 0.5%Other fuel
- 0.2%Fuel oil, kerosene, etc.
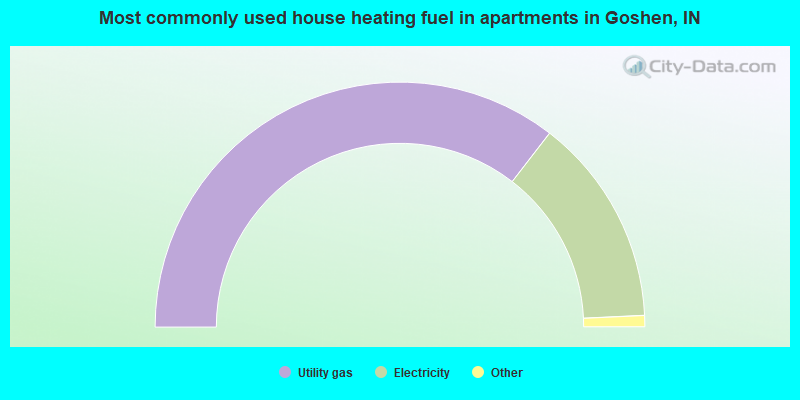
- 71.0%Utility gas
- 27.6%Electricity
- 1.1%Other fuel
- 0.3%Bottled, tank, or LP gas
- 0.1%No fuel used
Private vs. public school enrollment:
| Here: | 9.5% |
| Indiana: | 14.9% |
| Here: | 6.2% |
| Indiana: | 11.4% |
| Here: | 46.5% |
| Indiana: | 22.3% |


