Glassboro, NJ (New Jersey) Houses and Residents
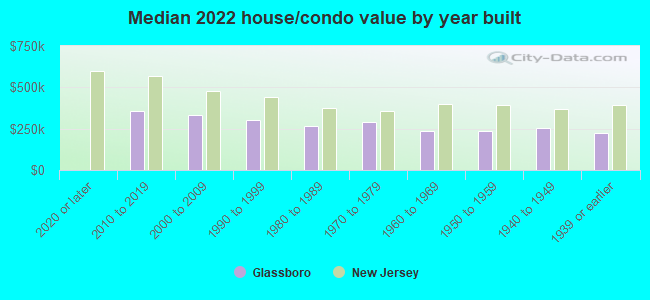
| Glassboro: | $281,214 |
| New Jersey: | $428,900 |
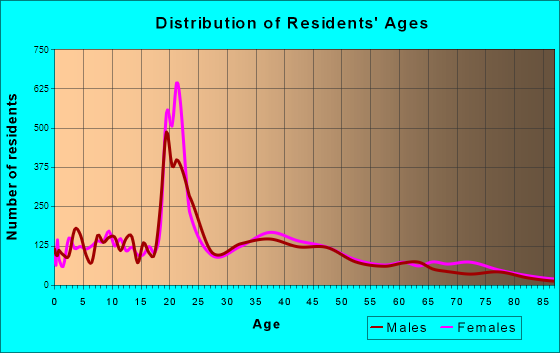
Total population: 19,007 (Urban population: 18,850, Rural population: 218 (all nonfarm))
Houses: 8,349 (7,570 occupied: 4,648 owner occupied, 2,994 renter occupied)
| % of renters here: | 39% |
| State: | 35% |
Housing density: 907 houses/condos per square mile
Median price asked for vacant for-sale houses and condos in 2022 in this county: $201,126.
Median contract rent in 2022: $1,274 (lower quartile is $880, upper quartile is $1,812)
Median rent asked for vacant for-rent units in 2022: $3,058
Median gross rent in Glassboro, NJ in 2022: $1,421
Housing units in Glassboro with a mortgage: 2,926 (225 second mortgage, 11 home equity loan, 197 both second mortgage and home equity loan)
Houses without a mortgage: 39
Median household income for houses/condos with a mortgage: $113,754
Median household income for apartments without a mortgage: $65,181
Median monthly housing costs: $1,507
Compare current foreclosures in Glassboro, NJ:
| Photo | Address | Area | Beds / Baths | Price | Details |
|---|---|---|---|---|---|

|
#1
N Palace Dr
Glassboro, NJ 08028
|
1,908 sq. feet
|
- baths - beds |
show details | |

|
#2
Ware Dr
Glassboro, NJ 08028
|
1,486 sq. feet
|
- baths - beds |
show details | |

|
#3
Stoneshire Dr
Glassboro, NJ 08028
|
1,360 sq. feet
|
- baths - beds |
show details | |

|
#4
High St E Apt J191
Glassboro, NJ 08028
|
- sq. feet
|
- baths - beds |
show details | |

|
#5
High St E Apt C44
Glassboro, NJ 08028
|
- sq. feet
|
- baths - beds |
show details | |

|
#6
Hardwood Ct
Glassboro, NJ 08028
|
1,500 sq. feet
|
- baths - beds |
show details | |

|
#7
S Academy St
Glassboro, NJ 08028
|
- sq. feet
|
- baths - beds |
show details | |

|
#8
Arch St
Glassboro, NJ 08028
|
2,143 sq. feet
|
- baths - beds |
show details | |

|
#9
Fordham Pl
Glassboro, NJ 08028
|
2,580 sq. feet
|
- baths - beds |
show details | |

|
#10
Azure Ln
Glassboro, NJ 08028
|
1,876 sq. feet
|
- baths - beds |
show details |
| Photo | Address | Area | Beds / Baths | Price | Details |
|---|---|---|---|---|---|

|
#11
Glasswycke Dr
Glassboro, NJ 08028
|
2,368 sq. feet
|
- baths - beds |
show details | |

|
#12
Gianna Dr
Glassboro, NJ 08028
|
- sq. feet
|
- baths - beds |
show details | |

|
#13
Sewell St
Glassboro, NJ 08028
|
1,512 sq. feet
|
- baths - beds |
show details | |

|
#14
Mullica Hill Rd
Glassboro, NJ 08028
|
- sq. feet
|
- baths - beds |
show details | |

|
#15
Fordham Pl
Glassboro, NJ 08028
|
2,580 sq. feet
|
- baths - beds |
show details | |

|
#16
Stoneshire Dr
Glassboro, NJ 08028
|
1,400 sq. feet
|
- baths - beds |
show details | |

|
#17
Whethersfield Dr
Glassboro, NJ 08028
|
1,408 sq. feet
|
- baths - beds |
show details | |

|
#18
Boro Cmns
Glassboro, NJ 08028
|
968 sq. feet
|
- baths - beds |
show details | |

|
#19
Mullica Hill Rd Apt A108
Glassboro, NJ 08028
|
- sq. feet
|
- baths - beds |
show details | |

|
#20
High St E
Glassboro, NJ 08028
|
- sq. feet
|
- baths - beds |
show details |
| Photo | Address | Area | Beds / Baths | Price | Details |
|---|---|---|---|---|---|

|
#21
Palmer Ct
Glassboro, NJ 08028
|
2,174 sq. feet
|
- baths - beds |
show details | |

|
#22
Hetton Ct
Glassboro, NJ 08028
|
1,728 sq. feet
|
- baths - beds |
show details | |

|
#23
Hollybush Gdns
Glassboro, NJ 08028
|
- sq. feet
|
- baths - beds |
show details | |

|
#24
Foxboro Dr
Glassboro, NJ 08028
|
1,792 sq. feet
|
- baths - beds |
show details | |

|
#25
State St
Glassboro, NJ 08028
|
1,808 sq. feet
|
- baths - beds |
show details | |

|
#26
Alfred Ave
Glassboro, NJ 08028
|
2,470 sq. feet
|
- baths - beds |
show details | |

|
#27
Avenue
Glassboro, NJ 08028
|
- sq. feet
|
- baths - beds |
show details | |

|
#28
Geneva Ct
Glassboro, NJ 08028
|
1,904 sq. feet
|
- baths - beds |
show details | |

|
#29
Delsea Dr S
Glassboro, NJ 08028
|
- sq. feet
|
- baths - beds |
show details | |

|
#30
Honeymoon Ln
Glassboro, NJ 08028
|
- sq. feet
|
- baths - beds |
show details |
| Photo | Address | Area | Beds / Baths | Price | Details |
|---|---|---|---|---|---|

|
#31
Dickinson Rd
Glassboro, NJ 08028
|
1,744 sq. feet
|
- baths - beds |
show details | |

|
#32
High St E Apt M253
Glassboro, NJ 08028
|
- sq. feet
|
- baths - beds |
show details | |

|
#33
N Main St
Glassboro, NJ 08028
|
1,064 sq. feet
|
- baths - beds |
show details | |

|
#34
Delsea Dr S, Apt 2
Glassboro, NJ 08028
|
- sq. feet
|
- baths - beds |
show details | |

|
#35
Gianna Dr
Glassboro, NJ 08028
|
- sq. feet
|
- baths - beds |
show details | |

|
#36
Thornwood Dr
Glassboro, NJ 08028
|
- sq. feet
|
- baths - beds |
show details | |

|
#37
Hollybush Gdns
Glassboro, NJ 08028
|
- sq. feet
|
- baths - beds |
show details | |

|
#38
Marlowe Ct
Glassboro, NJ 08028
|
1,808 sq. feet
|
- baths - beds |
show details | |

|
#39
Hampton Blvd
Glassboro, NJ 08028
|
1,728 sq. feet
|
- baths - beds |
show details | |

|
#40
Charles Iii Dr
Glassboro, NJ 08028
|
1,608 sq. feet
|
- baths - beds |
show details |
| Photo | Address | Area | Beds / Baths | Price | Details |
|---|---|---|---|---|---|

|
#41
Demoss Ct
Glassboro, NJ 08028
|
2,074 sq. feet
|
- baths - beds |
show details | |

|
#42
Yellowwood Ct
Glassboro, NJ 08028
|
- sq. feet
|
- baths - beds |
show details | |

|
#43
Pershing Ave
Glassboro, NJ 08028
|
- sq. feet
|
- baths - beds |
show details | |

|
#44
Evergreen Pkwy
Glassboro, NJ 08028
|
2,016 sq. feet
|
- baths - beds |
show details | |

|
#45
Victoria St
Glassboro, NJ 08028
|
1,484 sq. feet
|
- baths - beds |
show details | |

|
#46
Mullica Hill Rd Apt C223
Glassboro, NJ 08028
|
- sq. feet
|
- baths - beds |
show details | |

|
#47
Dickinson Rd
Glassboro, NJ 08028
|
1,622 sq. feet
|
- baths - beds |
show details | |

|
#48
Sewell St
Glassboro, NJ 08028
|
1,610 sq. feet
|
- baths - beds |
show details | |

|
#49
Victoria St
Glassboro, NJ 08028
|
2,234 sq. feet
|
- baths - beds |
show details | |

|
Check over 1 million property listings on Foreclosure.com!
|
browse all offers | |||

Latest news about housing in Glassboro, NJ collected exclusively by city-data.com from local newspapers, TV, and radio stations


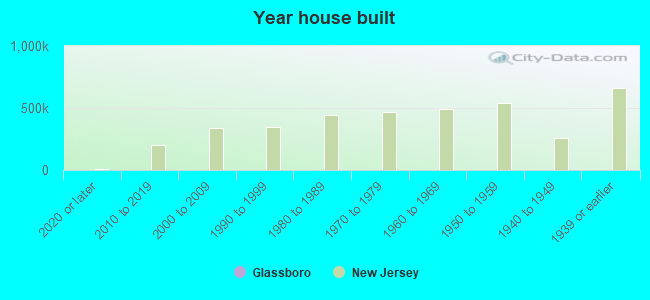
Median year apartment built: 1976
Household type by relationship:
Households: 23,316- Male householders: 3,886 (734 living alone), Female householders: 3,733 (1,242 living alone)
3,256 spouses (3,250 opposite-sex spouses), 397 unmarried partners, (397 opposite-sex unmarried partners), 5,189 children (4,845 natural, 90 adopted, 253 stepchildren), 351 grandchildren, 173 brothers or sisters, 137 parents, 0 foster children, 248 other relatives, 2,071 non-relatives
- In group quarters: 3,871
Size of family households: 2,152 2-persons, 1,342 3-persons, 737 4-persons, 351 5-persons, 109 6-persons, 28 7-or-more-persons.
Size of nonfamily households: 2,008 1-person, 579 2-persons, 70 3-persons, 91 4-persons, 61 5-persons, 63 6-persons, 48 7-or-more-persons.
1,837 married couples with children.
831 single-parent households (99 men, 732 women).
85.0% of residents of Glassboro speak English at home.
6.4% of residents speak Spanish at home (62% speak English very well, 30% speak English well, 7% don't speak English at all).
4.1% of residents speak other Indo-European language at home (81% speak English very well, 14% speak English well, 4% speak English not well).
3.3% of residents speak Asian or Pacific Island language at home (46% speak English very well, 42% speak English well, 6% speak English not well, 5% don't speak English at all).
0.6% of residents speak other language at home (73% speak English very well, 27% speak English well).
Foreign born population: 2,211 (9.5%)
(61.5% of them are naturalized citizens)
| Here: | 7.1 |
| State: | 6.8 |
| Here: | 4.0 |
| State: | 3.9 |
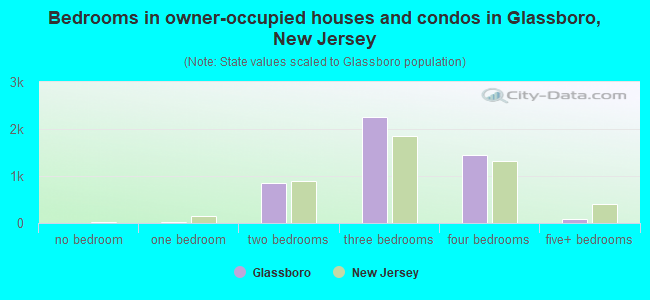
- Bedrooms in owner-occupied houses and condos in Glassboro, New Jersey
- 0no bedroom
- 141 bedroom
- 8472 bedrooms
- 2,2453 bedrooms
- 1,4514 bedrooms
- 915+ bedrooms
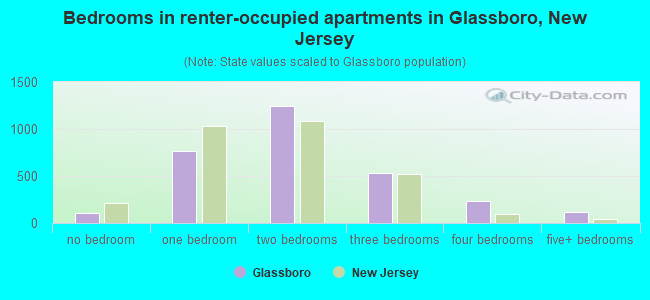
- Bedrooms in renter-occupied apartments in Glassboro, New Jersey
- 106no bedroom
- 7641 bedroom
- 1,2482 bedrooms
- 5303 bedrooms
- 2334 bedrooms
- 1145+ bedrooms
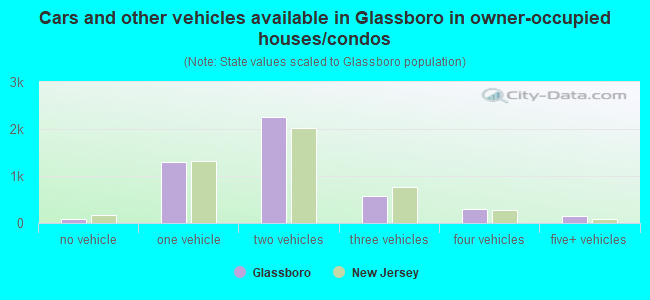
- Cars and other vehicles available in Glassboro in owner-occupied houses/condos
- 81no vehicle
- 1,2931 vehicle
- 2,2592 vehicles
- 5763 vehicles
- 3004 vehicles
- 1395+ vehicles
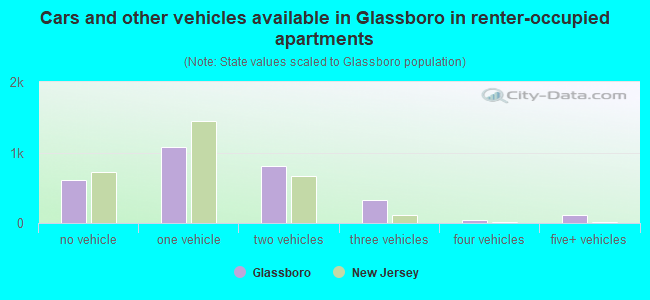
- Cars and other vehicles available in Glassboro in renter-occupied apartments
- 616no vehicle
- 1,0851 vehicle
- 8082 vehicles
- 3233 vehicles
- 454 vehicles
- 1185+ vehicles
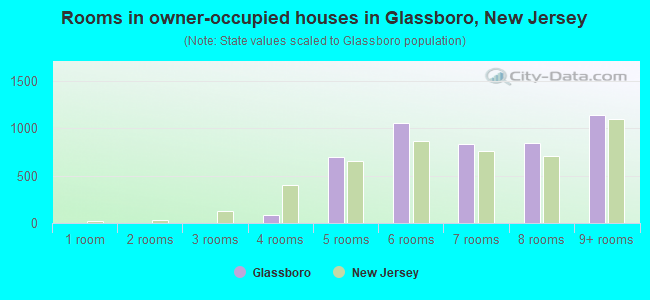
- Rooms in owner-occupied houses in Glassboro, New Jersey
- 01 room
- 02 rooms
- 03 rooms
- 854 rooms
- 6995 rooms
- 1,0506 rooms
- 8337 rooms
- 8428 rooms
- 1,1389+ rooms
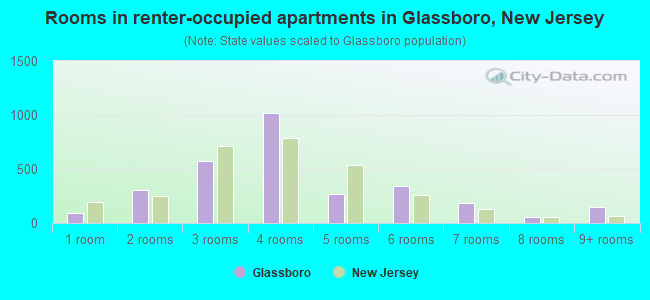
- Rooms in renter-occupied apartments in Glassboro, New Jersey
- 911 room
- 3062 rooms
- 5763 rooms
- 1,0174 rooms
- 2705 rooms
- 3416 rooms
- 1827 rooms
- 598 rooms
- 1519+ rooms
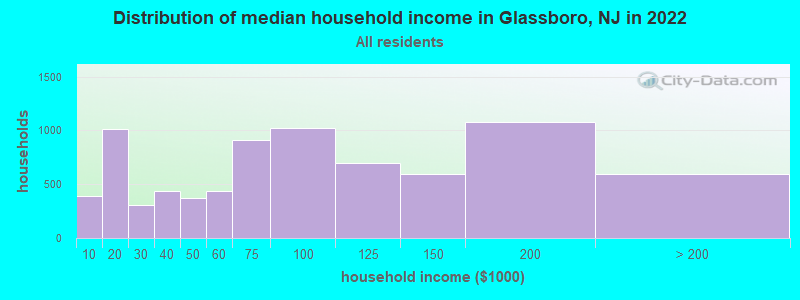
Glassboro, NJ household income distribution

- 392Less than $10,000
- 1,010$10,000 to $19,999
- 303$20,000 to $29,999
- 441$30,000 to $39,999
- 373$40,000 to $49,999
- 436$50,000 to $59,999
- 915$60,000 to $74,999
- 1,019$75,000 to $99,999
- 693$100,000 to $124,999
- 591$125,000 to $149,999
- 1,078$150,000 to $199,999
- 596$200,000 or more
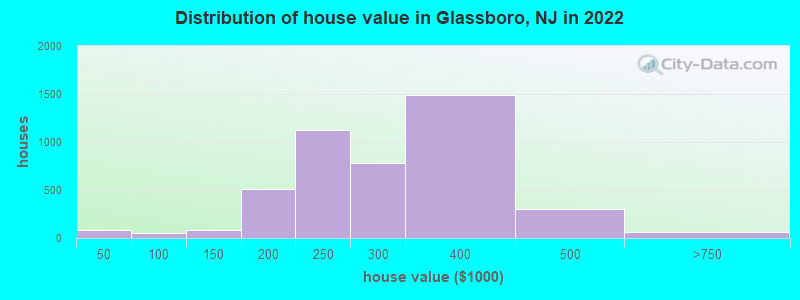
Home value of owner - occupied houses in 2022 in Glassboro, NJ
-
- 8Less than $10,000
- 34$10,000 to $14,999
- 14$15,000 to $19,999
- 27$20,000 to $24,999
- 8$50,000 to $59,999
- 27$80,000 to $89,999
- 16$90,000 to $99,999
- 10$100,000 to $124,999
- 70$125,000 to $149,999
- 202$150,000 to $174,999
- 311$175,000 to $199,999
- 1,123$200,000 to $249,999
- 779$250,000 to $299,999
- 1,487$300,000 to $399,999
- 301$400,000 to $499,999
- 56$500,000 to $749,999
- 2$750,000 to $999,999
- 7$1,000,000 to $1,499,999
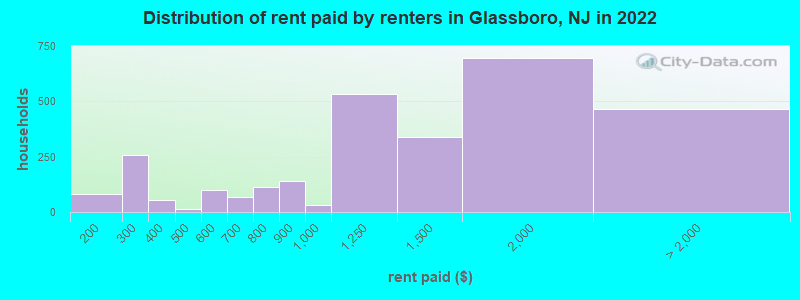
Rent paid by renters in 2022 in Glassboro, NJ
-
- 82$150 to $199
- 110$200 to $249
- 147$250 to $299
- 22$300 to $349
- 32$350 to $399
- 9$400 to $449
- 4$450 to $499
- 98$500 to $549
- 14$600 to $649
- 53$650 to $699
- 41$700 to $749
- 71$750 to $799
- 137$800 to $899
- 30$900 to $999
- 531$1,000 to $1,249
- 339$1,250 to $1,499
- 698$1,500 to $1,999
- 270$2,000 to $2,499
- 153$2,500 to $2,999
- 41No cash rent
Percentage of workers working in this county: 59.9%
Number of people working at home: 1,570 (14.1% of all workers)
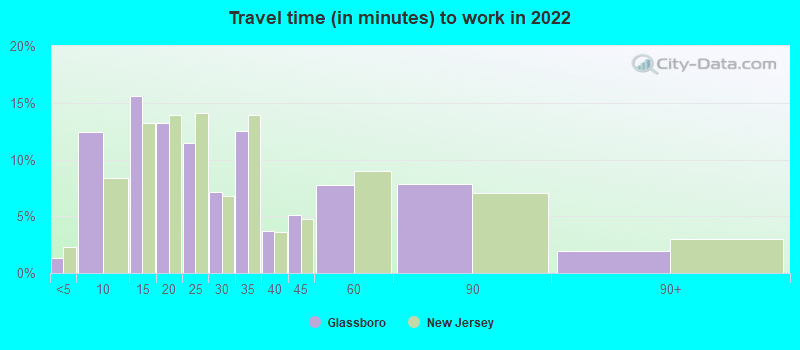
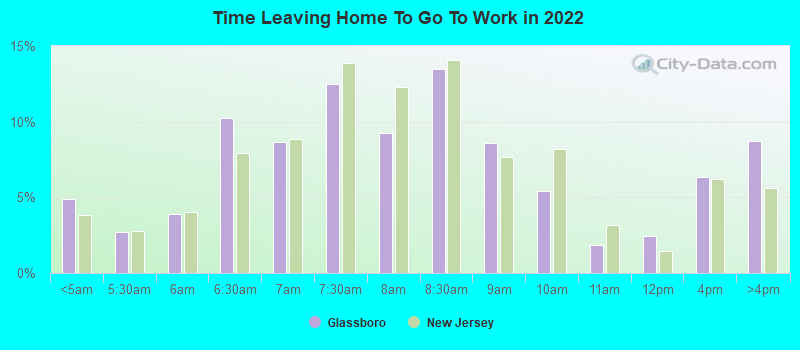
Travel time to work (commute)
- Less than 5 minutes: 96
- 5 to 9 minutes: 1,136
- 10 to 14 minutes: 1,299
- 15 to 19 minutes: 1,360
- 20 to 24 minutes: 887
- 25 to 29 minutes: 468
- 30 to 34 minutes: 1,390
- 35 to 39 minutes: 415
- 40 to 44 minutes: 428
- 45 to 59 minutes: 1,000
- 60 to 89 minutes: 777
- 90 or more minutes: 280
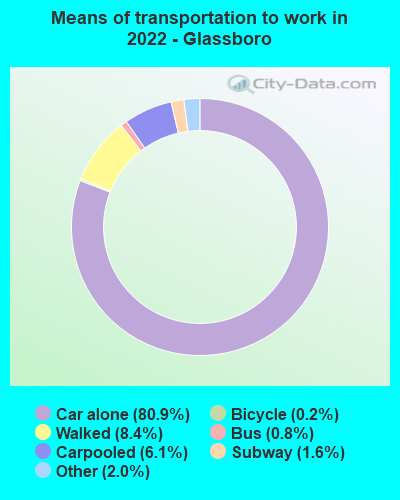
Means of transportation to work:
- Drove a car alone: 7,118 (67.5%)
- Carpooled: 633 (6.0%)
- Bus: 65 (0.6%)
- Long-distance train or commuter rail: 264 (2.5%)
- Taxi: 189 (1.8%)
- Bicycle: 21 (0.2%)
- Walked: 993 (9.4%)
- Worked at home: 1,570 (14.9%)
- Unemployment by race in 2022
- Unemployment rate for White non-Hispanic residents
- 6.3%Males
- 2.7%Females
- Unemployment rate for Black residents
- 25.6%Males
- 5.2%Females
- Unemployment rate for Asian residents
- 11.6%Males
- 3.4%Females
- Unemployment rate for other race residents
- 20.0%Males
- Unemployment rate for two or more race residents
- 4.5%Females
- Unemployment rate for Hispanic or Latino residents
- 10.4%Males
- 1.9%Females
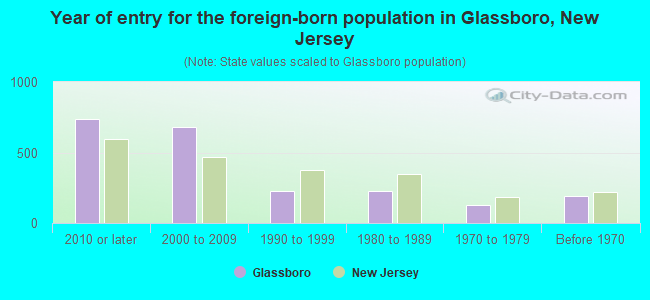
- Year of entry for the foreign-born population in Glassboro, New Jersey
- 7372010 or later
- 6832000 to 2009
- 2281990 to 1999
- 2261980 to 1989
- 1251970 to 1979
- 191Before 1970
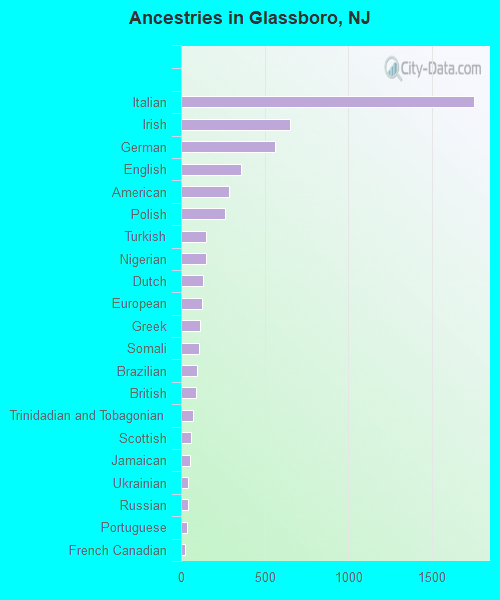
First ancestries reported:
- Italian: 1,756 (16.8%)
- Irish: 652 (6.2%)
- German: 565 (5.4%)
- English: 358 (3.4%)
- American: 288 (2.8%)
- Polish: 261 (2.5%)
- Turkish: 150 (1.4%)
- Nigerian: 150 (1.4%)
- Dutch: 134 (1.3%)
- European: 123 (1.2%)
- Greek: 115 (1.1%)
- Somali: 105 (1.0%)
- Brazilian: 93 (0.9%)
- British: 89 (0.9%)
- Trinidadian and Tobagonian: 73 (0.7%)
- Scottish: 57 (0.5%)
- Jamaican: 52 (0.5%)
- Ukrainian: 43 (0.4%)
- Russian: 39 (0.4%)
- Portuguese: 36 (0.3%)
- French Canadian: 23 (0.2%)
- African: 14 (0.1%)
- Scotch-Irish: 12 (0.1%)
- Northern European: 10 (0.10%)
- Ghanaian: 10 (0.10%)
- Iranian: 9 (0.09%)
- Hungarian: 8 (0.08%)
- Lithuanian: 8 (0.08%)
- Eastern European: 5 (0.05%)
- Romanian: 3 (0.03%)
- Swedish: 3 (0.03%)
- Armenian: 2 (0.02%)
- Guyanese: 2 (0.02%)
Most common places of birth for foreign-born residents (%):
| Glassboro: | 16.9% (347) |
| New Jersey: | 12.8% (274,609) |
| Glassboro: | 10.4% (214) |
| New Jersey: | 0.8% (16,778) |
| Glassboro: | 7.2% (148) |
| New Jersey: | 0.6% (12,929) |
| Glassboro: | 5.3% (109) |
| New Jersey: | 4.0% (85,934) |
| Glassboro: | 4.6% (95) |
| New Jersey: | 0.5% (10,042) |
| Glassboro: | 4.5% (92) |
| New Jersey: | 2.1% (46,020) |
| Glassboro: | 3.9% (80) |
| New Jersey: | 3.7% (78,969) |
| Glassboro: | 3.5% (71) |
| New Jersey: | 4.8% (102,527) |
| Glassboro: | 3.3% (67) |
| New Jersey: | 1.5% (33,198) |
| Glassboro: | 3.1% (64) |
| New Jersey: | 4.2% (90,817) |
| Glassboro: | 2.9% (60) |
| New Jersey: | 0.8% (17,217) |
| Glassboro: | 2.9% (59) |
| New Jersey: | 1.3% (27,580) |
| Glassboro: | 2.7% (56) |
| New Jersey: | 0.9% (20,371) |
| Glassboro: | 2.5% (51) |
| New Jersey: | 4.4% (95,275) |
| Glassboro: | 2.4% (50) |
| New Jersey: | 0.3% (7,501) |
| Glassboro: | 2.4% (49) |
| New Jersey: | 0.0% (60) |
| Glassboro: | 2.2% (45) |
| New Jersey: | 1.2% (25,213) |
| Glassboro: | 1.9% (39) |
| New Jersey: | 0.7% (15,644) |
| Glassboro: | 1.9% (39) |
| New Jersey: | 2.2% (47,365) |
| Glassboro: | 1.5% (31) |
| New Jersey: | 0.5% (10,886) |
Place of birth for U.S.-born residents:
- This state: 14,238
- Other state: 6,513
- Northeast: 4,590
- Midwest: 406
- South: 1,324
- West: 180
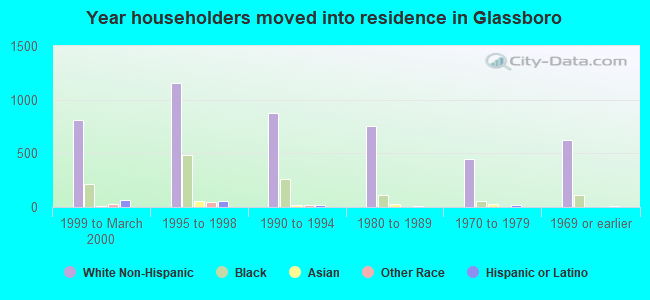
71.1% of Glassboro residents lived in the same house 1 years ago.
Out of people who lived in different houses, 32.3% lived in this county.
Out of people who lived in different counties, 82.5% lived in New Jersey.
| Glassboro: | 71.1% |
| State average: | 90.4% |
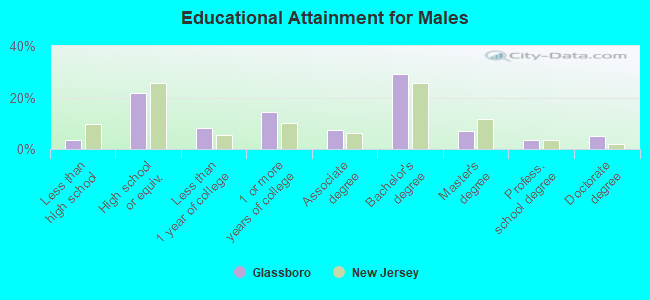
Education attainment for males 25 years and older:
- No schooling: 52
- Nursery to 4th grade: 8
- 5th and 6th grade: 0
- 7th and 8th grade: 7
- 9th grade: 45
- 10th grade: 53
- 11th grade: 32
- 12th grade, no diploma: 25
- High school graduate (or equivalency): 1,411
- Less than 1 year of college: 513
- Some college more than 1 year, no degree: 936
- Associate degree: 475
- Bachelor's degree: 1,885
- Master's degree: 448
- Professional school degree: 217
- Doctorate degree: 328
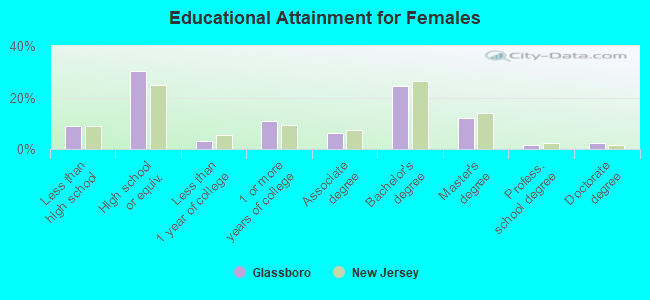
Education attainment for females 25 years and older:
- No schooling: 113
- Nursery to 4th grade: 0
- 5th and 6th grade: 54
- 7th and 8th grade: 14
- 9th grade: 0
- 10th grade: 60
- 11th grade: 255
- 12th grade, no diploma: 86
- High school graduate (or equivalency): 1,983
- Less than 1 year of college: 215
- Some college more than 1 year, no degree: 709
- Associate degree: 415
- Bachelor's degree: 1,603
- Master's degree: 774
- Professional school degree: 103
- Doctorate degree: 141
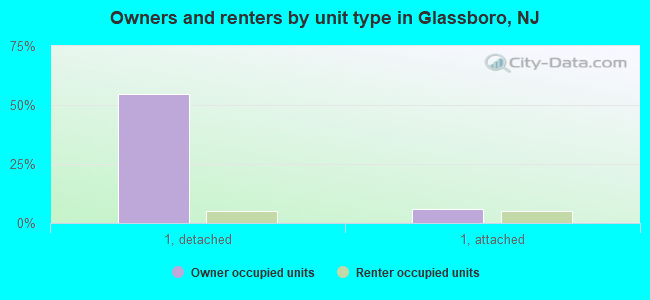
Housing units in structures:
- One, detached: 4,920
- One, attached: 779
- Two: 272
- 3 or 4: 258
- 5 to 9: 325
- 10 to 19: 913
- 20 to 49: 364
- 50 or more: 503
- Mobile homes: 11
Housing units lacking complete kitchen facilities in 2022: 0.8%
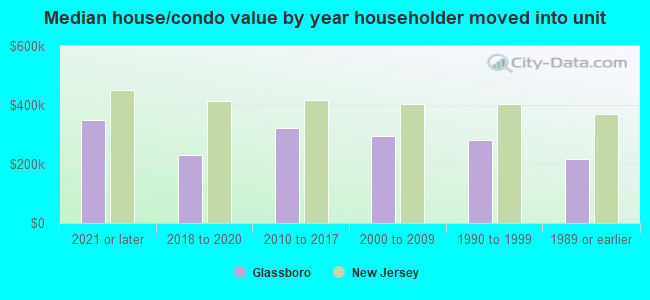
House/condo owner moved in on average 14 years ago
Renter moved in on average 2 years ago
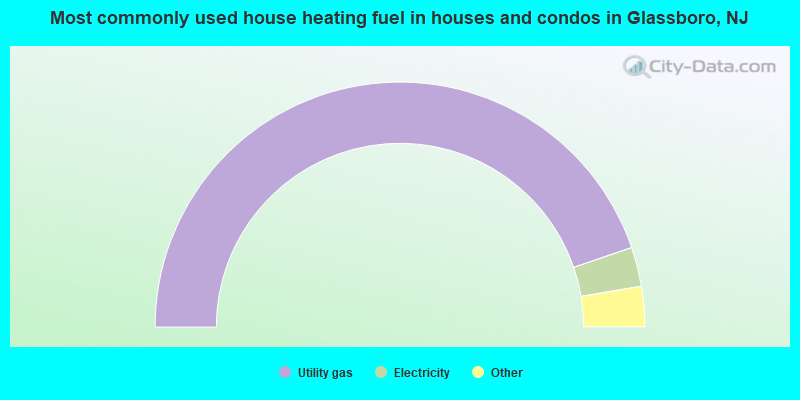
- 89.5%Utility gas
- 5.2%Electricity
- 3.6%Fuel oil, kerosene, etc.
- 0.8%Bottled, tank, or LP gas
- 0.7%Solar energy
- 0.2%Wood
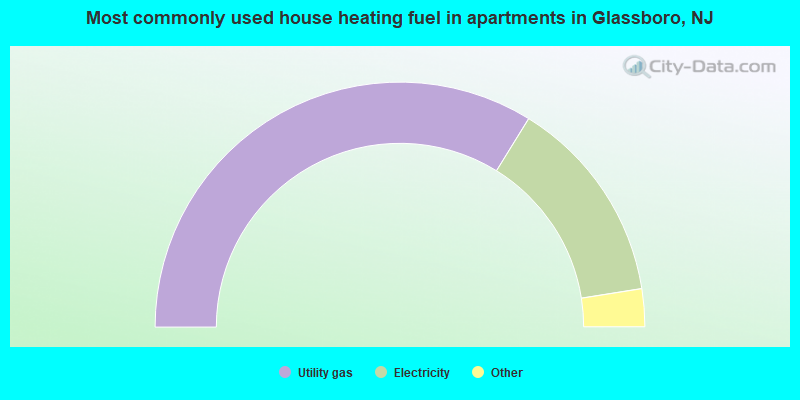
- 67.7%Utility gas
- 27.4%Electricity
- 3.3%Bottled, tank, or LP gas
- 1.7%Fuel oil, kerosene, etc.
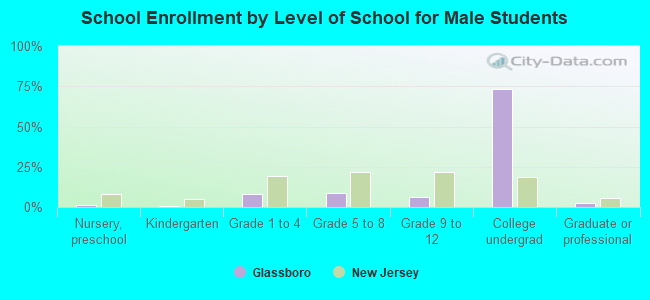
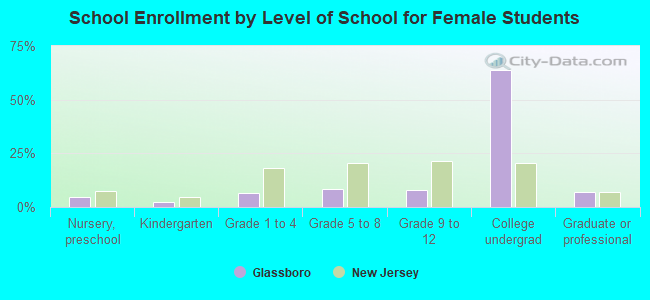
Private vs. public school enrollment:
| Here: | 5.4% |
| New Jersey: | 12.3% |
| Here: | 7.5% |
| New Jersey: | 13.1% |
| Here: | 15.4% |
| New Jersey: | 33.2% |