Gilbert, AZ (Arizona) Houses and Residents
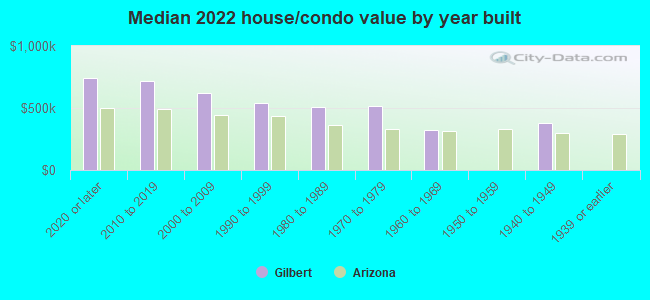
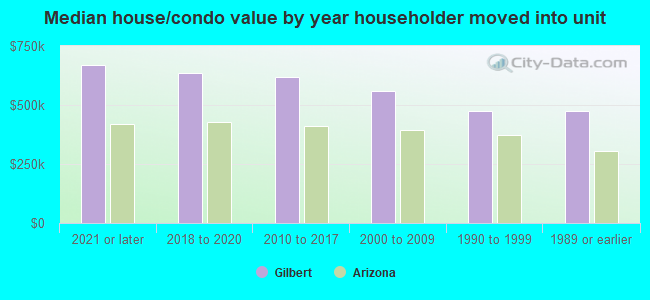
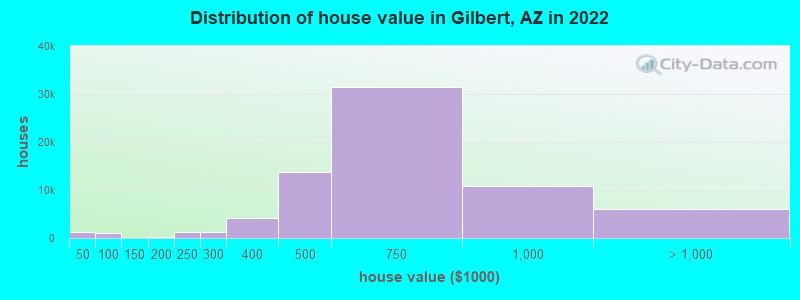
| Gilbert: | $602,000 |
| Arizona: | $402,800 |
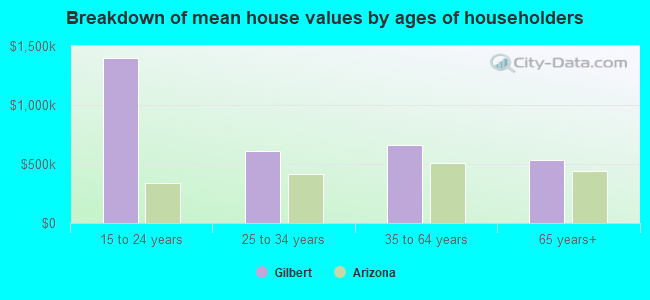
Mean price in 2022:
Detached houses: $631,022
Here: $631,022 State: $521,408 Townhouses or other attached units: $492,221
Here: $492,221 State: $387,465 In 2-unit structures: $296,652
Here: $296,652 State: $1,060,724 In 3-to-4-unit structures: $325,455
Here: $325,455 State: $342,505 In 5-or-more-unit structures: $275,292
Here: $275,292 State: $371,286 Mobile homes: $163,105
Here: $163,105 State: $141,516
Total population: 239,277 (Urban population: 109,592, Rural population: 344 (all nonfarm))
Houses: 98,350 (95,488 occupied: 70,783 owner occupied, 24,705 renter occupied)
| % of renters here: | 26% |
| State: | 33% |
Housing density: 2,290 houses/condos per square mile
Median price asked for vacant for-sale houses and condos in 2022: $436,657.
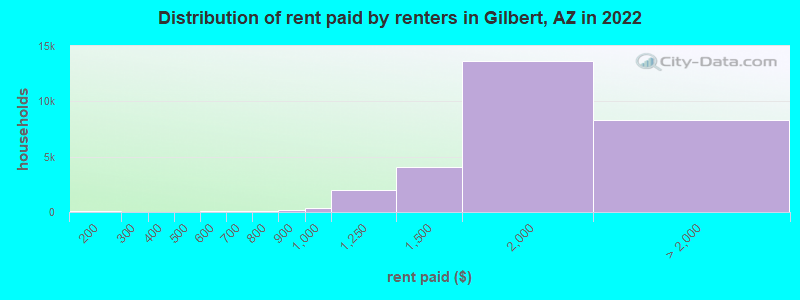
Median contract rent in 2022: $1,819 (lower quartile is $1,537, upper quartile is over $2,000)
Median rent asked for vacant for-rent units in 2022: $2,245
Median gross rent in Gilbert, AZ in 2022: over $2,000
Housing units in Gilbert with a mortgage: 54,421 (4,403 second mortgage, 0 home equity loan, 3,484 both second mortgage and home equity loan)
Houses without a mortgage: 529
Median household income for houses/condos with a mortgage: $139,048
Median household income for apartments without a mortgage: $91,764
Median monthly housing costs: $1,787
Compare current foreclosures in Gilbert, AZ:
| Photo | Address | Area | Beds / Baths | Price | Details |
|---|---|---|---|---|---|

|
#1
S Harmony Ave
Gilbert, AZ 85295
|
2,269 sq. feet
|
4 baths 4 beds |
show details | |

|
#2
S Hazel St
Gilbert, AZ 85296
|
3,518 sq. feet
|
3 baths 6 beds |
show details | |

|
#3
E Tradewind Dr
Gilbert, AZ 85234
|
1,757 sq. feet
|
3 baths 4 beds |
show details | |

|
#4
S Garnet Rd
Gilbert, AZ 85296
|
1,655 sq. feet
|
3 baths 3 beds |
show details | |

|
#5
S Rockwell St
Gilbert, AZ 85298
|
2,000 sq. feet
|
2 baths 4 beds |
show details | |

|
#6
E Lowell Ave
Gilbert, AZ 85295
|
3,771 sq. feet
|
4 baths 4 beds |
show details | |

|
#7
E Pinon Ct
Gilbert, AZ 85234
|
1,869 sq. feet
|
2 baths 3 beds |
show details | |

|
#8
N Laguna Dr
Gilbert, AZ 85233
|
1,572 sq. feet
|
3 baths 3 beds |
show details | |

|
#9
S Porter St
Gilbert, AZ 85295
|
2,548 sq. feet
|
2 baths 5 beds |
show details | |

|
#10
E Marcella Ln
Gilbert, AZ 85295
|
1,960 sq. feet
|
3 baths 3 beds |
show details |
| Photo | Address | Area | Beds / Baths | Price | Details |
|---|---|---|---|---|---|

|
#11
W Heather Ave
Gilbert, AZ 85233
|
1,773 sq. feet
|
3 baths 4 beds |
show details | |

|
#12
E Kesler Ln
Gilbert, AZ 85295
|
2,345 sq. feet
|
2 baths 4 beds |
show details | |

|
#13
S Moccasin Trl
Gilbert, AZ 85298
|
2,248 sq. feet
|
2 baths 4 beds |
show details | |

|
#14
E Clifton Ave
Gilbert, AZ 85295
|
2,146 sq. feet
|
3 baths 4 beds |
show details | |

|
#15
W Nautilus Dr
Gilbert, AZ 85233
|
3,251 sq. feet
|
3 baths 5 beds |
show details | |

|
#16
E Ranch Rd
Gilbert, AZ 85296
|
1,655 sq. feet
|
2 baths 3 beds |
show details | |

|
#17
N Racine Ct
Gilbert, AZ 85234
|
1,696 sq. feet
|
2 baths 3 beds |
show details | |

|
#18
E Melody Dr
Gilbert, AZ 85234
|
3,855 sq. feet
|
5 baths - beds |
show details | |

|
#19
E Libra Ave
Gilbert, AZ 85234
|
1,537 sq. feet
|
2 baths - beds |
show details | |

|
#20
E Redfield Rd
Gilbert, AZ 85234
|
2,335 sq. feet
|
2 baths - beds |
show details |
| Photo | Address | Area | Beds / Baths | Price | Details |
|---|---|---|---|---|---|

|
#21
W Rawhide Ave
Gilbert, AZ 85233
|
1,918 sq. feet
|
2 baths - beds |
show details | |

|
#22
E Mary Ln
Gilbert, AZ 85295
|
3,547 sq. feet
|
3 baths - beds |
show details | |

|
#23
E Gillcrest Rd
Gilbert, AZ 85298
|
2,658 sq. feet
|
2 baths - beds |
show details | |

|
#24
E Bart St
Gilbert, AZ 85295
|
1,488 sq. feet
|
2 baths - beds |
show details | |

|
#25
W Amoroso Dr
Gilbert, AZ 85233
|
1,851 sq. feet
|
2 baths - beds |
show details | |

|
#26
E Frye Rd
Gilbert, AZ 85295
|
2,262 sq. feet
|
3 baths - beds |
show details | |

|
#27
S Constellation Way
Gilbert, AZ 85295
|
1,693 sq. feet
|
2 baths - beds |
show details | |

|
#28
S Reber Ave # 85296
Gilbert, AZ 85296
|
1,982 sq. feet
|
3 baths - beds |
show details | |

|
#29
S Ironwood St
Gilbert, AZ 85296
|
2,324 sq. feet
|
4 baths - beds |
show details | |

|
#30
E La Costa Dr
Gilbert, AZ 85298
|
4,343 sq. feet
|
5 baths - beds |
show details |
| Photo | Address | Area | Beds / Baths | Price | Details |
|---|---|---|---|---|---|

|
#31
S Catalina St
Gilbert, AZ 85233
|
1,750 sq. feet
|
2 baths - beds |
show details | |

|
#32
E Bridgeport Pkwy
Gilbert, AZ 85295
|
1,692 sq. feet
|
2 baths - beds |
show details | |

|
#33
E Kesler Ln
Gilbert, AZ 85295
|
1,767 sq. feet
|
3 baths - beds |
show details | |

|
#34
E Erie St
Gilbert, AZ 85295
|
1,884 sq. feet
|
3 baths - beds |
show details | |

|
#35
S Vineyard Ave
Gilbert, AZ 85297
|
2,474 sq. feet
|
3 baths - beds |
show details | |

|
#36
E Ravenswood Dr
Gilbert, AZ 85298
|
4,413 sq. feet
|
5 baths - beds |
show details | |

|
#37
E Kesler Ln
Gilbert, AZ 85295
|
1,767 sq. feet
|
3 baths - beds |
show details | |

|
#38
N Cottonwood Dr
Gilbert, AZ 85234
|
1,678 sq. feet
|
3 baths - beds |
show details | |

|
#39
E Meadowview Dr
Gilbert, AZ 85298
|
3,618 sq. feet
|
4 baths - beds |
show details | |

|
#40
N Alder Ct
Gilbert, AZ 85233
|
970 sq. feet
|
2 baths - beds |
show details |
| Photo | Address | Area | Beds / Baths | Price | Details |
|---|---|---|---|---|---|

|
#41
N Greenfield Rd
Gilbert, AZ 85234
|
3,247 sq. feet
|
2 baths - beds |
show details | |

|
#42
E San Angelo Ave
Gilbert, AZ 85234
|
1,846 sq. feet
|
- baths - beds |
show details | |

|
#43
E Catclaw St
Gilbert, AZ 85296
|
1,776 sq. feet
|
- baths - beds |
show details | |

|
#44
S Hansen Dr
Gilbert, AZ 85295
|
- sq. feet
|
- baths - beds |
show details | |

|
#45
E Calle Del Norte Dr
Gilbert, AZ 85296
|
1,892 sq. feet
|
- baths - beds |
show details | |

|
#46
E Pecos Rd Apt 2012
Gilbert, AZ 85295
|
- sq. feet
|
- baths - beds |
show details | |

|
#47
E Bruce Ave
Gilbert, AZ 85234
|
- sq. feet
|
- baths - beds |
show details | |

|
#48
S Greenfield Rd Apt 1024
Gilbert, AZ 85295
|
- sq. feet
|
- baths - beds |
show details | |

|
#49
N Balboa Dr
Gilbert, AZ 85234
|
- sq. feet
|
- baths - beds |
show details | |

|
Check over 1 million property listings on Foreclosure.com!
|
browse all offers | |||

Latest news about housing in Gilbert, AZ collected exclusively by city-data.com from local newspapers, TV, and radio stations


Median year apartment built: 2005
Household type by relationship:
Households: 275,359- Male householders: 48,659 (6,831 living alone), Female householders: 46,829 (8,683 living alone)
57,454 spouses (56,970 opposite-sex spouses), 7,725 unmarried partners, (7,422 opposite-sex unmarried partners), 93,697 children (84,322 natural, 4,921 adopted, 4,454 stepchildren), 3,177 grandchildren, 1,807 brothers or sisters, 3,887 parents, 71 foster children, 2,849 other relatives, 7,594 non-relatives
- In group quarters: 1,610
Size of family households: 25,000 2-persons, 19,598 3-persons, 15,683 4-persons, 7,734 5-persons, 3,060 6-persons, 1,307 7-or-more-persons.
Size of nonfamily households: 15,514 1-person, 5,525 2-persons, 1,719 3-persons, 53 4-persons, 295 5-persons.
55,639 married couples with children.
15,934 single-parent households (5,606 men, 10,328 women).
85.0% of residents of Gilbert speak English at home.
7.2% of residents speak Spanish at home (79% speak English very well, 12% speak English well, 7% speak English not well, 2% don't speak English at all).
2.5% of residents speak other Indo-European language at home (82% speak English very well, 12% speak English well, 5% speak English not well).
3.9% of residents speak Asian or Pacific Island language at home (62% speak English very well, 20% speak English well, 15% speak English not well, 2% don't speak English at all).
1.3% of residents speak other language at home (86% speak English very well, 10% speak English well, 4% speak English not well).
Foreign born population: 28,641 (10.4%)
(74.0% of them are naturalized citizens)
| Here: | 6.6 |
| State: | 6.0 |
| Here: | 4.6 |
| State: | 4.1 |
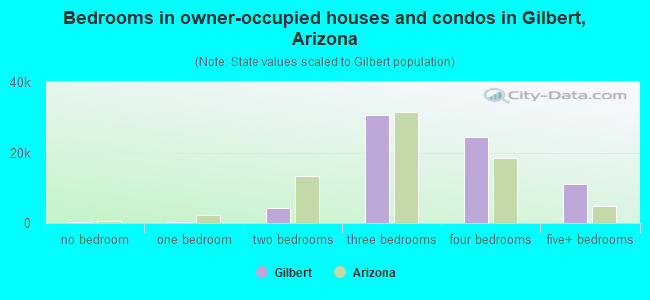
- Bedrooms in owner-occupied houses and condos in Gilbert, Arizona
- 225no bedroom
- 3011 bedroom
- 4,2842 bedrooms
- 30,5753 bedrooms
- 24,4024 bedrooms
- 10,9965+ bedrooms
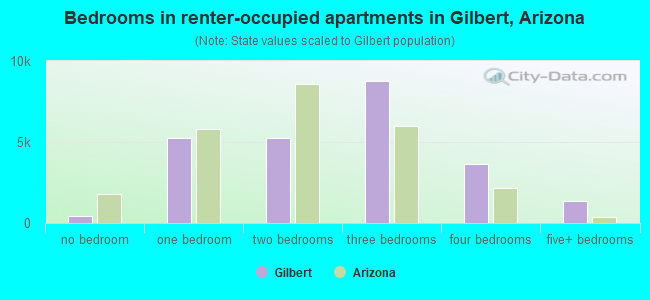
- Bedrooms in renter-occupied apartments in Gilbert, Arizona
- 435no bedroom
- 5,2541 bedroom
- 5,2202 bedrooms
- 8,7913 bedrooms
- 3,6544 bedrooms
- 1,3515+ bedrooms
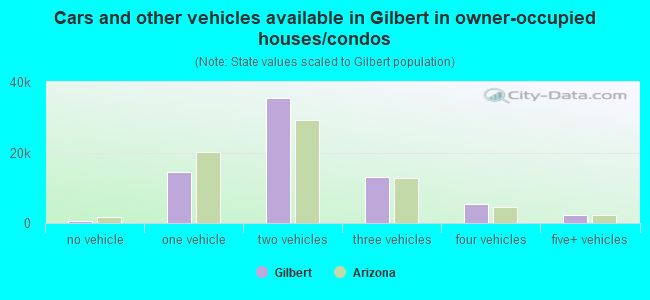
- Cars and other vehicles available in Gilbert in owner-occupied houses/condos
- 465no vehicle
- 14,4261 vehicle
- 35,3292 vehicles
- 13,0713 vehicles
- 5,3404 vehicles
- 2,1525+ vehicles
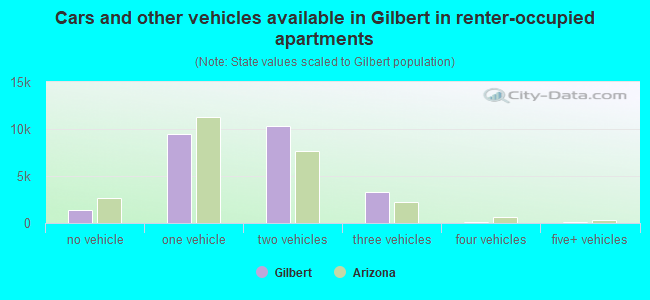
- Cars and other vehicles available in Gilbert in renter-occupied apartments
- 1,387no vehicle
- 9,4701 vehicle
- 10,3392 vehicles
- 3,3093 vehicles
- 1374 vehicles
- 635+ vehicles
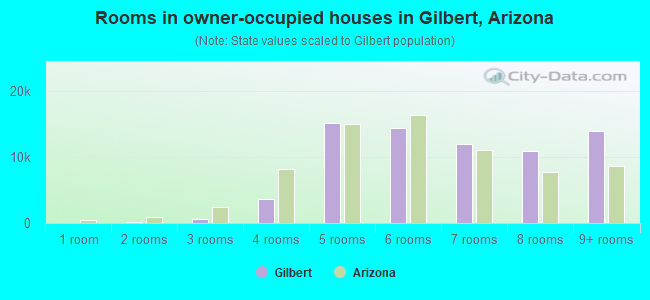
- Rooms in owner-occupied houses in Gilbert, Arizona
- 471 room
- 2172 rooms
- 5933 rooms
- 3,5744 rooms
- 15,1065 rooms
- 14,3586 rooms
- 11,9307 rooms
- 10,9508 rooms
- 14,0089+ rooms
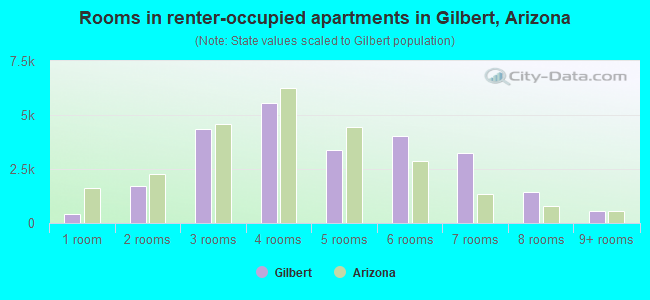
- Rooms in renter-occupied apartments in Gilbert, Arizona
- 4351 room
- 1,7252 rooms
- 4,3363 rooms
- 5,5574 rooms
- 3,3875 rooms
- 4,0086 rooms
- 3,2577 rooms
- 1,4368 rooms
- 5649+ rooms
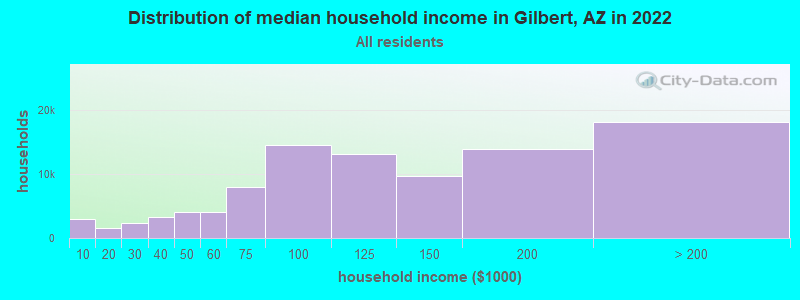
Gilbert, AZ household income distribution

- 2,910Less than $10,000
- 1,633$10,000 to $19,999
- 2,371$20,000 to $29,999
- 3,344$30,000 to $39,999
- 4,001$40,000 to $49,999
- 4,125$50,000 to $59,999
- 7,976$60,000 to $74,999
- 14,470$75,000 to $99,999
- 13,032$100,000 to $124,999
- 9,616$125,000 to $149,999
- 13,911$150,000 to $199,999
- 18,099$200,000 or more
Home value of owner - occupied houses in 2022 in Gilbert, AZ
-
- 413Less than $10,000
- 54$10,000 to $14,999
- 99$25,000 to $29,999
- 43$30,000 to $34,999
- 378$35,000 to $39,999
- 214$40,000 to $49,999
- 380$50,000 to $59,999
- 195$60,000 to $69,999
- 184$70,000 to $79,999
- 81$90,000 to $99,999
- 57$100,000 to $124,999
- 57$150,000 to $174,999
- 126$175,000 to $199,999
- 1,264$200,000 to $249,999
- 1,195$250,000 to $299,999
- 4,122$300,000 to $399,999
- 13,724$400,000 to $499,999
- 31,377$500,000 to $749,999
- 10,750$750,000 to $999,999
- 4,105$1,000,000 to $1,499,999
- 1,048$1,500,000 to $1,999,999
- 917$2,000,000 or more
Rent paid by renters in 2022 in Gilbert, AZ
-
- 48Less than $100
- 30$100 to $149
- 100$150 to $199
- 17$250 to $299
- 31$350 to $399
- 41$500 to $549
- 34$550 to $599
- 51$600 to $649
- 34$650 to $699
- 46$700 to $749
- 65$750 to $799
- 142$800 to $899
- 350$900 to $999
- 1,949$1,000 to $1,249
- 4,080$1,250 to $1,499
- 13,656$1,500 to $1,999
- 5,343$2,000 to $2,499
- 1,557$2,500 to $2,999
- 473$3,000 to $3,499
- 264$3,500 or more
- 675No cash rent
Percentage of workers working in this county: 96.4%
Number of people working at home: 37,338 (26.2% of all workers)
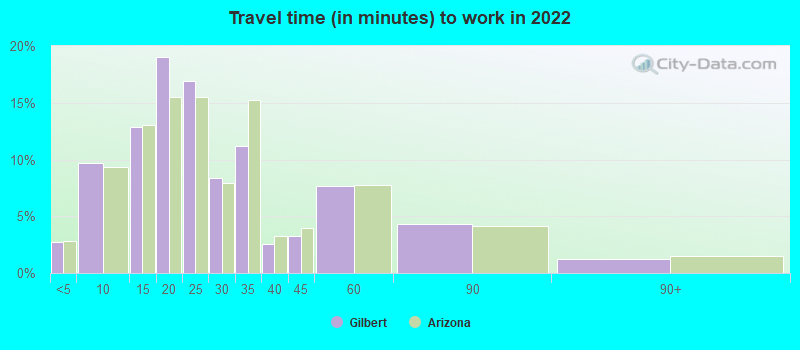
Travel time to work (commute)
- Less than 5 minutes: 2,469
- 5 to 9 minutes: 9,348
- 10 to 14 minutes: 9,472
- 15 to 19 minutes: 15,102
- 20 to 24 minutes: 16,947
- 25 to 29 minutes: 12,811
- 30 to 34 minutes: 15,568
- 35 to 39 minutes: 4,291
- 40 to 44 minutes: 4,137
- 45 to 59 minutes: 8,904
- 60 to 89 minutes: 4,810
- 90 or more minutes: 1,345
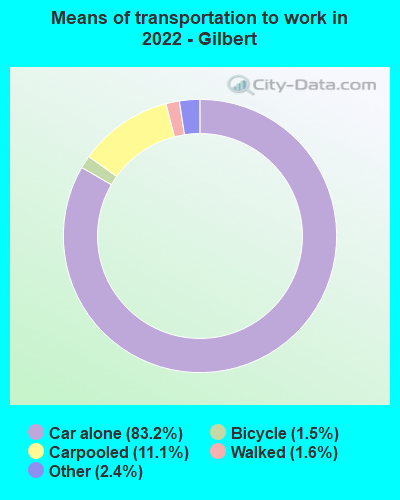
Means of transportation to work:
- Drove a car alone: 61,281 (55.2%)
- Carpooled: 8,202 (7.4%)
- Bus: 17 (0.0%)
- Light rail, streetcar or trolley: 56 (0.1%)
- Taxi: 1,784 (1.6%)
- Bicycle: 1,119 (1.0%)
- Walked: 1,185 (1.1%)
- Worked at home: 37,338 (33.6%)
- Unemployment by race in 2022
- Unemployment rate for White non-Hispanic residents
- 2.8%Males
- 3.6%Females
- Unemployment rate for Black residents
- 13.1%Males
- 5.2%Females
- Unemployment rate for American Indian and Alaska Native residents
- 1.9%Males
- Unemployment rate for Asian residents
- 0.8%Males
- 1.2%Females
- Unemployment rate for other race residents
- 2.7%Males
- 3.7%Females
- Unemployment rate for two or more race residents
- 0.5%Males
- 8.2%Females
- Unemployment rate for Hispanic or Latino residents
- 3.2%Males
- 3.1%Females
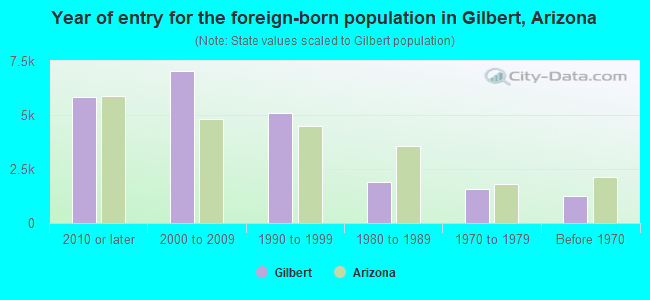
- Year of entry for the foreign-born population in Gilbert, Arizona
- 5,8422010 or later
- 7,0192000 to 2009
- 5,0711990 to 1999
- 1,9191980 to 1989
- 1,5531970 to 1979
- 1,270Before 1970
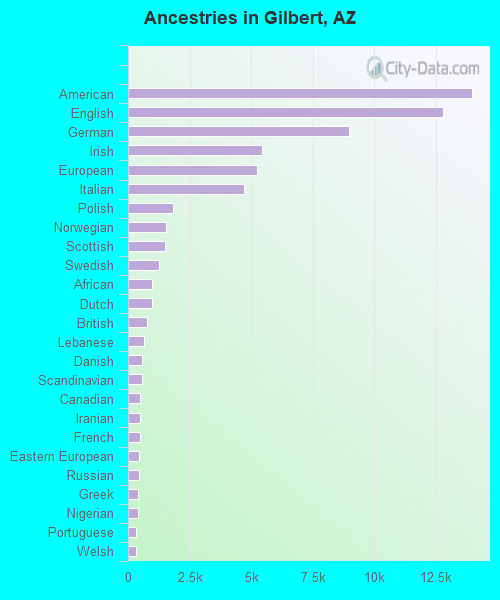
First ancestries reported:
- American: 13,970 (11.9%)
- English: 12,791 (10.9%)
- German: 8,985 (7.7%)
- Irish: 5,429 (4.6%)
- European: 5,228 (4.5%)
- Italian: 4,725 (4.0%)
- Polish: 1,834 (1.6%)
- Norwegian: 1,554 (1.3%)
- Scottish: 1,490 (1.3%)
- Swedish: 1,249 (1.1%)
- African: 980 (0.8%)
- Dutch: 956 (0.8%)
- British: 757 (0.6%)
- Lebanese: 640 (0.5%)
- Danish: 582 (0.5%)
- Scandinavian: 574 (0.5%)
- Canadian: 502 (0.4%)
- Iranian: 476 (0.4%)
- French: 475 (0.4%)
- Eastern European: 446 (0.4%)
- Russian: 445 (0.4%)
- Greek: 394 (0.3%)
- Nigerian: 388 (0.3%)
- Portuguese: 334 (0.3%)
- Welsh: 334 (0.3%)
- Slavic: 308 (0.3%)
- French Canadian: 298 (0.3%)
- Scotch-Irish: 296 (0.3%)
- Turkish: 270 (0.2%)
- Czech: 266 (0.2%)
- Northern European: 245 (0.2%)
- Assyrian: 236 (0.2%)
- Sudanese: 232 (0.2%)
- Hungarian: 230 (0.2%)
- Serbian: 223 (0.2%)
- Iraqi: 204 (0.2%)
- Egyptian: 185 (0.2%)
- Romanian: 184 (0.2%)
- Ukrainian: 180 (0.2%)
- Finnish: 162 (0.1%)
- Yugoslavian: 148 (0.1%)
- Albanian: 147 (0.1%)
- Croatian: 139 (0.1%)
- Australian: 136 (0.1%)
- Haitian: 130 (0.1%)
- Slovak: 128 (0.1%)
- Belgian: 92 (0.08%)
- Lithuanian: 92 (0.08%)
- Swiss: 91 (0.08%)
- Brazilian: 81 (0.07%)
- Liberian: 80 (0.07%)
- Czechoslovakian: 73 (0.06%)
- Ethiopian: 73 (0.06%)
- Kenyan: 73 (0.06%)
- Palestinian: 66 (0.06%)
- Arab: 63 (0.05%)
- Bulgarian: 58 (0.05%)
- Israeli: 42 (0.04%)
- Ghanaian: 40 (0.03%)
- Austrian: 24 (0.02%)
- Jamaican: 24 (0.02%)
- German Russian: 21 (0.02%)
- Basque: 17 (0.01%)
- Syrian: 17 (0.01%)
- New Zealander: 14 (0.01%)
- Pennsylvania German: 13 (0.01%)
- South African: 11 (0.01%)
- Moroccan: 10 (0.01%)
- Trinidadian and Tobagonian: 9 (0.01%)
- Cajun: 8 (0.01%)
- Armenian: 7 (0.01%)
- Belizean: 6 (0.01%)
Most common places of birth for foreign-born residents (%):
| Gilbert: | 17.2% (4,582) |
| Arizona: | 53.4% (500,086) |
| Gilbert: | 9.1% (2,416) |
| Arizona: | 2.1% (19,199) |
| Gilbert: | 8.7% (2,327) |
| Arizona: | 3.2% (30,378) |
| Gilbert: | 8.1% (2,151) |
| Arizona: | 4.5% (41,719) |
| Gilbert: | 5.9% (1,584) |
| Arizona: | 4.3% (40,102) |
| Gilbert: | 4.9% (1,304) |
| Arizona: | 2.3% (21,275) |
| Gilbert: | 3.2% (849) |
| Arizona: | 0.3% (2,754) |
| Gilbert: | 2.6% (693) |
| Arizona: | 1.2% (11,275) |
| Gilbert: | 2.3% (604) |
| Arizona: | 0.6% (6,077) |
| Gilbert: | 2.2% (577) |
| Arizona: | 0.2% (1,684) |
| Gilbert: | 2.0% (522) |
| Arizona: | 1.1% (9,889) |
| Gilbert: | 1.9% (512) |
| Arizona: | 1.0% (9,335) |
| Gilbert: | 1.7% (448) |
| Arizona: | 1.5% (14,058) |
| Gilbert: | 1.6% (424) |
| Arizona: | 0.2% (1,468) |
| Gilbert: | 1.6% (420) |
| Arizona: | 0.2% (1,831) |
Place of birth for U.S.-born residents:
- This state: 109,471
- Other state: 132,983
- Northeast: 15,996
- Midwest: 45,429
- South: 17,198
- West: 54,360
85.9% of Gilbert residents lived in the same house 1 years ago.
Out of people who lived in different houses, 35.7% lived in this county.
Out of people who lived in different counties, 24.5% lived in Arizona.
| Gilbert: | 85.9% |
| State average: | 86.0% |
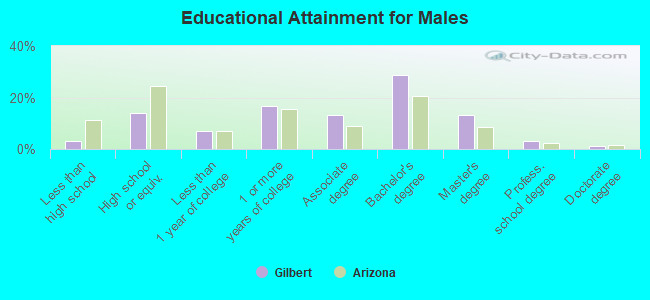
Education attainment for males 25 years and older:
- No schooling: 553
- Nursery to 4th grade: 0
- 5th and 6th grade: 135
- 7th and 8th grade: 229
- 9th grade: 155
- 10th grade: 487
- 11th grade: 407
- 12th grade, no diploma: 539
- High school graduate (or equivalency): 12,015
- Less than 1 year of college: 6,089
- Some college more than 1 year, no degree: 14,380
- Associate degree: 11,180
- Bachelor's degree: 24,468
- Master's degree: 11,130
- Professional school degree: 2,820
- Doctorate degree: 917
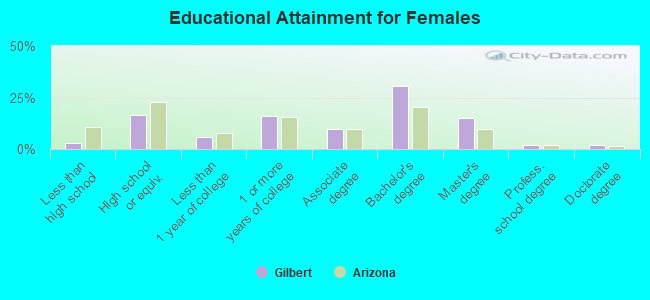
Education attainment for females 25 years and older:
- No schooling: 805
- Nursery to 4th grade: 0
- 5th and 6th grade: 77
- 7th and 8th grade: 346
- 9th grade: 130
- 10th grade: 587
- 11th grade: 189
- 12th grade, no diploma: 548
- High school graduate (or equivalency): 15,368
- Less than 1 year of college: 5,401
- Some college more than 1 year, no degree: 14,709
- Associate degree: 8,875
- Bachelor's degree: 28,565
- Master's degree: 13,844
- Professional school degree: 1,738
- Doctorate degree: 1,943


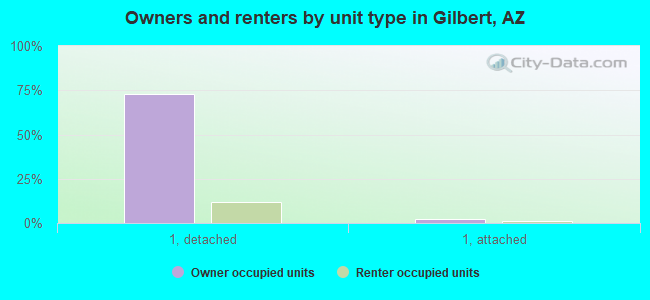
Housing units in structures:
- One, detached: 81,212
- One, attached: 3,725
- Two: 163
- 3 or 4: 682
- 5 to 9: 1,485
- 10 to 19: 3,312
- 20 to 49: 761
- 50 or more: 6,771
- Mobile homes: 239
Housing units lacking complete kitchen facilities in 2022: 0.5%
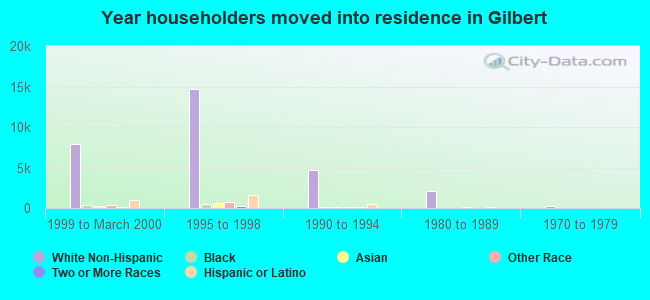
House/condo owner moved in on average 8 years ago
Renter moved in on average 1 years ago
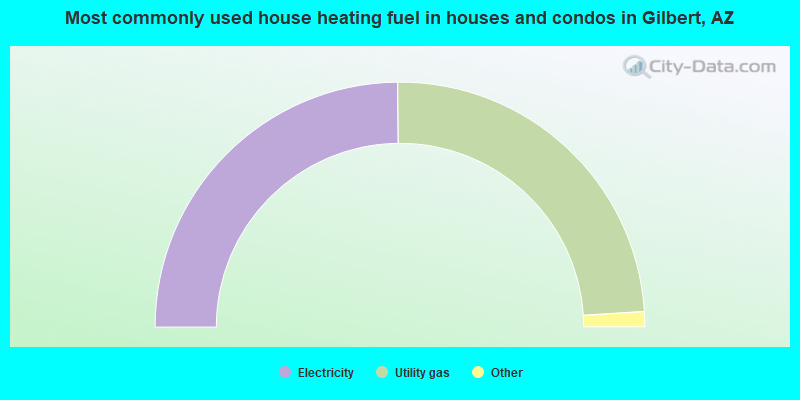
- 49.7%Electricity
- 48.3%Utility gas
- 0.8%Bottled, tank, or LP gas
- 0.8%Solar energy
- 0.1%No fuel used
- 0.1%Wood
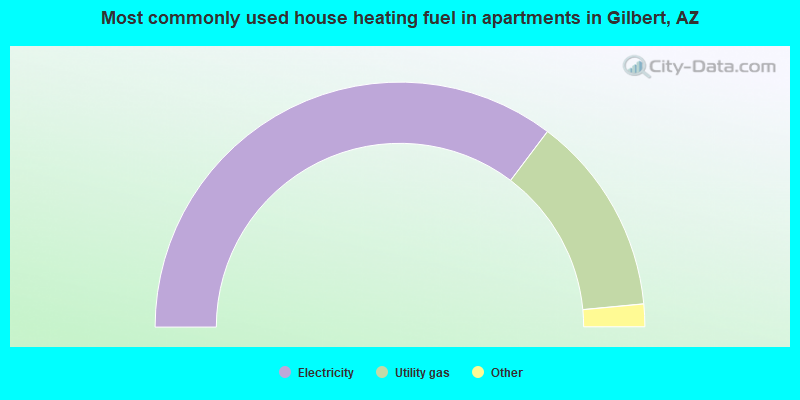
- 70.6%Electricity
- 26.4%Utility gas
- 1.7%Bottled, tank, or LP gas
- 0.5%No fuel used
- 0.3%Fuel oil, kerosene, etc.
- 0.3%Other fuel
- 0.1%Wood
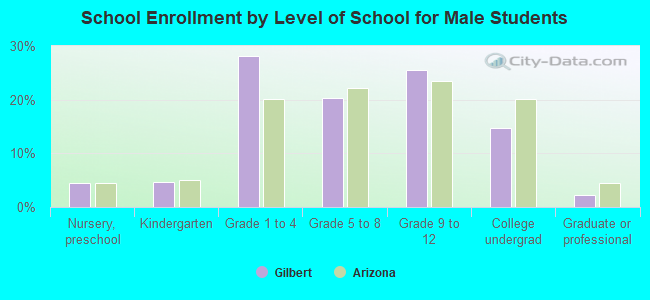
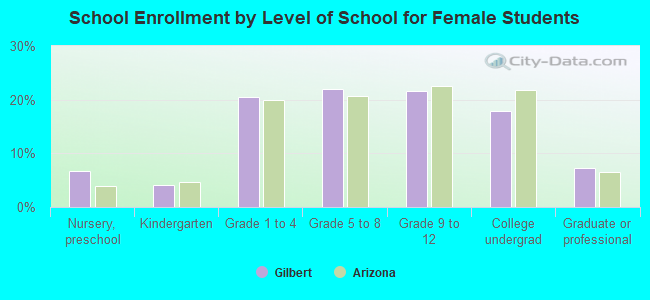
Private vs. public school enrollment:
| Here: | 12.2% |
| Arizona: | 10.4% |
| Here: | 6.6% |
| Arizona: | 8.8% |
| Here: | 13.8% |
| Arizona: | 13.1% |