Gainesville, FL (Florida) Houses and Residents
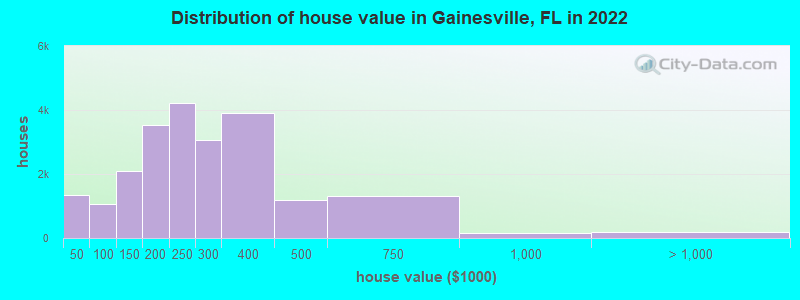
Estimated median house or condo value in 2022: $240,600 (it was $83,700 in 2000 )
Gainesville:
$240,600Florida:
$354,100
Lower value quartile - upper value quartile: $179,600 - $337,700Mean price in 2022: Detached houses: $305,078 Here:
$305,078State:
$500,941
Townhouses or other attached units: $209,738 Here:
$209,738State:
$370,869
In 2-unit structures: $111,300 Here:
$111,300State:
$423,188
In 3-to-4-unit structures: $166,732 Here:
$166,732State:
$309,944
In 5-or-more-unit structures: $211,101 Here:
$211,101State:
$447,145
Mobile homes: $50,394 Here:
$50,394State:
$113,202
Total population: 128,460 (Urban population: 94,451, Rural population: 1,154 (all nonfarm) )
Houses: 66,582 (60,343 occupied: 23,415 owner occupied, 36,928 renter occupied )
% of renters here:
61%State:
33%
Housing density: 1,382 houses/condos per square mile
Median price asked for vacant for-sale houses and condos in 2022: $234,281.
Median contract rent in 2022: $1,068 (lower quartile is $760, upper quartile is $1,394)
Median rent asked for vacant for-rent units in 2022: $881
Median gross rent in Gainesville, FL in 2022: $1,212
Housing units in Gainesville with a mortgage: 14,285 (1,092 second mortgage, 0 home equity loan, 1,031 both second mortgage and home equity loan )Houses without a mortgage: 119
Median household income for houses/condos with a mortgage: $81,392
Median household income for apartments without a mortgage: $73,740
Median monthly housing costs: $1,162
Data:
Median house or condo value ($)
Median house or condo value ($ change since 2000)
Median house or condo value ($) - White
Median house or condo value ($) - Black or African American
Median house or condo value ($) - Asian
Median house or condo value ($) - Hispanic or Latino
Median house or condo value ($) - American Indian and Alaska Native
Median house or condo value ($) - Multirace
Median house or condo value ($) - Other Race
Median price asked for mobile homes ($)
Household density (households per square mile)
Mean house or condo value by units in structure - 1, detached ($)
Mean house or condo value by units in structure - 1, attached ($)
Mean house or condo value by units in structure - 2 ($)
Mean house or condo value by units in structure by units in structure - 3 or 4 ($)
Mean house or condo value by units in structure - 5 or more ($)
Mean house or condo value by units in structure - Boat, RV, van, etc. ($)
Mean house or condo value by units in structure - Mobile home ($)
Median contract rent ($)
Median contract rent - Lower quartile ($)
Median contract rent - Upper quartile ($)
Median gross rent ($)
Urban houses (%)
Rural houses (%)
Houses occupied (%)
Houses occupied (% change since 2000)
Houses owner occupied (%)
Houses owner occupied (% change since 2000)
Houses renter occupied (%)
Houses renter occupied (% change since 2000)
Vacant housing units - For rent (%)
Vacant housing units - For rent (% change since 2000)
Vacant housing units - For sale only (%)
Vacant housing units - For sale only (% change since 2000)
Vacant housing units - Rented or sold, not occupied (%)
Vacant housing units - Rented or sold, not occupied (% change since 2000)
Vacant housing units - For seasonal, recreational, or occasional use (%)
Vacant housing units - For seasonal, recreational, or occasional use (% change since 2000)
Vacant housing units - For migrant workers (%)
Vacant housing units - For migrant workers (% change since 2000)
Vacant housing units - Other vacant (%)
Vacant housing units - Other vacant (% change since 2000)
Median monthly housing costs ($)
Median household income for houses/condos with a mortgage ($)
Median household income for houses/condos without a mortgage ($)
Median household income ($)
Median household income ($) - White
Median household income ($) - Black or African American
Median household income ($) - Asian
Median household income ($) - Hispanic or Latino
Median household income ($) - American Indian and Alaska Native
Median household income ($) - Multirace
Median household income ($) - Other Race
Mortgage status - with mortgage (%)
Mortgage status - with second mortgage (%)
Mortgage status - with home equity loan (%)
Mortgage status - with both second mortgage and home equity loan (%)
Mortgage status - without a mortgage (%)
Median year house/condo built
Median year apartment built
Household type by relationship - Male householder living alone (%)
Household type by relationship - Male householder not living alone (%)
Household type by relationship - Female householder living alone (%)
Household type by relationship - Female householder not living alone (%)
Household type by relationship - Opposite-Sex spouse (%)
Household type by relationship - Same-Sex spouse (%)
Household type by relationship - Opposite-Sex unmarried partner (%)
Household type by relationship - Same-Sex unmarried partner (%)
Household type by relationship - In group quarters (%)
Size of family households - 2-person household (%)
Size of family households - 3-person household (%)
Size of family households - 4-person household (%)
Size of family households - 5-person household (%)
Size of family households - 6-person household (%)
Size of family households - 7-or-more-person household (%)
Size of nonfamily households - 1-person household (%)
Size of nonfamily households - 2-person household (%)
Size of nonfamily households - 3-person household (%)
Size of nonfamily households - 4-person household (%)
Size of nonfamily households - 5-person household (%)
Size of nonfamily households - 6-person household (%)
Size of nonfamily households - 7-or-moreperson household (%)
Year house built - Built 2010 or later (%)
Year house built - Built 2000 to 2009 (%)
Year house built - Built 1990 to 1999 (%)
Year house built - Built 1980 to 1989 (%)
Year house built - Built 1970 to 1979 (%)
Year house built - Built 1960 to 1969 (%)
Year house built - Built 1950 to 1959 (%)
Year house built - Built 1940 to 1949 (%)
Year house built - Built 1939 or earlier (%)
Median number of rooms in houses and condos
Median number of rooms in apartments
Median number of bedrooms in owner occupied houses
Mean number of bedrooms in owner occupied houses
Median number of bedrooms in renter occupied houses
Mean number of bedrooms in renter occupied houses
Median number of vehichles in owner occupied houses
Mean number of vehichles in owner occupied houses
Median number of vehichles in renter occupied houses
Mean number of vehichles in renter occupied houses
Rooms in owner-occupied houses - 1 room (%)
Rooms in owner-occupied houses - 2 rooms (%)
Rooms in owner-occupied houses - 3 rooms (%)
Rooms in owner-occupied houses - 4 rooms (%)
Rooms in owner-occupied houses - 5 rooms (%)
Rooms in owner-occupied houses - 6 rooms (%)
Rooms in owner-occupied houses - 7 rooms (%)
Rooms in owner-occupied houses - 8 rooms (%)
Rooms in owner-occupied houses - 9+ rooms (%)
Rooms in renter-occupied houses - 1 room (%)
Rooms in renter-occupied houses - 2 rooms (%)
Rooms in renter-occupied houses - 3 rooms (%)
Rooms in renter-occupied houses - 4 rooms (%)
Rooms in renter-occupied houses - 5 rooms (%)
Rooms in renter-occupied houses - 6 rooms (%)
Rooms in renter-occupied houses - 7 rooms (%)
Rooms in renter-occupied houses - 8 rooms (%)
Rooms in renter-occupied houses - 9+ rooms (%)
Bedrooms in owner-occupied houses - no bedrooms (%)
Bedrooms in owner-occupied houses - 1 bedroom (%)
Bedrooms in owner-occupied houses - 2 bedrooms (%)
Bedrooms in owner-occupied houses - 3 bedrooms (%)
Bedrooms in owner-occupied houses - 4 bedrooms (%)
Bedrooms in owner-occupied houses - 5+ bedrooms (%)
Bedrooms in renter-occupied houses - no bedrooms (%)
Bedrooms in renter-occupied houses - 1 bedroom (%)
Bedrooms in renter-occupied houses - 2 bedrooms (%)
Bedrooms in renter-occupied houses - 3 bedrooms (%)
Bedrooms in renter-occupied houses - 4 bedrooms (%)
Bedrooms in renter-occupied houses - 5+ bedrooms (%)
Vehicles available in owner-occupied houses - no vehicle available (%)
Vehicles available in owner-occupied houses - 1 vehicle available(%)
Vehicles available in owner-occupied houses - 2 Vehicles available (%)
Vehicles available in owner-occupied houses - 3 Vehicles available (%)
Vehicles available in owner-occupied houses - 4 Vehicles available (%)
Vehicles available in owner-occupied houses - 5+ Vehicles available (%)
Vehicles available in renter-occupied houses - no vehicle available (%)
Vehicles available in renter-occupied houses - 1 vehicle available (%)
Vehicles available in renter-occupied houses - 2 Vehicles available (%)
Vehicles available in renter-occupied houses - 3 Vehicles available (%)
Vehicles available in renter-occupied houses - 4 Vehicles available (%)
Vehicles available in renter-occupied houses - 5+ Vehicles available (%)
Housing units in structures - 1, detached (%)
Housing units in structures - 1, attached (%)
Housing units in structures - 2 (%)
Housing units in structures - 3 or 4 (%)
Housing units in structures - 5 to 9 (%)
Housing units in structures - 10 to 19 (%)
Housing units in structures - 20 to 49 (%)
Housing units in structures - 50 or more (%)
Housing units in structures - Mobile home (%)
Housing units in structures - Boat, RV, van, etc. (%)
Housing units in structures - Owners - 1, detached (%)
Housing units in structures - Owners - 1, attached (%)
Housing units in structures - Owners - 2 (%)
Housing units in structures - Owners - 3 or 4 (%)
Housing units in structures - Owners - 5 to 9 (%)
Housing units in structures - Owners - 10 to 19 (%)
Housing units in structures - Owners - 20 to 49 (%)
Housing units in structures - Owners - 50 or more (%)
Housing units in structures - Owners - Mobile home (%)
Housing units in structures - Owners - Boat, RV, van, etc. (%)
Housing units in structures - Renters - 1, detached (%)
Housing units in structures - Renters - 1, attached (%)
Housing units in structures - Renters - 2 (%)
Housing units in structures - Renters - 3 or 4 (%)
Housing units in structures - Renters - 5 to 9 (%)
Housing units in structures - Renters - 10 to 19 (%)
Housing units in structures - Renters - 20 to 49 (%)
Housing units in structures - Renters - 50 or more (%)
Housing units in structures - Renters - Mobile home (%)
Housing units in structures - Renters - Boat, RV, van, etc. (%)
House/condo owner moved in on average (years ago)
Renter moved in on average (years ago)
Year householder moved into unit - Moved in 1999 to March 2000 (%)
Year householder moved into unit - Moved in 1999 to March 2000 (%) - White
Year householder moved into unit - Moved in 1999 to March 2000 (%) - Black or African American
Year householder moved into unit - Moved in 1999 to March 2000 (%) - Asian
Year householder moved into unit - Moved in 1999 to March 2000 (%) - Hispanic or Latino
Year householder moved into unit - Moved in 1999 to March 2000 (%) - American Indian and Alaska Native
Year householder moved into unit - Moved in 1999 to March 2000 (%) - Multirace
Year householder moved into unit - Moved in 1999 to March 2000 (%) - Other Race
Year householder moved into unit - Moved in 1995 to 1998 (%)
Year householder moved into unit - Moved in 1995 to 1998 (%) - White
Year householder moved into unit - Moved in 1995 to 1998 (%) - Black or African American
Year householder moved into unit - Moved in 1995 to 1998 (%) - Asian
Year householder moved into unit - Moved in 1995 to 1998 (%) - Hispanic or Latino
Year householder moved into unit - Moved in 1995 to 1998 (%) - American Indian and Alaska Native
Year householder moved into unit - Moved in 1995 to 1998 (%) - Multirace
Year householder moved into unit - Moved in 1995 to 1998 (%) - Other Race
Year householder moved into unit - Moved in 1990 to 1994 (%)
Year householder moved into unit - Moved in 1990 to 1994 (%) - White
Year householder moved into unit - Moved in 1990 to 1994 (%) - Black or African American
Year householder moved into unit - Moved in 1990 to 1994 (%) - Asian
Year householder moved into unit - Moved in 1990 to 1994 (%) - Hispanic or Latino
Year householder moved into unit - Moved in 1990 to 1994 (%) - American Indian and Alaska Native
Year householder moved into unit - Moved in 1990 to 1994 (%) - Multirace
Year householder moved into unit - Moved in 1990 to 1994 (%) - Other Race
Year householder moved into unit - Moved in 1980 to 1989 (%)
Year householder moved into unit - Moved in 1980 to 1989 (%) - White
Year householder moved into unit - Moved in 1980 to 1989 (%) - Black or African American
Year householder moved into unit - Moved in 1980 to 1989 (%) - Asian
Year householder moved into unit - Moved in 1980 to 1989 (%) - Hispanic or Latino
Year householder moved into unit - Moved in 1980 to 1989 (%) - American Indian and Alaska Native
Year householder moved into unit - Moved in 1980 to 1989 (%) - Multirace
Year householder moved into unit - Moved in 1980 to 1989 (%) - Other Race
Year householder moved into unit - Moved in 1970 to 1979 (%)
Year householder moved into unit - Moved in 1970 to 1979 (%) - White
Year householder moved into unit - Moved in 1970 to 1979 (%) - Black or African American
Year householder moved into unit - Moved in 1970 to 1979 (%) - Asian
Year householder moved into unit - Moved in 1970 to 1979 (%) - Hispanic or Latino
Year householder moved into unit - Moved in 1970 to 1979 (%) - American Indian and Alaska Native
Year householder moved into unit - Moved in 1970 to 1979 (%) - Multirace
Year householder moved into unit - Moved in 1970 to 1979 (%) - Other Race
Year householder moved into unit - Moved in 1969 or earlier (%)
Year householder moved into unit - Moved in 1969 or earlier (%) - White
Year householder moved into unit - Moved in 1969 or earlier (%) - Black or African American
Year householder moved into unit - Moved in 1969 or earlier (%) - Asian
Year householder moved into unit - Moved in 1969 or earlier (%) - Hispanic or Latino
Year householder moved into unit - Moved in 1969 or earlier (%) - American Indian and Alaska Native
Year householder moved into unit - Moved in 1969 or earlier (%) - Multirace
Year householder moved into unit - Moved in 1969 or earlier (%) - Other Race
Housing units lacking complete plumbing facilities (%)
Housing units lacking complete kitchen facilities (%)
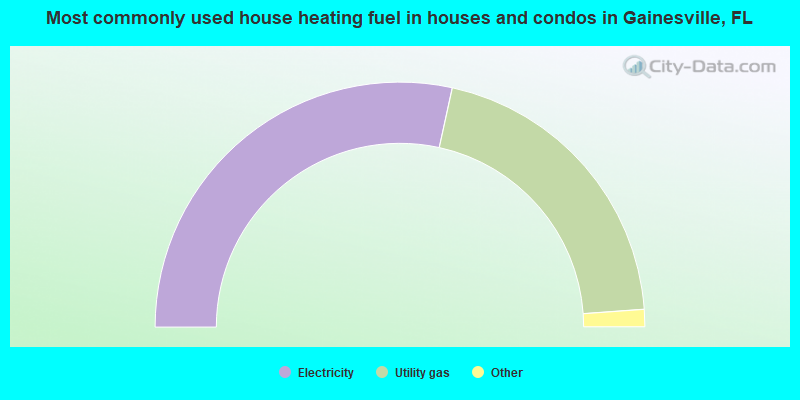
House heating fuel used in houses and condos - Utility gas (%)
House heating fuel used in houses and condos - Bottled, tank, or LP gas (%)
House heating fuel used in houses and condos - Electricity (%)
House heating fuel used in houses and condos - Fuel oil, kerosene, etc. (%)
House heating fuel used in houses and condos - Coal or coke (%)
House heating fuel used in houses and condos - Wood (%)
House heating fuel used in houses and condos - Solar energy (%)
House heating fuel used in houses and condos - Other fuel (%)
House heating fuel used in houses and condos - No fuel used (%)
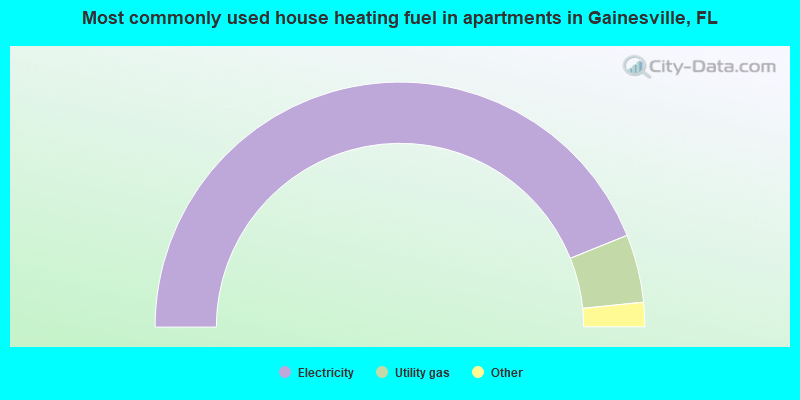
House heating fuel used in apartments - Utility gas (%)
House heating fuel used in apartments - Bottled, tank, or LP gas (%)
House heating fuel used in apartments - Electricity (%)
House heating fuel used in apartments - Fuel oil, kerosene, etc. (%)
House heating fuel used in apartments - Coal or coke (%)
House heating fuel used in apartments - Wood (%)
House heating fuel used in apartments - Solar energy (%)
House heating fuel used in apartments - Other fuel (%)
House heating fuel used in apartments - No fuel used (%)
Latest news about housing in Gainesville, FL collected exclusively by city-data.com from local newspapers, TV, and radio stations
Median year house/condo built: 1978Median year apartment built: 1986Household type by relationship:
Households: 145,212
Male householders: 26,352 (9,579 living alone ), Female householders: 33,991 (13,486 living alone )15,586 spouses (15,244 opposite-sex spouses ), 3,203 unmarried partners , (3,067 opposite-sex unmarried partners ), 23,375 children (22,202 natural , 376 adopted , 797 stepchildren ), 2,699 grandchildren , 1,189 brothers or sisters , 1,659 parents , 0 foster children , 1,718 other relatives , 18,005 non-relatives In group quarters: 17,435
Size of family households: 10,900 2-persons , 8,245 3-persons , 3,314 4-persons , 1,154 5-persons , 472 6-persons , 559 7-or-more-persons .
Size of nonfamily households: 23,065 1-person , 7,073 2-persons , 2,211 3-persons , 3,176 4-persons , 107 5-persons , 67 6-persons .
10,563 married couples with children. single-parent households (521 men , 4,275 women ).
82.3% of residents of Gainesville speak English at home. of residents speak Spanish at home (85% speak English very well , 9% speak English well , 4% speak English not well , 2% don't speak English at all ).of residents speak other Indo-European language at home (80% speak English very well , 13% speak English well , 5% speak English not well , 2% don't speak English at all ).of residents speak Asian or Pacific Island language at home (63% speak English very well , 27% speak English well , 6% speak English not well , 4% don't speak English at all ).of residents speak other language at home (84% speak English very well , 11% speak English well , 5% speak English not well ).
Foreign born population: 17,831 (12.3%)of them are naturalized citizens )
Median number of rooms in houses and condos:
Median number of rooms in apartments
Owner-occupied Renter-occupied
Bedrooms in owner-occupied houses and condos in Gainesville, Florida
80 no bedroom 364 1 bedroom 4,806 2 bedrooms 10,970 3 bedrooms 6,535 4 bedrooms 660 5+ bedrooms
Bedrooms in renter-occupied apartments in Gainesville, Florida
2,478 no bedroom 7,699 1 bedroom 16,353 2 bedrooms 5,717 3 bedrooms 4,574 4 bedrooms 107 5+ bedrooms
Owner-occupied Renter-occupied
Rooms in owner-occupied houses in Gainesville, Florida
80 1 room 0 2 rooms 445 3 rooms 3,333 4 rooms 3,981 5 rooms 6,327 6 rooms 3,331 7 rooms 3,334 8 rooms 2,584 9+ rooms
Rooms in renter-occupied apartments in Gainesville, Florida
2,183 1 room 3,377 2 rooms 5,775 3 rooms 10,384 4 rooms 8,741 5 rooms 5,011 6 rooms 866 7 rooms 350 8 rooms 241 9+ rooms
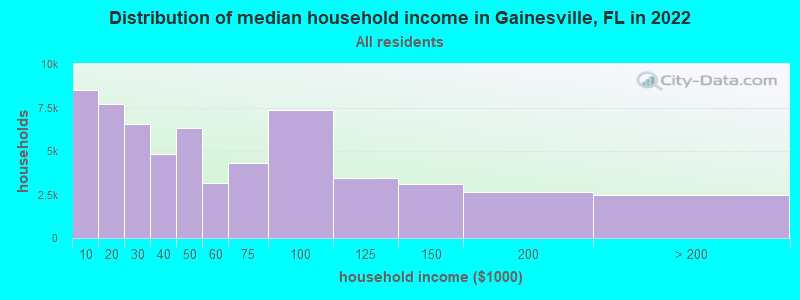
Gainesville, FL household income distribution 8,480 Less than $10,0007,715 $10,000 to $19,9996,574 $20,000 to $29,9994,837 $30,000 to $39,9996,348 $40,000 to $49,9993,157 $50,000 to $59,9994,289 $60,000 to $74,9997,331 $75,000 to $99,9993,445 $100,000 to $124,9993,107 $125,000 to $149,9992,615 $150,000 to $199,9992,445 $200,000 or more
Home value of owner - occupied houses in 2022 in Gainesville, FL 436 Less than $10,000124 $10,000 to $14,999361 $15,000 to $19,99997 $20,000 to $24,99998 $25,000 to $29,99924 $30,000 to $34,99910 $35,000 to $39,999179 $40,000 to $49,99986 $50,000 to $59,999122 $60,000 to $69,999147 $70,000 to $79,999293 $80,000 to $89,999243 $90,000 to $99,9991,144 $100,000 to $124,999955 $125,000 to $149,9991,304 $150,000 to $174,9992,212 $175,000 to $199,9994,213 $200,000 to $249,9993,070 $250,000 to $299,9993,906 $300,000 to $399,9991,185 $400,000 to $499,9991,318 $500,000 to $749,999168 $750,000 to $999,99999 $1,000,000 to $1,499,99946 $1,500,000 to $1,999,99928 $2,000,000 or moreRent paid by renters in 2022 in Gainesville, FL 147 Less than $100674 $100 to $149443 $150 to $199288 $200 to $249100 $250 to $29950 $300 to $349617 $350 to $399478 $400 to $449395 $450 to $499378 $500 to $549955 $550 to $599901 $600 to $6491,870 $650 to $6991,444 $700 to $7491,600 $750 to $7992,558 $800 to $8992,809 $900 to $9998,820 $1,000 to $1,2494,586 $1,250 to $1,4993,997 $1,500 to $1,9992,075 $2,000 to $2,499110 $2,500 to $2,999694 $3,000 to $3,499225 $3,500 or more714 No cash rent
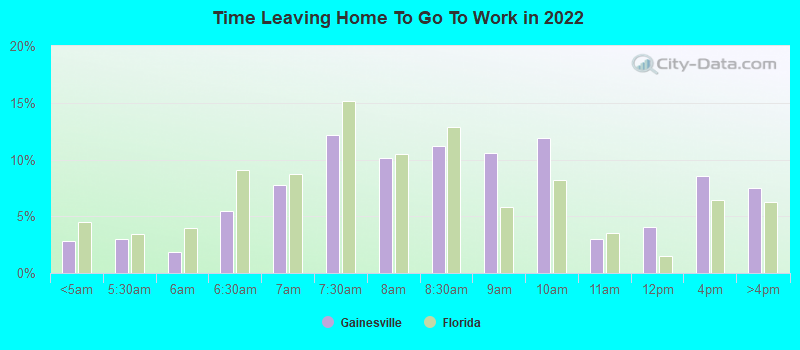
Percentage of workers working in this county: 93.5%Number of people working at home: 10,049 (15.0% of all workers )
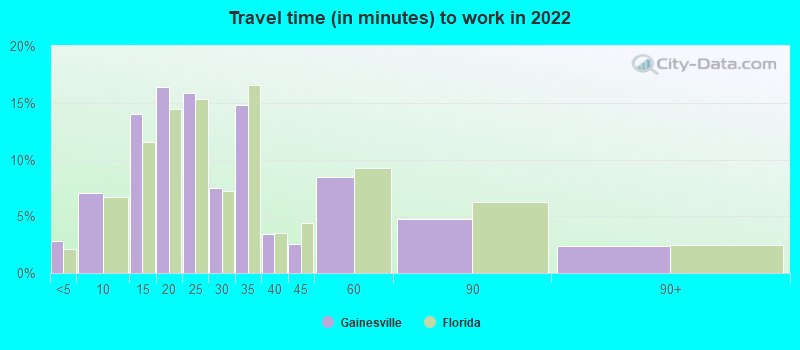
Travel time to work (commute)
Less than 5 minutes: 3,1015 to 9 minutes: 6,41810 to 14 minutes: 12,53315 to 19 minutes: 11,68720 to 24 minutes: 9,09325 to 29 minutes: 3,70130 to 34 minutes: 5,95635 to 39 minutes: 1,25340 to 44 minutes: 8545 to 59 minutes: 1,90360 to 89 minutes: 85890 or more minutes: 373
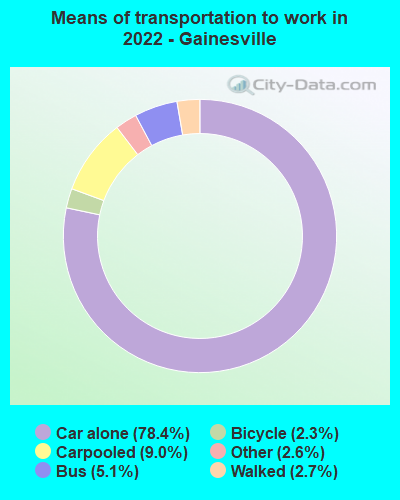
Means of transportation to work:
Drove a car alone: 76,173 (71.1%)Carpooled: 8,737 (8.1%)Bus : 4,946 (4.6%)Taxi: 2,490 (2.3%)Bicycle: 2,206 (2.1%)Walked: 2,604 (2.4%)Worked at home: 10,049 (9.4%)
Unemployment by race in 2022
Unemployment rate for White non-Hispanic residents 7.1% Males6.8% FemalesUnemployment rate for Black residents 5.1% Males11.1% FemalesUnemployment rate for American Indian and Alaska Native residents 9.6% MalesUnemployment rate for Asian residents 2.3% Males4.3% FemalesUnemployment rate for other race residents 6.5% Males1.0% FemalesUnemployment rate for two or more race residents 7.8% Males13.5% FemalesUnemployment rate for Hispanic or Latino residents 6.0% Males2.5% Females
Year of entry for the foreign-born population in Gainesville, Florida
10,359 2010 or later 3,529 2000 to 2009 1,880 1990 to 1999 2,004 1980 to 1989 866 1970 to 1979 904 Before 1970
First ancestries reported:
English: 6,895 (9.5%)
German: 4,030 (5.6%)
Irish: 3,906 (5.4%)
American: 3,153 (4.4%)
Italian: 2,457 (3.4%)
European: 1,276 (1.8%)
Polish: 1,012 (1.4%)
Scottish: 816 (1.1%)
Jamaican: 612 (0.8%)
African: 544 (0.8%)
Haitian: 491 (0.7%)
Brazilian: 485 (0.7%)
Russian: 448 (0.6%)
French: 440 (0.6%)
Scotch-Irish: 435 (0.6%)
Welsh: 401 (0.6%)
Iranian: 387 (0.5%)
Egyptian: 364 (0.5%)
British: 363 (0.5%)
Eastern European: 297 (0.4%)
Albanian: 289 (0.4%)
Norwegian: 277 (0.4%)
Greek: 271 (0.4%)
French Canadian: 268 (0.4%)
Portuguese: 239 (0.3%)
Ukrainian: 199 (0.3%)
Canadian: 182 (0.3%)
Hungarian: 166 (0.2%)
Danish: 165 (0.2%)
Trinidadian and Tobagonian: 160 (0.2%)
Belgian: 149 (0.2%)
Czech: 141 (0.2%)
Swedish: 133 (0.2%)
Lithuanian: 130 (0.2%)
Bulgarian: 128 (0.2%)
Palestinian: 127 (0.2%)
Dutch: 124 (0.2%)
Turkish: 122 (0.2%)
Northern European: 116 (0.2%)
Israeli: 104 (0.1%)
Slovene: 103 (0.1%)
Scandinavian: 98 (0.1%)
Lebanese: 96 (0.1%)
Austrian: 89 (0.1%)
Nigerian: 79 (0.1%)
Iraqi: 73 (0.1%)
U.S. Virgin Islander: 72 (0.10%)
Syrian: 57 (0.08%)
Armenian: 51 (0.07%)
Guyanese: 51 (0.07%)
Australian: 45 (0.06%)
Ethiopian: 38 (0.05%)
Kenyan: 38 (0.05%)
Slovak: 35 (0.05%)
Romanian: 35 (0.05%)
Luxembourger: 34 (0.05%)
Pennsylvania German: 31 (0.04%)
Arab: 30 (0.04%)
Bahamian: 21 (0.03%)
Yugoslavian: 20 (0.03%)
Ghanaian: 18 (0.02%)
Serbian: 14 (0.02%)
Finnish: 13 (0.02%)
Celtic: 12 (0.02%)
Czechoslovakian: 11 (0.02%)
Jordanian: 7 (0.01%)
Croatian: 7 (0.01%)
West Indian: 7 (0.01%)
Cape Verdean: 6 (0.01%)
German Russian: 4 (0.01%)
Most common places of birth for foreign-born residents (%): India Gainesville:
10.5% (1,762)Florida:
2.1% (94,349)
China, excluding Hong Kong and Taiwan Gainesville:
8.9% (1,489)Florida:
1.2% (56,071)
Cuba Gainesville:
7.3% (1,218)Florida:
22.0% (1,006,576)
Brazil Gainesville:
5.8% (980)Florida:
2.7% (122,906)
Venezuela Gainesville:
5.6% (931)Florida:
5.7% (262,042)
Canada Gainesville:
3.9% (654)Florida:
2.4% (109,132)
Philippines Gainesville:
3.9% (653)Florida:
1.8% (84,403)
Colombia Gainesville:
3.3% (552)Florida:
6.5% (298,669)
Vietnam Gainesville:
3.1% (519)Florida:
1.3% (60,604)
Saudi Arabia Gainesville:
2.8% (464)Florida:
0.1% (4,597)
Iran Gainesville:
2.8% (461)Florida:
0.2% (11,000)
Korea Gainesville:
2.5% (413)Florida:
0.4% (19,445)
Haiti Gainesville:
2.0% (337)Florida:
7.5% (342,375)
Mexico Gainesville:
1.8% (296)Florida:
5.6% (257,152)
Jamaica Gainesville:
1.7% (282)Florida:
5.0% (227,319)
Argentina Gainesville:
1.5% (259)Florida:
1.3% (57,263)
Place of birth for U.S.-born residents:
This state: 78,767Other state: 44,369Northeast: 12,054Midwest: 9,795South: 18,559West: 3,961 73.3% of Gainesville residents lived in the same house 1 years ago.
Out of people who lived in different houses, 32.7% lived in this county.
Out of people who lived in different counties, 82.0% lived in Florida.
Gainesville:
73.3%State average:
86.3%
Education attainment for males 25 years and older:
No schooling: 241Nursery to 4th grade: 05th and 6th grade: 1817th and 8th grade: 1769th grade: 21810th grade: 13311th grade: 32712th grade, no diploma: 74High school graduate (or equivalency): 7,806Less than 1 year of college: 1,109Some college more than 1 year, no degree: 4,397Associate degree: 2,484Bachelor's degree: 8,776Master's degree: 6,207Professional school degree: 959Doctorate degree: 3,377
Education attainment for females 25 years and older:
No schooling: 0Nursery to 4th grade: 985th and 6th grade: 727th and 8th grade: 1489th grade: 27110th grade: 53211th grade: 26012th grade, no diploma: 1,187High school graduate (or equivalency): 7,019Less than 1 year of college: 2,591Some college more than 1 year, no degree: 4,078Associate degree: 4,762Bachelor's degree: 8,974Master's degree: 6,637Professional school degree: 1,231Doctorate degree: 2,197
Housing units in structures:
One, detached: 24,150One, attached: 4,368Two: 1,3983 or 4: 5,0615 to 9: 8,47910 to 19: 11,89320 to 49: 4,24450 or more: 5,659Mobile homes: 1,330Median worth of mobile homes: $9,999
Housing units lacking complete plumbing facilities in 2022: 0.7%Housing units lacking complete kitchen facilities in 2022: 1.1%House/condo owner moved in on average 10 years ago
Renter moved in on average 0 years ago
Private vs. public school enrollment:
Students in private schools in grades 1 to 8 (elementary and middle school): 506 Students in private schools in grades 9 to 12 (high school): 59 Students in private undergraduate colleges: 909