Frederickson, WA (Washington) Houses and Residents
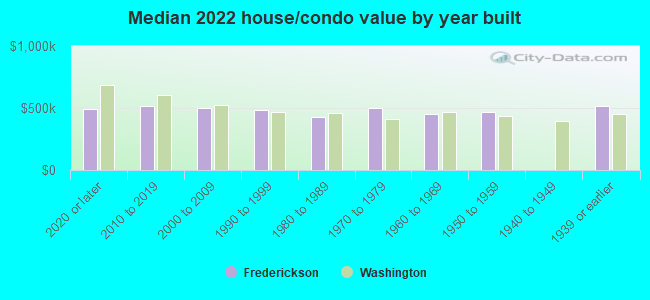
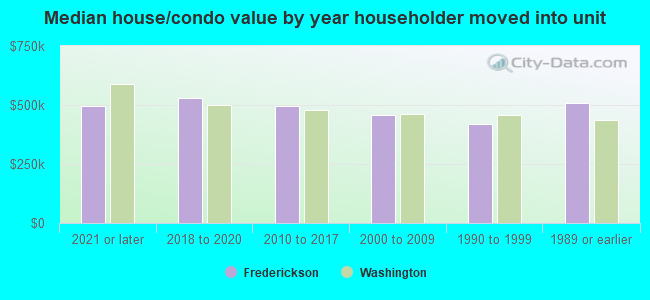
| Frederickson: | $506,524 |
| Washington: | $569,500 |
Total population: 18,719 (Urban population: 5,564, Rural population: 240 (all nonfarm))
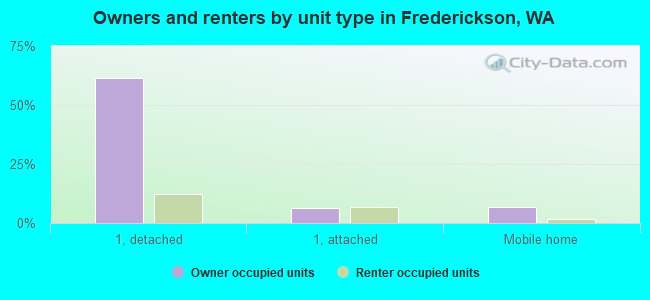
Houses: 8,239 (7,825 occupied: 5,901 owner occupied, 1,926 renter occupied)
| % of renters here: | 25% |
| State: | 36% |
Housing density: 1,130 houses/condos per square mile
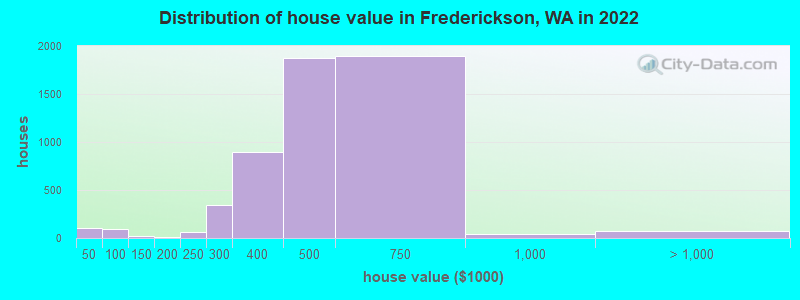
Median price asked for vacant for-sale houses and condos in 2022: $841,603.
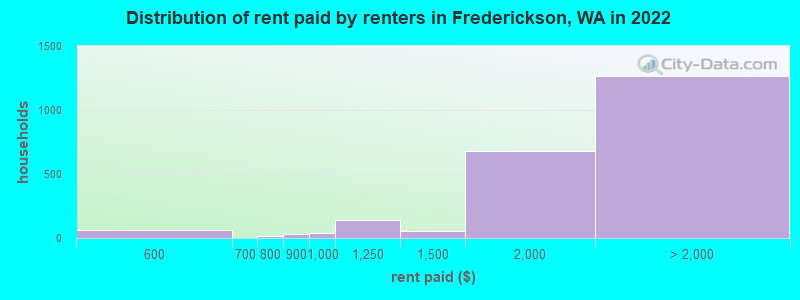
Median contract rent in 2022: over $2,000 (lower quartile is $1,675, upper quartile is over $2,000)
Median rent asked for vacant for-rent units in 2022: $1,955
Median gross rent in Frederickson, WA in 2022: over $2,000
Housing units in Frederickson with a mortgage: 4,653 (589 second mortgage, 0 home equity loan, 340 both second mortgage and home equity loan)
Houses without a mortgage: 35
Median household income for houses/condos with a mortgage: $116,449
Median household income for apartments without a mortgage: $81,883
Median monthly housing costs: $1,967
Compare current foreclosures near Frederickson, WA:
| Photo | Address | Area | Beds / Baths | Price | Details |
|---|---|---|---|---|---|

|
#1
N 31st St Apt 401
Tacoma, WA 98403
|
2,110 sq. feet
|
2 baths 2 beds |
show details | |

|
#2
6715 Steilacoom Blvd SW
Lakewood, WA 98499
|
1,176 sq. feet
|
2 baths 2 beds |
show details | |

|
#3
28th St NW
Puyallup, WA 98371
|
- sq. feet
|
3 baths 5 beds |
show details | |

|
#4
77th St E
Puyallup, WA 98371
|
2,140 sq. feet
|
3 baths 3 beds |
show details | |

|
#5
Browns Point Blvd
Tacoma, WA 98422
|
2,061 sq. feet
|
1 baths 2 beds |
show details | |

|
#6
77th Street Ct E
Tacoma, WA 98404
|
1,782 sq. feet
|
2 baths 4 beds |
show details | |

|
#7
Alaska St S
Tacoma, WA 98444
|
1,050 sq. feet
|
3 baths 4 beds |
show details | |

|
#8
S 92nd St
Tacoma, WA 98444
|
1,032 sq. feet
|
1 baths 3 beds |
show details | |

|
#9
S 91st St
Tacoma, WA 98444
|
1,152 sq. feet
|
1 baths 3 beds |
show details | |

|
#10
9th Avenue Ct SE
Puyallup, WA 98372
|
1,262 sq. feet
|
1 baths 3 beds |
show details |
| Photo | Address | Area | Beds / Baths | Price | Details |
|---|---|---|---|---|---|

|
#11
S D St
Tacoma, WA 98444
|
1,373 sq. feet
|
2 baths 3 beds |
show details | |

|
#12
Prairie Creek Loop SE
Yelm, WA 98597
|
1,536 sq. feet
|
3 baths 3 beds |
show details | |

|
#13
E 82nd St
Tacoma, WA 98404
|
836 sq. feet
|
1 baths 2 beds |
show details | |

|
#14
15th Ct SW
Federal Way, WA 98023
|
1,890 sq. feet
|
3 baths 4 beds |
show details | |

|
#15
S Howard St
Tacoma, WA 98465
|
1,082 sq. feet
|
1 baths 2 beds |
show details | |

|
#16
S 86th St
Tacoma, WA 98444
|
1,510 sq. feet
|
1 baths 4 beds |
show details | |

|
#17
Trump Ave NW
Yelm, WA 98597
|
1,793 sq. feet
|
3 baths 3 beds |
show details | |

|
#18
34th Ave S
Roy, WA 98580
|
1,768 sq. feet
|
2 baths 4 beds |
show details | |

|
#19
27th St W Apt 9b
Tacoma, WA 98466
|
1,500 sq. feet
|
2 baths 3 beds |
show details | |

|
#20
E 64th St
Tacoma, WA 98404
|
3,092 sq. feet
|
4 baths 8 beds |
show details |
| Photo | Address | Area | Beds / Baths | Price | Details |
|---|---|---|---|---|---|

|
#21
E 64th St
Tacoma, WA 98404
|
3,092 sq. feet
|
4 baths 8 beds |
show details | |

|
#22
25th Ave S
Lakewood, WA 98499
|
2,080 sq. feet
|
1 baths 4 beds |
show details | |

|
#23
E 66th St
Tacoma, WA 98404
|
1,584 sq. feet
|
1 baths 4 beds |
show details | |

|
#24
2nd Ave N
Auburn, WA 98001
|
1,690 sq. feet
|
1 baths 3 beds |
show details | |

|
#25
Browns Point Blvd
Tacoma, WA 98422
|
2,847 sq. feet
|
3 baths 4 beds |
show details | |

|
#26
E 63rd St
Tacoma, WA 98404
|
1,360 sq. feet
|
1 baths 3 beds |
show details | |

|
#27
E 59th St
Tacoma, WA 98404
|
1,016 sq. feet
|
1 baths 3 beds |
show details | |

|
#28
S 74th St
Tacoma, WA 98408
|
1,248 sq. feet
|
1 baths 3 beds |
show details | |

|
#29
55th St SE
Auburn, WA 98092
|
2,680 sq. feet
|
3 baths 4 beds |
show details | |

|
#30
32nd Ave E
Eatonville, WA 98328
|
2,112 sq. feet
|
2 baths 4 beds |
show details |
| Photo | Address | Area | Beds / Baths | Price | Details |
|---|---|---|---|---|---|

|
#31
13th Pl SW
Federal Way, WA 98023
|
1,850 sq. feet
|
3 baths 3 beds |
show details | |

|
#32
14th St SW
Puyallup, WA 98371
|
1,920 sq. feet
|
1 baths 3 beds |
show details | |

|
#33
Violet Meadow St S
Tacoma, WA 98444
|
804 sq. feet
|
1 baths 2 beds |
show details | |

|
#34
Kline St SW
Lakewood, WA 98499
|
1,008 sq. feet
|
1 baths 2 beds |
show details | |

|
#35
13th Avenue Ct E
Spanaway, WA 98387
|
5,465 sq. feet
|
3 baths 5 beds |
show details | |

|
#36
Clark Rd SE
Yelm, WA 98597
|
1,792 sq. feet
|
1 baths 1 beds |
show details | |

|
#37
186th St E
Spanaway, WA 98387
|
1,625 sq. feet
|
1 baths 3 beds |
show details | |

|
#38
155th St E
Tacoma, WA 98445
|
2,376 sq. feet
|
1 baths 3 beds |
show details | |

|
#39
172nd St E
Spanaway, WA 98387
|
2,148 sq. feet
|
1 baths 3 beds |
show details | |

|
#40
42nd Ave E
Tacoma, WA 98446
|
1,772 sq. feet
|
2 baths 3 beds |
show details |
| Photo | Address | Area | Beds / Baths | Price | Details |
|---|---|---|---|---|---|

|
#41
17th St SE
Auburn, WA 98002
|
1,987 sq. feet
|
2 baths 4 beds |
show details | |

|
#42
119th Ave E
Puyallup, WA 98374
|
1,512 sq. feet
|
2 baths 3 beds |
show details | |

|
#43
124th Avenue Ct E
Puyallup, WA 98374
|
924 sq. feet
|
3 baths 5 beds |
show details | |

|
#44
170th St E
Spanaway, WA 98387
|
1,270 sq. feet
|
2 baths 3 beds |
show details | |

|
#45
9th Ave E
Tacoma, WA 98445
|
1,264 sq. feet
|
2 baths 2 beds |
show details | |

|
#46
167th St E
Spanaway, WA 98387
|
1,818 sq. feet
|
2 baths 2 beds |
show details | |

|
#47
167th Street
Spanaway, WA 98387
|
1,812 sq. feet
|
2 baths 3 beds |
show details | |

|
#48
Viewmont St
Tacoma, WA 98407
|
1,488 sq. feet
|
1 baths 3 beds |
show details | |

|
#49
108th Ave E
Puyallup, WA 98374
|
- sq. feet
|
2 baths 5 beds |
show details | |

|
Check over 1 million property listings on Foreclosure.com!
|
browse all offers | |||

Latest news about housing in Frederickson, WA collected exclusively by city-data.com from local newspapers, TV, and radio stations


Median year apartment built: 2006
Household type by relationship:
Households: 24,966- Male householders: 4,058 (607 living alone), Female householders: 3,618 (495 living alone)
4,678 spouses (4,519 opposite-sex spouses), 983 unmarried partners, (940 opposite-sex unmarried partners), 8,508 children (8,031 natural, 64 adopted, 412 stepchildren), 566 grandchildren, 427 brothers or sisters, 406 parents, 48 foster children, 405 other relatives, 1,252 non-relatives
- In group quarters: 11
Size of family households: 2,104 2-persons, 1,018 3-persons, 1,292 4-persons, 862 5-persons, 202 6-persons, 417 7-or-more-persons.
Size of nonfamily households: 1,122 1-person, 496 2-persons, 259 3-persons, 12 5-persons, 47 7-or-more-persons.
4,683 married couples with children.
2,011 single-parent households (1,208 men, 803 women).
77.6% of residents of Frederickson speak English at home.
8.8% of residents speak Spanish at home (63% speak English very well, 24% speak English well, 7% speak English not well, 7% don't speak English at all).
5.8% of residents speak other Indo-European language at home (48% speak English very well, 28% speak English well, 15% speak English not well, 10% don't speak English at all).
5.6% of residents speak Asian or Pacific Island language at home (69% speak English very well, 21% speak English well, 6% speak English not well, 4% don't speak English at all).
2.0% of residents speak other language at home (59% speak English very well, 37% speak English well, 5% speak English not well).
Foreign born population: 3,305 (13.2%)
(57.4% of them are naturalized citizens)
| Here: | 6.3 |
| State: | 6.5 |
| Here: | 5.3 |
| State: | 3.9 |
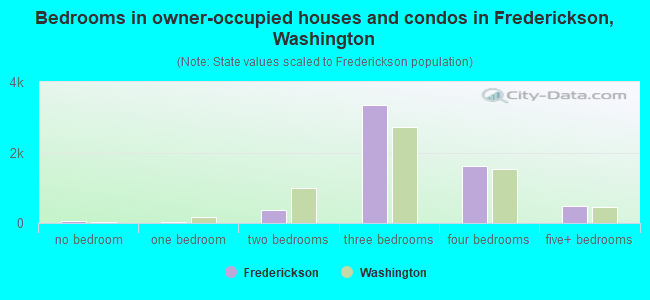
- Bedrooms in owner-occupied houses and condos in Frederickson, Washington
- 70no bedroom
- 261 bedroom
- 3602 bedrooms
- 3,3453 bedrooms
- 1,6114 bedrooms
- 4905+ bedrooms
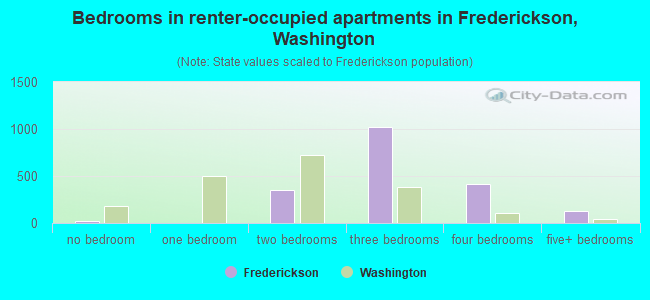
- Bedrooms in renter-occupied apartments in Frederickson, Washington
- 21no bedroom
- 01 bedroom
- 3502 bedrooms
- 1,0193 bedrooms
- 4114 bedrooms
- 1275+ bedrooms
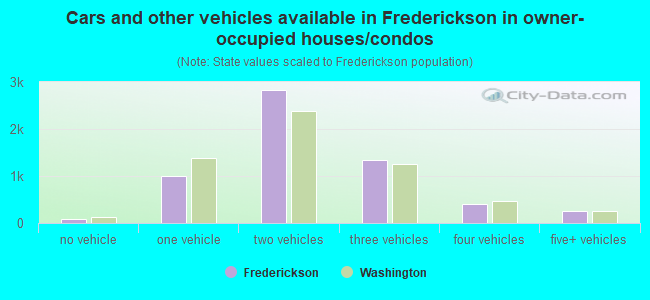
- Cars and other vehicles available in Frederickson in owner-occupied houses/condos
- 83no vehicle
- 9941 vehicle
- 2,8302 vehicles
- 1,3513 vehicles
- 3984 vehicles
- 2455+ vehicles
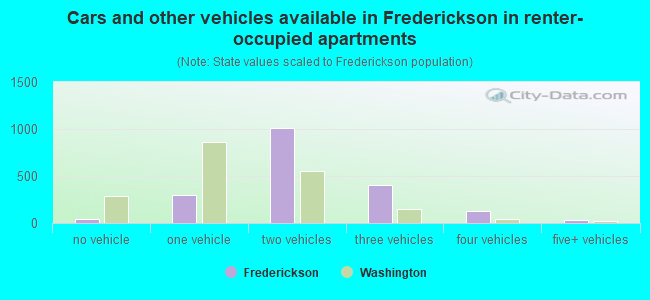
- Cars and other vehicles available in Frederickson in renter-occupied apartments
- 46no vehicle
- 3021 vehicle
- 1,0102 vehicles
- 4053 vehicles
- 1304 vehicles
- 325+ vehicles
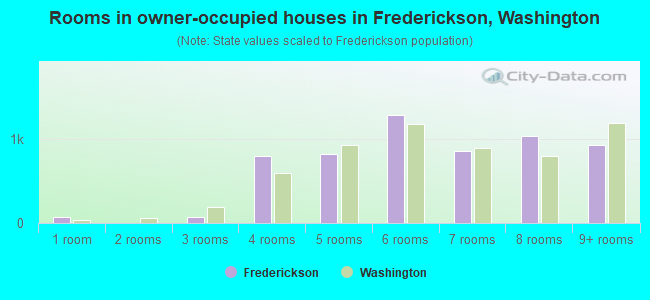
- Rooms in owner-occupied houses in Frederickson, Washington
- 701 room
- 02 rooms
- 693 rooms
- 8064 rooms
- 8285 rooms
- 1,2936 rooms
- 8637 rooms
- 1,0378 rooms
- 9359+ rooms
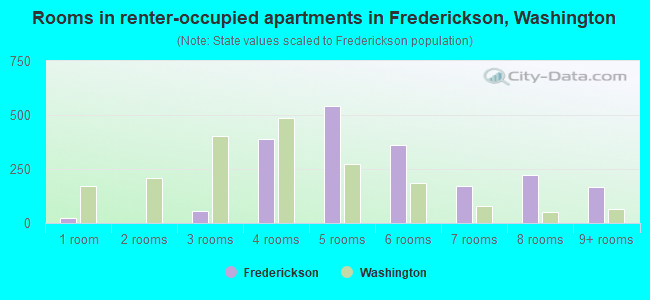
- Rooms in renter-occupied apartments in Frederickson, Washington
- 211 room
- 02 rooms
- 553 rooms
- 3894 rooms
- 5415 rooms
- 3606 rooms
- 1737 rooms
- 2228 rooms
- 1669+ rooms
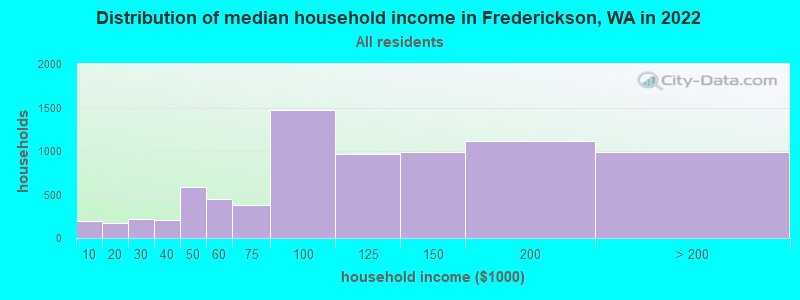
Frederickson, WA household income distribution

- 197Less than $10,000
- 171$10,000 to $19,999
- 223$20,000 to $29,999
- 207$30,000 to $39,999
- 591$40,000 to $49,999
- 451$50,000 to $59,999
- 384$60,000 to $74,999
- 1,477$75,000 to $99,999
- 961$100,000 to $124,999
- 983$125,000 to $149,999
- 1,120$150,000 to $199,999
- 986$200,000 or more
Home value of owner - occupied houses in 2022 in Frederickson, WA
-
- 29Less than $10,000
- 9$10,000 to $14,999
- 19$15,000 to $19,999
- 10$20,000 to $24,999
- 21$30,000 to $34,999
- 5$35,000 to $39,999
- 10$40,000 to $49,999
- 74$70,000 to $79,999
- 8$90,000 to $99,999
- 23$100,000 to $124,999
- 13$150,000 to $174,999
- 66$200,000 to $249,999
- 341$250,000 to $299,999
- 900$300,000 to $399,999
- 1,877$400,000 to $499,999
- 1,890$500,000 to $749,999
- 45$750,000 to $999,999
- 29$1,000,000 to $1,499,999
- 40$2,000,000 or more
Rent paid by renters in 2022 in Frederickson, WA
-
- 62$500 to $549
- 11$700 to $749
- 31$800 to $899
- 41$900 to $999
- 141$1,000 to $1,249
- 54$1,250 to $1,499
- 677$1,500 to $1,999
- 569$2,000 to $2,499
- 630$2,500 to $2,999
- 68No cash rent
Percentage of workers working in this county: 78.0%
Number of people working at home: 1,389 (12.3% of all workers)
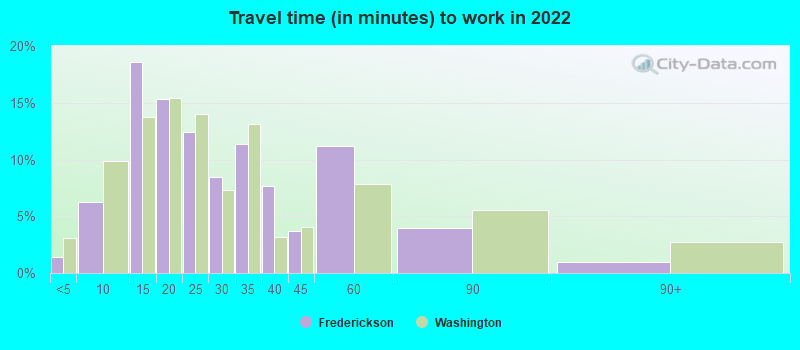
Travel time to work (commute)
- Less than 5 minutes: 150
- 5 to 9 minutes: 455
- 10 to 14 minutes: 473
- 15 to 19 minutes: 704
- 20 to 24 minutes: 1,294
- 25 to 29 minutes: 1,050
- 30 to 34 minutes: 1,633
- 35 to 39 minutes: 642
- 40 to 44 minutes: 373
- 45 to 59 minutes: 1,313
- 60 to 89 minutes: 916
- 90 or more minutes: 486
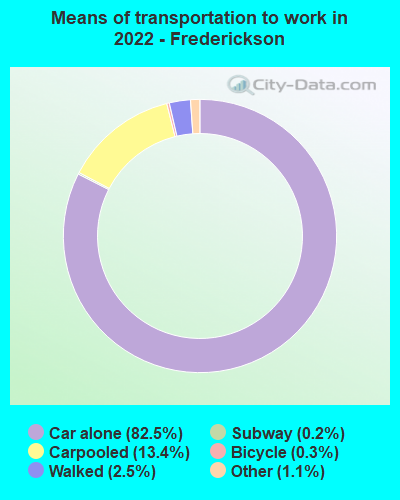
Means of transportation to work:
- Drove a car alone: 5,364 (67.4%)
- Carpooled: 903 (11.3%)
- Long-distance train or commuter rail: 13 (0.2%)
- Taxi: 67 (0.8%)
- Bicycle: 30 (0.4%)
- Walked: 212 (2.7%)
- Worked at home: 1,389 (17.5%)
- Unemployment by race in 2022
- Unemployment rate for White non-Hispanic residents
- 5.1%Males
- 3.1%Females
- Unemployment rate for Black residents
- 16.8%Males
- Unemployment rate for Asian residents
- 9.5%Males
- 6.0%Females
- Unemployment rate for two or more race residents
- 1.6%Males
- 3.7%Females
- Unemployment rate for Hispanic or Latino residents
- 25.5%Males
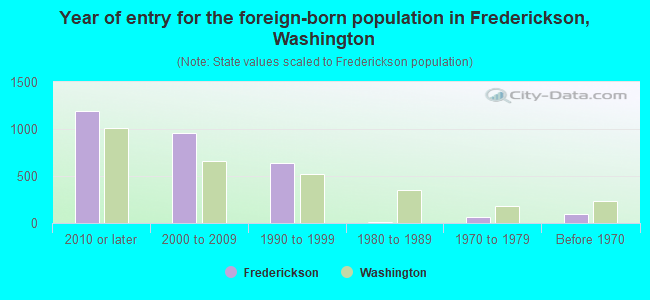
- Year of entry for the foreign-born population in Frederickson, Washington
- 1,1882010 or later
- 9602000 to 2009
- 6331990 to 1999
- 141980 to 1989
- 621970 to 1979
- 97Before 1970
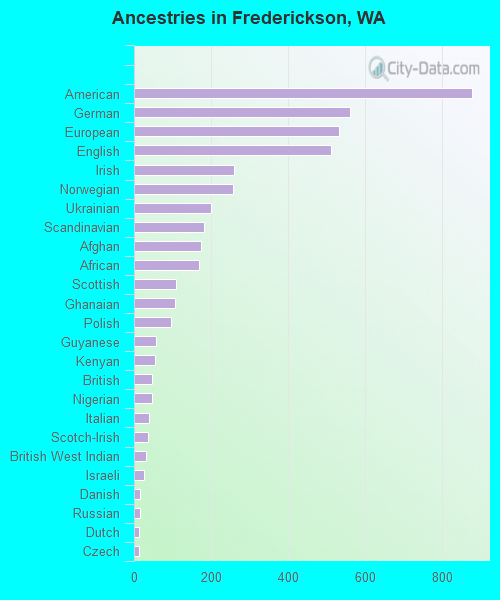
First ancestries reported:
- American: 877 (8.9%)
- German: 559 (5.6%)
- European: 533 (5.4%)
- English: 510 (5.1%)
- Irish: 260 (2.6%)
- Norwegian: 256 (2.6%)
- Ukrainian: 199 (2.0%)
- Scandinavian: 182 (1.8%)
- Afghan: 174 (1.8%)
- African: 168 (1.7%)
- Scottish: 110 (1.1%)
- Ghanaian: 107 (1.1%)
- Polish: 97 (1.0%)
- Guyanese: 56 (0.6%)
- Kenyan: 55 (0.6%)
- British: 47 (0.5%)
- Nigerian: 47 (0.5%)
- Italian: 40 (0.4%)
- Scotch-Irish: 37 (0.4%)
- British West Indian: 30 (0.3%)
- Israeli: 25 (0.3%)
- Danish: 16 (0.2%)
- Russian: 16 (0.2%)
- Dutch: 13 (0.1%)
- Czech: 12 (0.1%)
- Pennsylvania German: 9 (0.09%)
- Swedish: 8 (0.08%)
- Canadian: 7 (0.07%)
- French Canadian: 7 (0.07%)
- Romanian: 5 (0.05%)
Most common places of birth for foreign-born residents (%):
| Frederickson: | 18.9% (605) |
| Washington: | 0.2% (2,421) |
| Frederickson: | 17.7% (569) |
| Washington: | 21.1% (241,655) |
| Frederickson: | 11.9% (383) |
| Washington: | 6.3% (71,661) |
| Frederickson: | 6.3% (202) |
| Washington: | 4.3% (48,886) |
| Frederickson: | 6.2% (198) |
| Washington: | 0.3% (3,083) |
| Frederickson: | 5.8% (186) |
| Washington: | 3.1% (35,872) |
| Frederickson: | 4.3% (138) |
| Washington: | 0.5% (5,851) |
| Frederickson: | 3.9% (126) |
| Washington: | 0.1% (1,702) |
| Frederickson: | 2.9% (92) |
| Washington: | 1.1% (12,735) |
| Frederickson: | 2.5% (79) |
| Washington: | 0.3% (3,471) |
| Frederickson: | 2.1% (67) |
| Washington: | 0.0% (502) |
| Frederickson: | 2.0% (64) |
| Washington: | 0.4% (4,963) |
| Frederickson: | 2.0% (64) |
| Washington: | 1.6% (17,761) |
| Frederickson: | 1.9% (61) |
| Washington: | 0.5% (5,640) |
| Frederickson: | 1.7% (55) |
| Washington: | 0.8% (9,457) |
Place of birth for U.S.-born residents:
- This state: 12,399
- Other state: 8,250
- Northeast: 775
- Midwest: 1,359
- South: 1,717
- West: 4,361
83.5% of Frederickson residents lived in the same house 1 years ago.
Out of people who lived in different houses, 35.4% lived in this county.
Out of people who lived in different counties, 57.9% lived in Washington.
| Frederickson: | 83.5% |
| State average: | 85.2% |
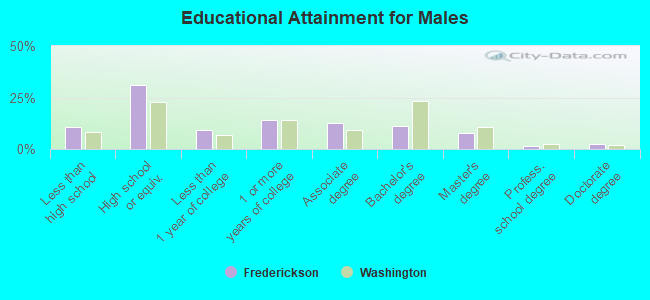
Education attainment for males 25 years and older:
- No schooling: 127
- Nursery to 4th grade: 0
- 5th and 6th grade: 23
- 7th and 8th grade: 198
- 9th grade: 24
- 10th grade: 20
- 11th grade: 72
- 12th grade, no diploma: 405
- High school graduate (or equivalency): 2,507
- Less than 1 year of college: 734
- Some college more than 1 year, no degree: 1,147
- Associate degree: 1,027
- Bachelor's degree: 891
- Master's degree: 636
- Professional school degree: 102
- Doctorate degree: 180
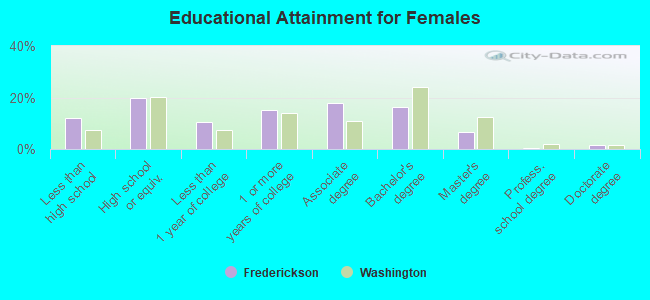
Education attainment for females 25 years and older:
- No schooling: 204
- Nursery to 4th grade: 8
- 5th and 6th grade: 244
- 7th and 8th grade: 68
- 9th grade: 156
- 10th grade: 40
- 11th grade: 55
- 12th grade, no diploma: 123
- High school graduate (or equivalency): 1,488
- Less than 1 year of college: 788
- Some college more than 1 year, no degree: 1,131
- Associate degree: 1,338
- Bachelor's degree: 1,243
- Master's degree: 504
- Professional school degree: 42
- Doctorate degree: 108


Housing units in structures:
- One, detached: 6,124
- One, attached: 961
- Two: 32
- 3 or 4: 114
- 5 to 9: 20
- 10 to 19: 105
- Mobile homes: 879
Median worth of mobile homes: $299,858
Housing units lacking complete kitchen facilities in 2022: 1.9%
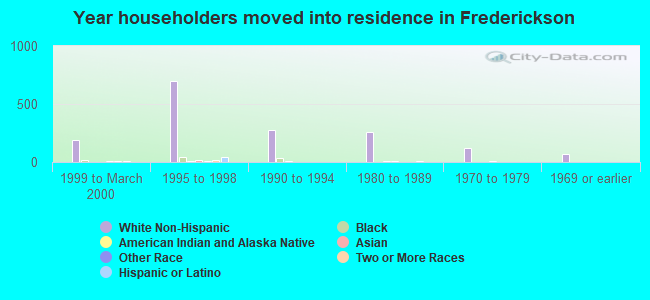
House/condo owner moved in on average 7 years ago
Renter moved in on average 3 years ago
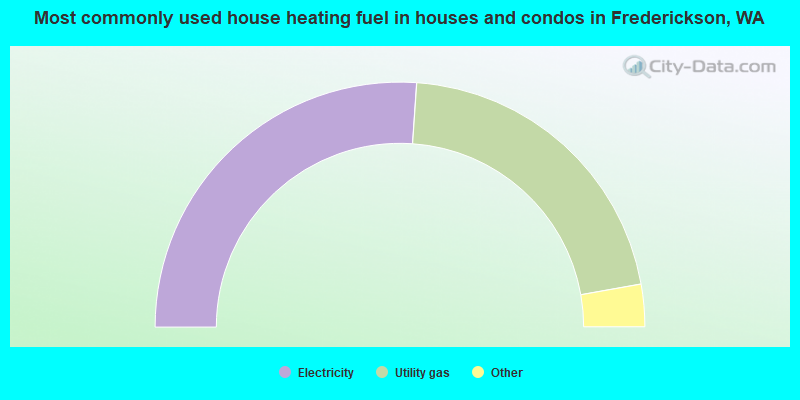
- 52.2%Electricity
- 42.2%Utility gas
- 2.8%Wood
- 2.4%Bottled, tank, or LP gas
- 0.3%Fuel oil, kerosene, etc.
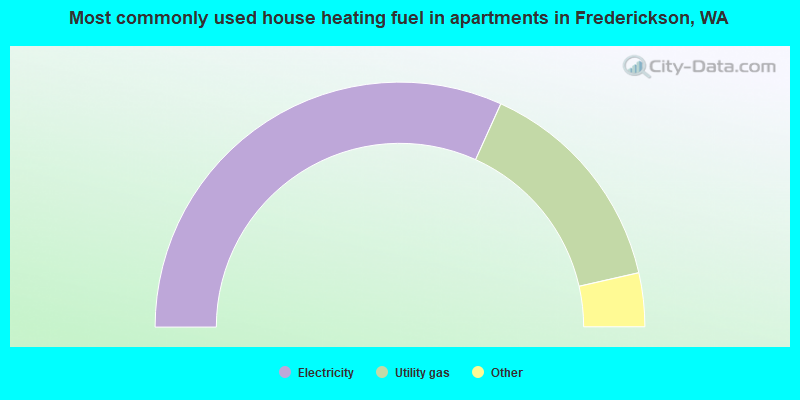
- 63.6%Electricity
- 29.4%Utility gas
- 3.4%Wood
- 2.4%No fuel used
- 1.2%Bottled, tank, or LP gas
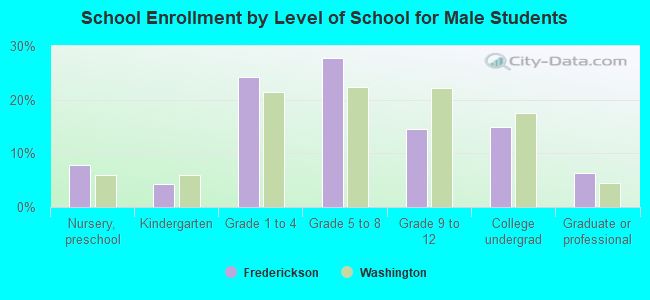
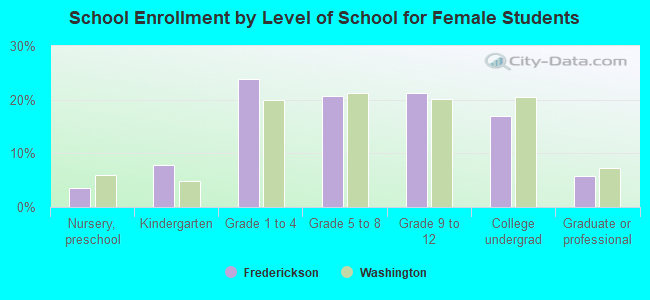
Private vs. public school enrollment:
| Here: | 9.1% |
| Washington: | 12.4% |
| Here: | 16.1% |
| Washington: | 9.2% |
| Here: | 43.4% |
| Washington: | 16.5% |